| Param | Original file | Final file |
|---|---|---|
| Filename | modeM0/AS1A05_088T05_9000003088_20949cztM0_level2.evt | modeM0/AS1A05_088T05_9000003088_20949cztM0_level2_quad_clean.evt |
| Size (bytes) | 560,689,920 | 107,475,840 |
| Size | 534.7 MB | 102.5 MB |
| Events in quadrant A | 3,631,815 | 702,633 |
| Events in quadrant B | 3,899,603 | 705,453 |
| Events in quadrant C | 3,640,075 | 672,665 |
| Events in quadrant D | 5,293,904 | 645,818 |
| Mode M9 | |||
|---|---|---|---|
| Quadrant | BADHDUFLAG | Total packets | Discarded packets |
| A | 0 | 3 | 0 |
| B | 0 | 3 | 0 |
| C | 0 | 3 | 0 |
| D | 0 | 3 | 0 |
| Mode M0 | |||
|---|---|---|---|
| Quadrant | BADHDUFLAG | Total packets | Discarded packets |
| A | 0 | 15707 | 1 |
| B | 0 | 16296 | 1 |
| C | 0 | 15715 | 1 |
| D | 0 | 20952 | 1 |
| Mode SS | |||
|---|---|---|---|
| Quadrant | BADHDUFLAG | Total packets | Discarded packets |
| A | 0 | 154 | 0 |
| B | 0 | 154 | 0 |
| C | 0 | 154 | 0 |
| D | 0 | 154 | 0 |
| Quadrant | Total seconds | Saturated seconds | Saturation percentage |
|---|---|---|---|
| A | 7592 | 78 | 1.027397% |
| B | 7593 | 118 | 1.554063% |
| C | 7593 | 105 | 1.382853% |
| D | 7593 | 335 | 4.411958% |
Noise dominated data is calculated using 1-second bins in cleaned event files. If a bin has >2000 counts, and if more than 50% of those come from <1% of pixels, then it is considered to be noise-dominated and hence unusable.
| Quadrant | # 1 sec bins | Bins with >0 counts | Bins with >2000 counts | High rate bins dominated by noise | Noise dominated (total time) | Noise dominated (detector-on time) | Marked lightcurve |
|---|---|---|---|---|---|---|---|
| A | 7892 | 7593 | 0 | 0 | 0.00% | 0.00% | 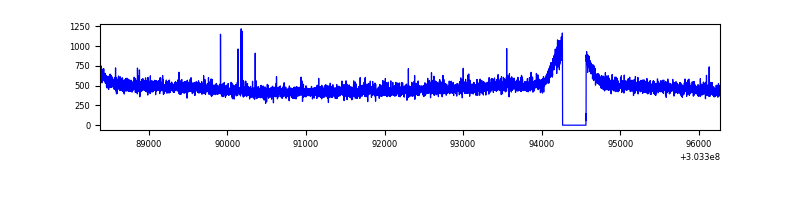 |
| B | 7893 | 7594 | 5 | 5 | 0.06% | 0.07% |  |
| C | 7893 | 7594 | 0 | 0 | 0.00% | 0.00% | 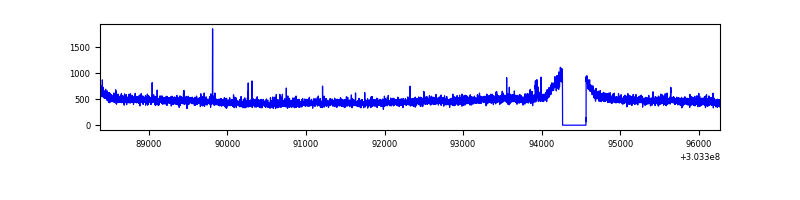 |
| D | 7893 | 7594 | 248 | 248 | 3.14% | 3.27% | 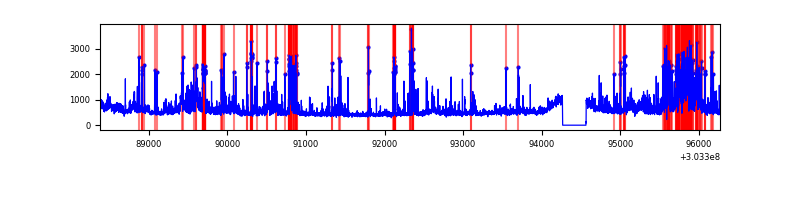 |
Top three noisy pixels from each quadrant. If the there are fewer than three noisy pixels in the level2.evt file, extra rows are filled as -1
| Pixel properties | Quadrant properties | ||||||
|---|---|---|---|---|---|---|---|
| Quadrant | DetID | PixID | Counts | Sigma | Mean | Median | Sigma |
| A | 5 | 16 | 10002 | 47.84 | 939 | 919 | 189.9 |
| A | 10 | 253 | 8699 | 40.98 | 939 | 919 | 189.9 |
| A | 0 | 226 | 8185 | 38.27 | 939 | 919 | 189.9 |
| B | 0 | 229 | 97676 | 535.08 | 929 | 908 | 180.8 |
| B | 3 | 64 | 56976 | 310.03 | 929 | 908 | 180.8 |
| B | 4 | 216 | 38108 | 205.7 | 929 | 908 | 180.8 |
| C | 14 | 238 | 137801 | 650.13 | 892 | 897 | 210.6 |
| C | 0 | 207 | 10238 | 44.36 | 892 | 897 | 210.6 |
| C | 5 | 4 | 7638 | 32.01 | 892 | 897 | 210.6 |
| D | 9 | 1 | 629033 | 2844.25 | 903 | 876 | 220.9 |
| D | 5 | 222 | 475169 | 2147.57 | 903 | 876 | 220.9 |
| D | 1 | 52 | 195236 | 880.05 | 903 | 876 | 220.9 |
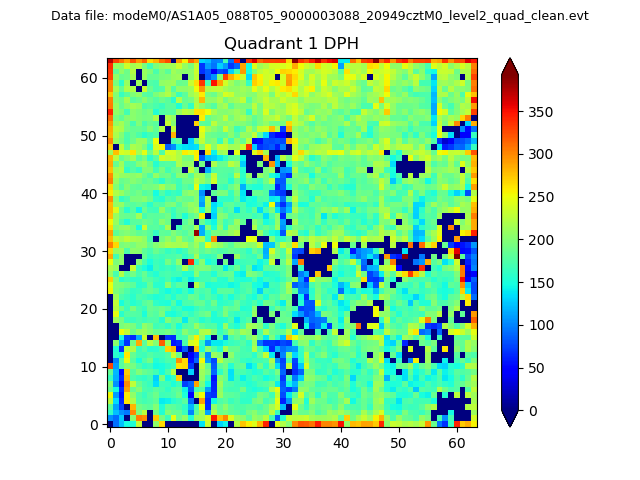
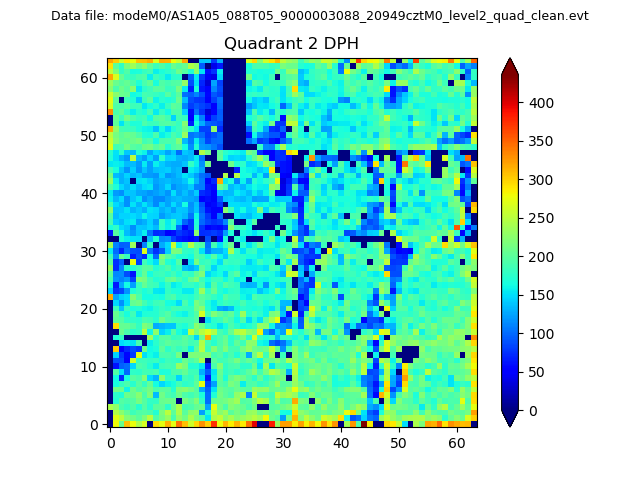
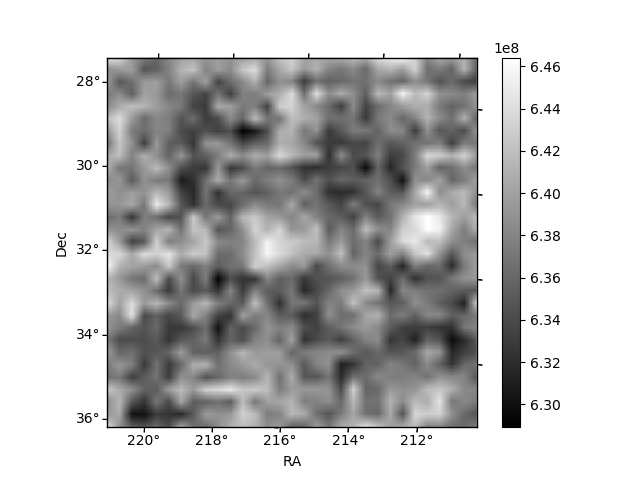
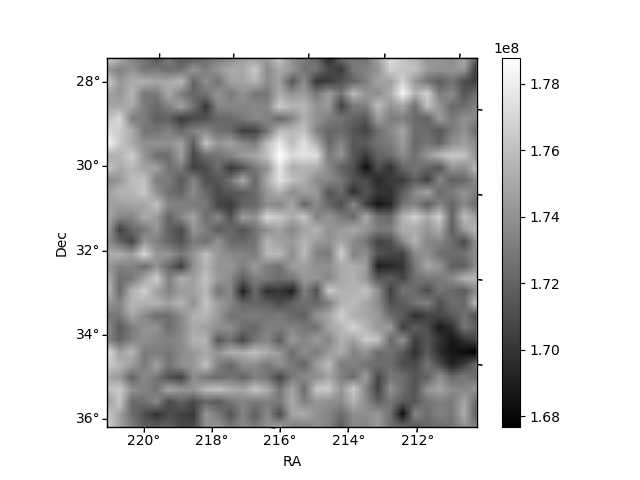
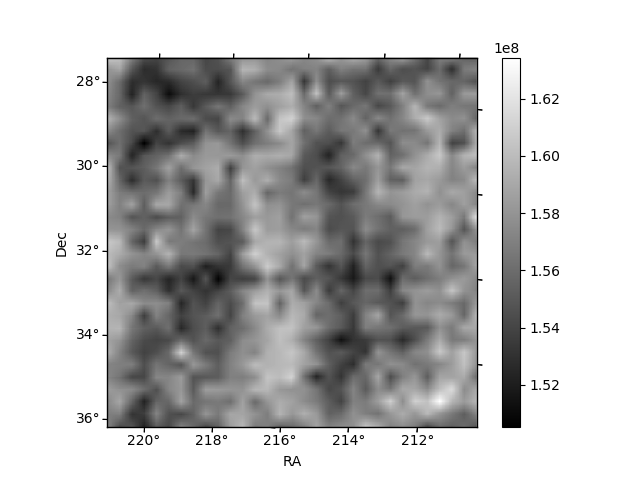
Histogram calculated using DETX and DETY for each event in the final _common_clean file
| Quadrant A | 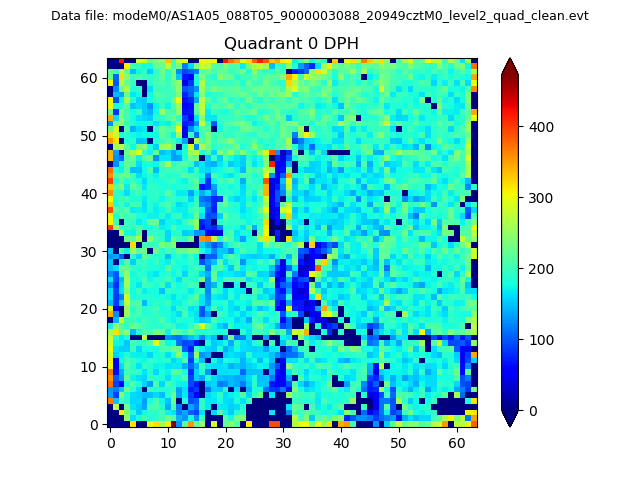 |
 |
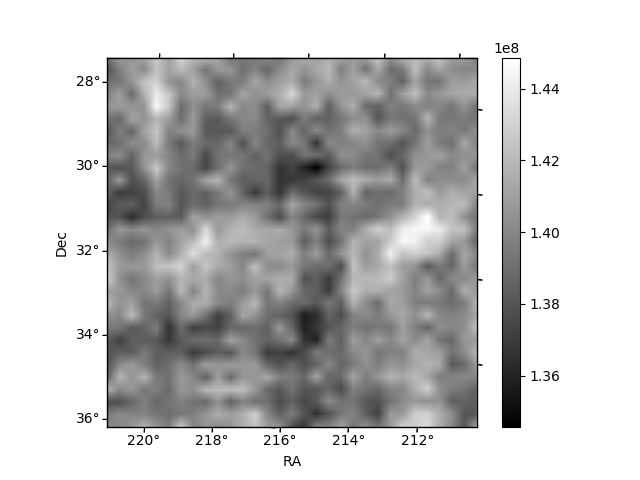
Quadrant B |
|---|---|---|---|
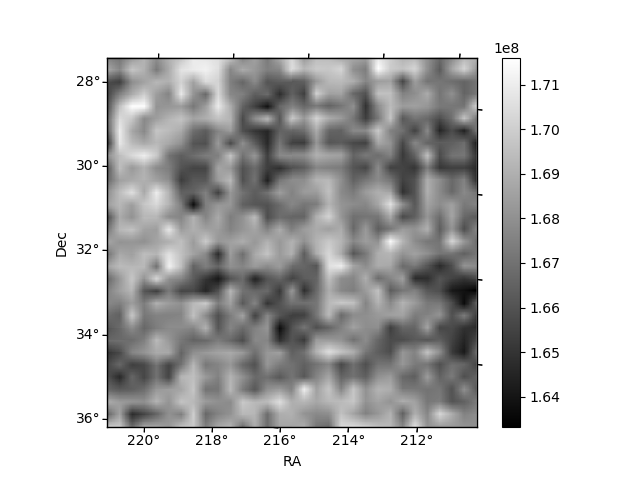
| Quadrant D | 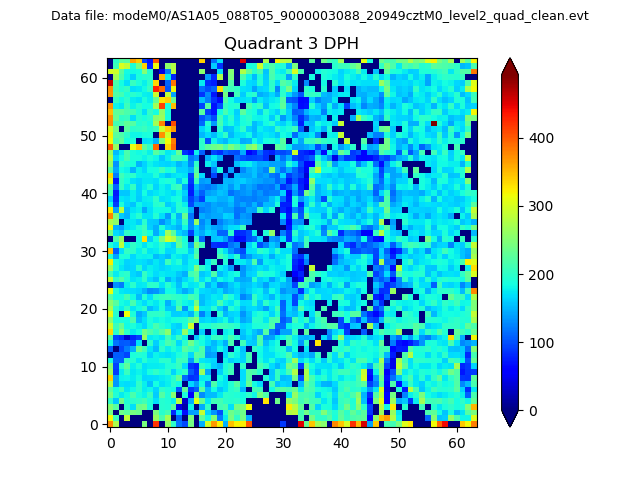 |
 |
Quadrant C |
| Plot type | Count rate plots | Images |
|---|---|---|
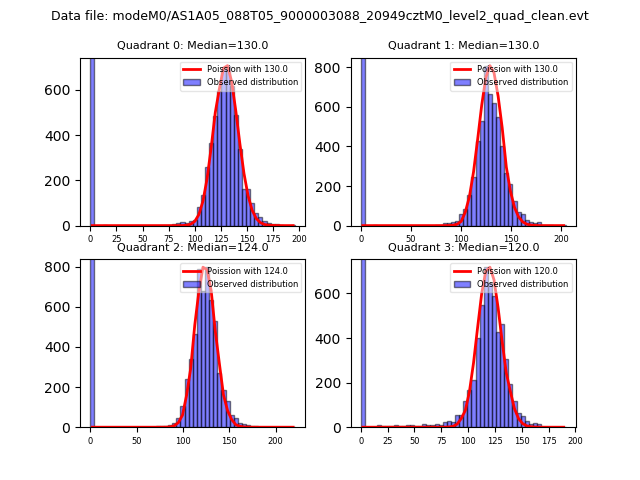
| Comparison with Poisson distribution Blue bars denote a histogram of data divided into 1 sec bins. Red curve is a Poisson curve with rate = median count rate of data. |
 |
 |
| Quadrant-wise count rates Data is divided into 100 sec bins |
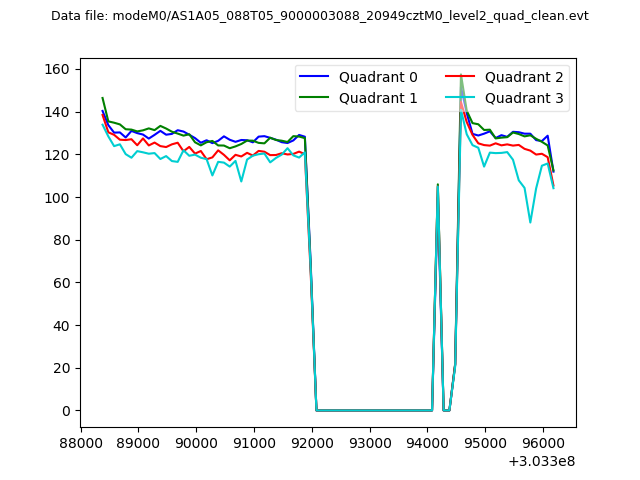 |
|
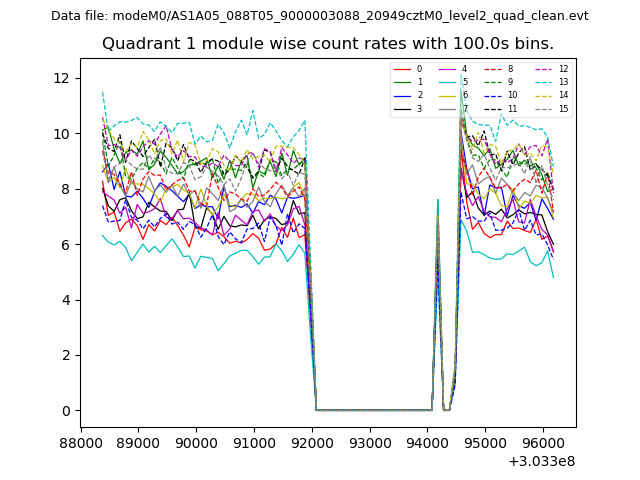
| Module-wise count rates for Quadrant A Data is divided into 100 sec bins |
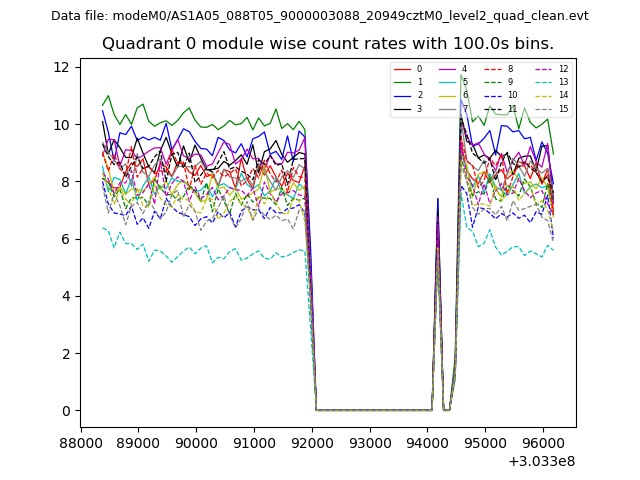 |
 |
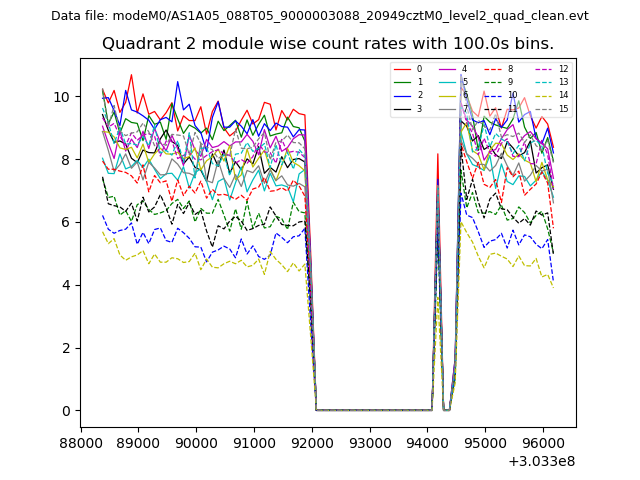
| Module-wise count rates for Quadrant B Data is divided into 100 sec bins |
 |
 |
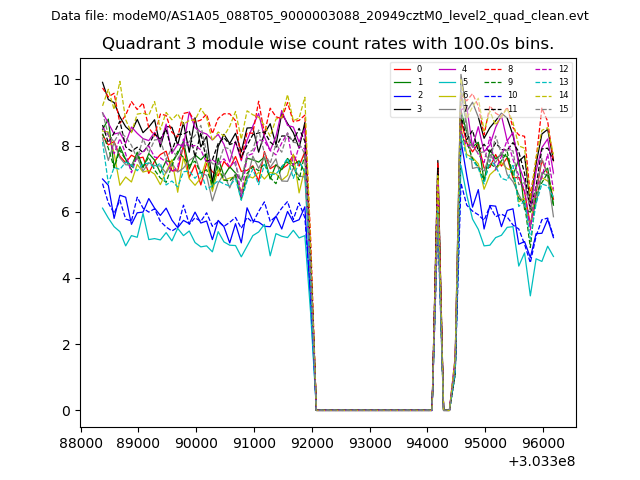
| Module-wise count rates for Quadrant C Data is divided into 100 sec bins |
 |
 |
| Module-wise count rates for Quadrant D Data is divided into 100 sec bins |
 |
 |
| Parameter | Plot |
|---|---|
| CZT HV Monitor | 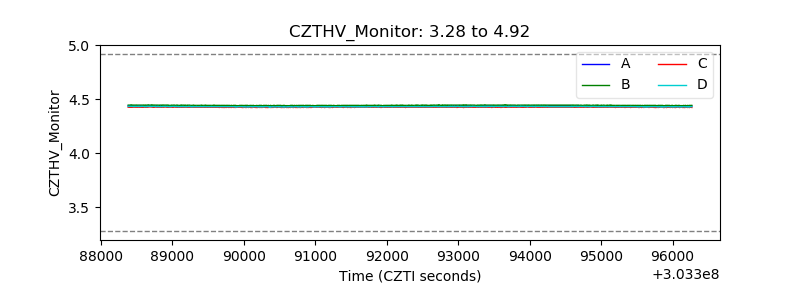 |
| D_VDD | 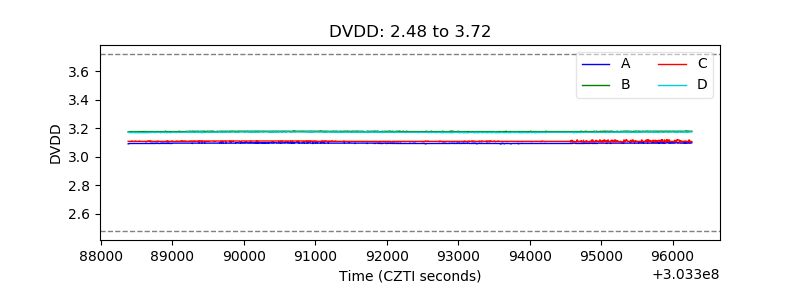 |
| Temperature 1 | 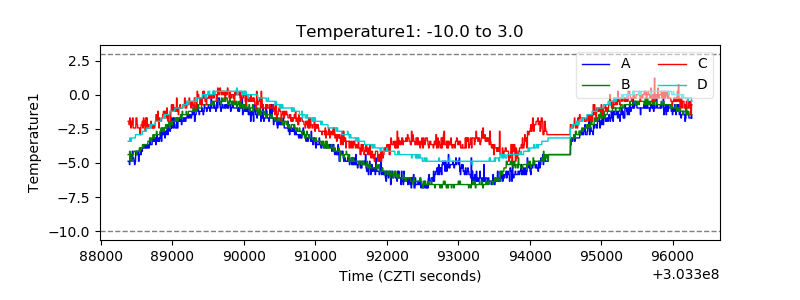 |
| Veto HV Monitor | 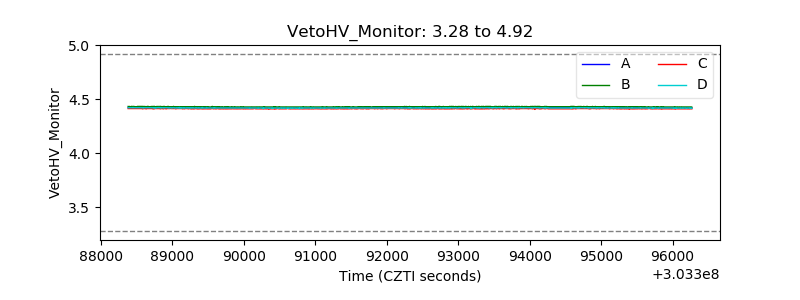 |
| Veto LLD | 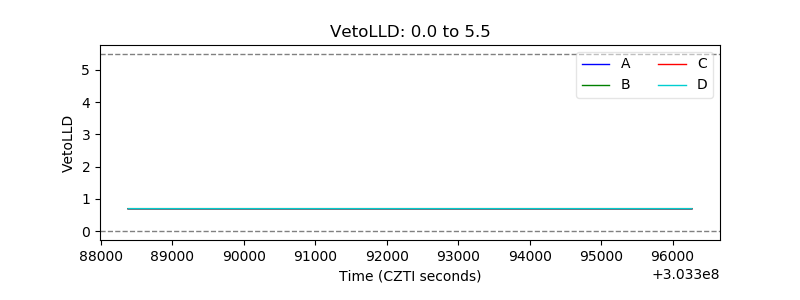 |
| Alpha Counter | 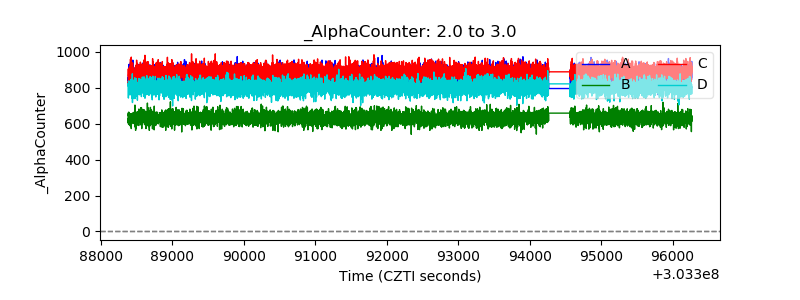 |
| _CPM_Rate | 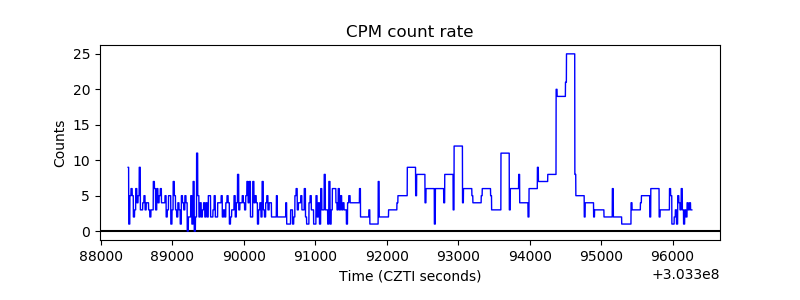 |
| CZT Counter | 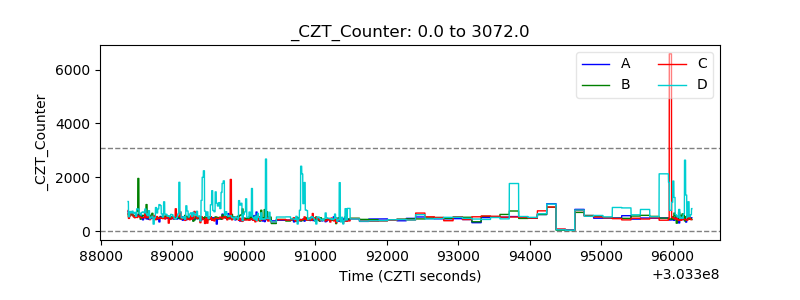 |
| +2.5 Volts monitor |  |
| +5 Volts monitor |  |
| _ROLL_ROT | 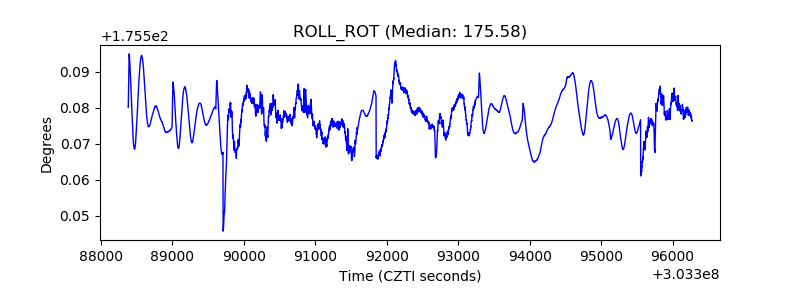 |
| _Roll_DEC | 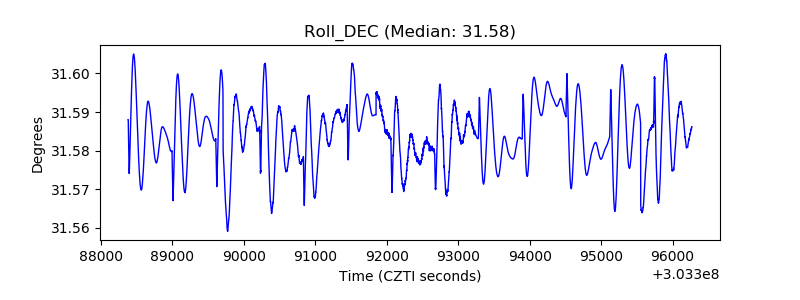 |
| _Roll_RA | 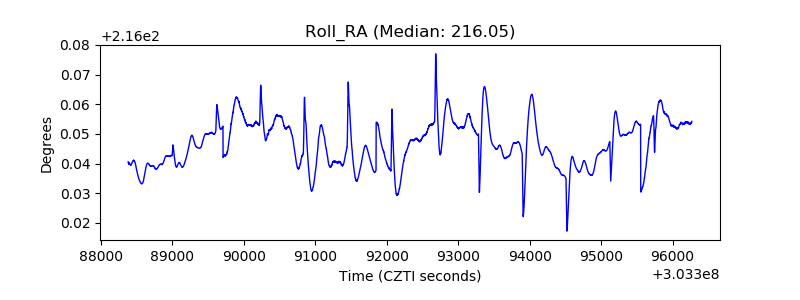 |
| Veto Counter | 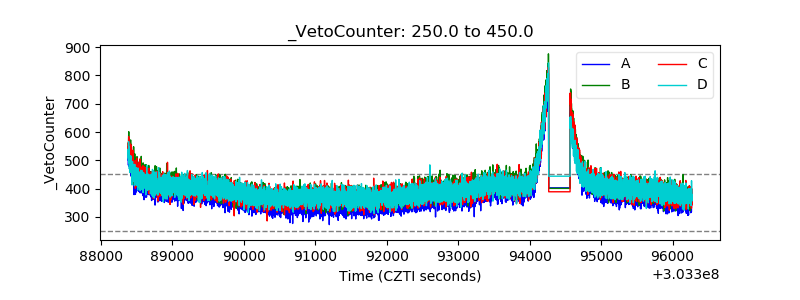 |