| Param | Original file | Final file |
|---|---|---|
| Filename | modeM0/AS1A05_088T05_9000003088_20954cztM0_level2.evt | modeM0/AS1A05_088T05_9000003088_20954cztM0_level2_quad_clean.evt |
| Size (bytes) | 509,382,720 | 87,013,440 |
| Size | 485.8 MB | 83.0 MB |
| Events in quadrant A | 3,223,414 | 559,158 |
| Events in quadrant B | 3,383,133 | 566,275 |
| Events in quadrant C | 3,173,707 | 539,459 |
| Events in quadrant D | 5,192,960 | 504,110 |
| Mode M9 | |||
|---|---|---|---|
| Quadrant | BADHDUFLAG | Total packets | Discarded packets |
| A | 0 | 13 | 0 |
| B | 0 | 14 | 0 |
| C | 0 | 14 | 0 |
| D | 0 | 14 | 0 |
| Mode M0 | |||
|---|---|---|---|
| Quadrant | BADHDUFLAG | Total packets | Discarded packets |
| A | 0 | 13918 | 2 |
| B | 0 | 14391 | 2 |
| C | 0 | 13665 | 2 |
| D | 0 | 20063 | 2 |
| Mode SS | |||
|---|---|---|---|
| Quadrant | BADHDUFLAG | Total packets | Discarded packets |
| A | 0 | 136 | 0 |
| B | 0 | 136 | 0 |
| C | 0 | -1 | -1 |
| D | 0 | -1 | -1 |
| Quadrant | Total seconds | Saturated seconds | Saturation percentage |
|---|---|---|---|
| A | 6686 | 21 | 0.314089% |
| B | 6686 | 42 | 0.628178% |
| C | 6685 | 61 | 0.912491% |
| D | 6685 | 543 | 8.122663% |
Noise dominated data is calculated using 1-second bins in cleaned event files. If a bin has >2000 counts, and if more than 50% of those come from <1% of pixels, then it is considered to be noise-dominated and hence unusable.
| Quadrant | # 1 sec bins | Bins with >0 counts | Bins with >2000 counts | High rate bins dominated by noise | Noise dominated (total time) | Noise dominated (detector-on time) | Marked lightcurve |
|---|---|---|---|---|---|---|---|
| A | 7691 | 6687 | 12 | 12 | 0.16% | 0.18% | 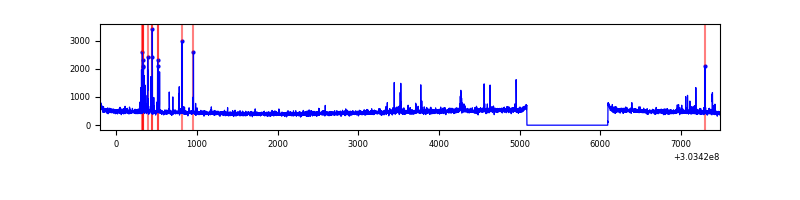 |
| B | 7691 | 6687 | 12 | 12 | 0.16% | 0.18% | 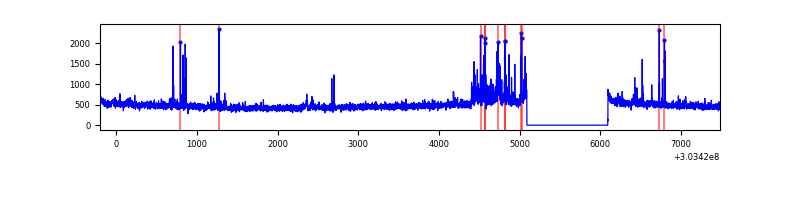 |
| C | 7690 | 6686 | 4 | 4 | 0.05% | 0.06% | 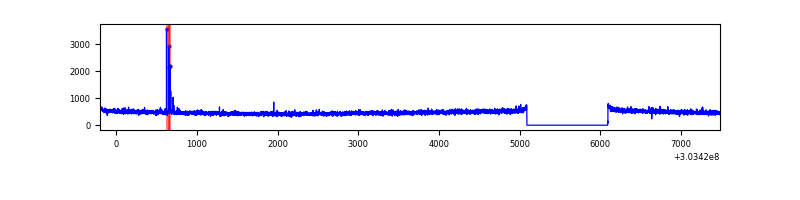 |
| D | 7690 | 6686 | 524 | 524 | 6.81% | 7.84% | 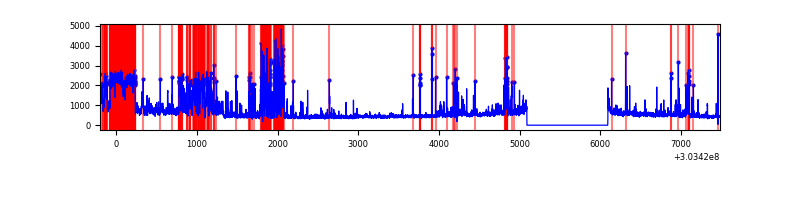 |
Top three noisy pixels from each quadrant. If the there are fewer than three noisy pixels in the level2.evt file, extra rows are filled as -1
| Pixel properties | Quadrant properties | ||||||
|---|---|---|---|---|---|---|---|
| Quadrant | DetID | PixID | Counts | Sigma | Mean | Median | Sigma |
| A | 12 | 96 | 77928 | 480.34 | 802 | 786 | 160.6 |
| A | 5 | 16 | 49433 | 302.91 | 802 | 786 | 160.6 |
| A | 15 | 174 | 12426 | 72.48 | 802 | 786 | 160.6 |
| B | 7 | 220 | 128794 | 834.37 | 804 | 787 | 153.4 |
| B | 0 | 190 | 36458 | 232.51 | 804 | 787 | 153.4 |
| B | 3 | 64 | 27200 | 172.16 | 804 | 787 | 153.4 |
| C | 14 | 238 | 121068 | 662.23 | 773 | 777 | 181.6 |
| C | 9 | 54 | 32777 | 176.17 | 773 | 777 | 181.6 |
| C | 13 | 61 | 5250 | 24.62 | 773 | 777 | 181.6 |
| D | 1 | 20 | 1104429 | 5929.23 | 762 | 741 | 186.1 |
| D | 1 | 52 | 861935 | 4626.5 | 762 | 741 | 186.1 |
| D | 1 | 239 | 191656 | 1025.63 | 762 | 741 | 186.1 |
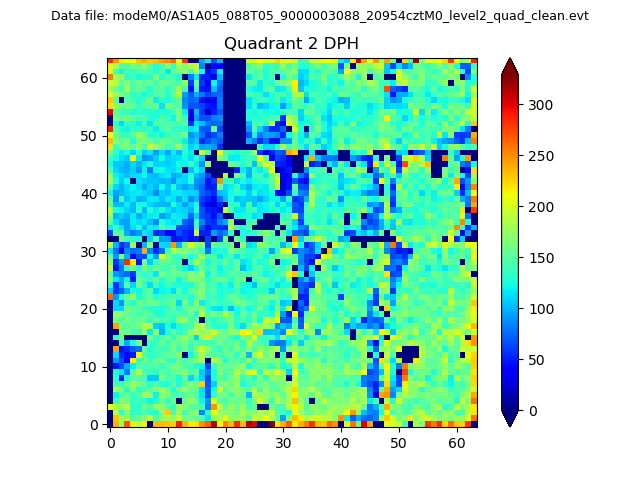
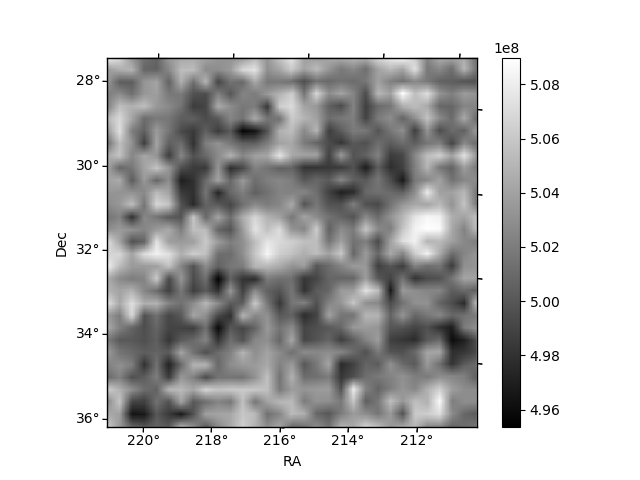
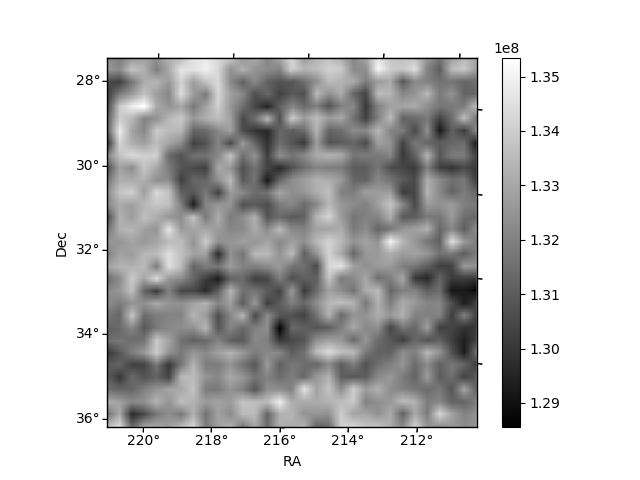
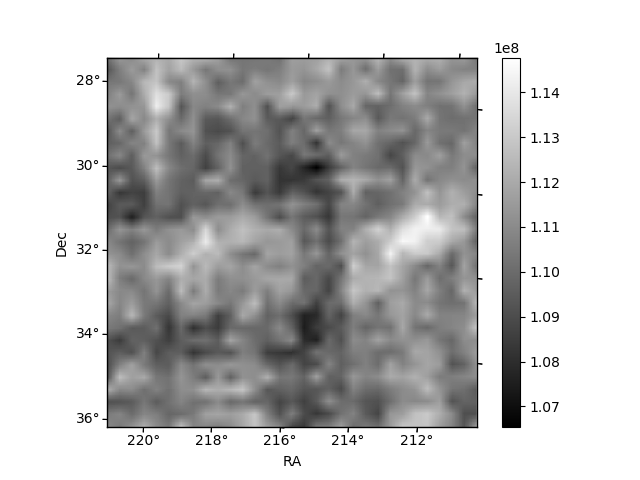
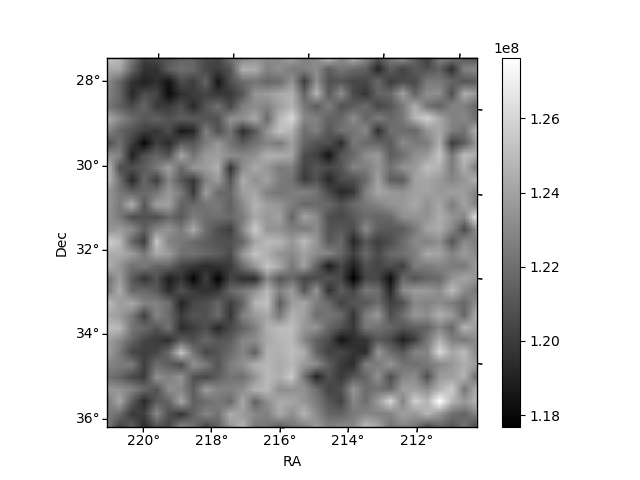
Histogram calculated using DETX and DETY for each event in the final _common_clean file
| Quadrant A | 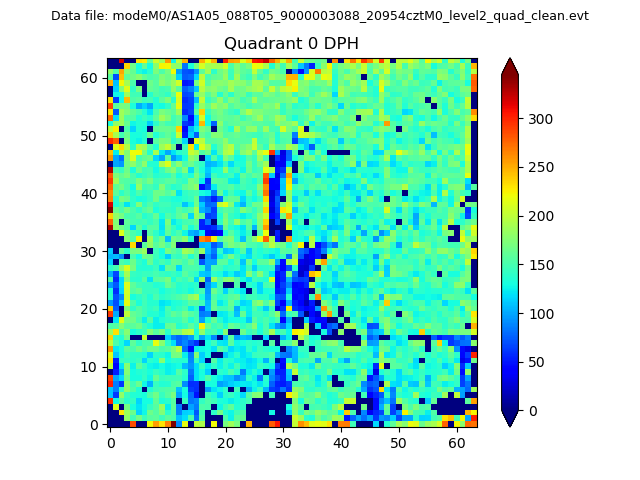 |
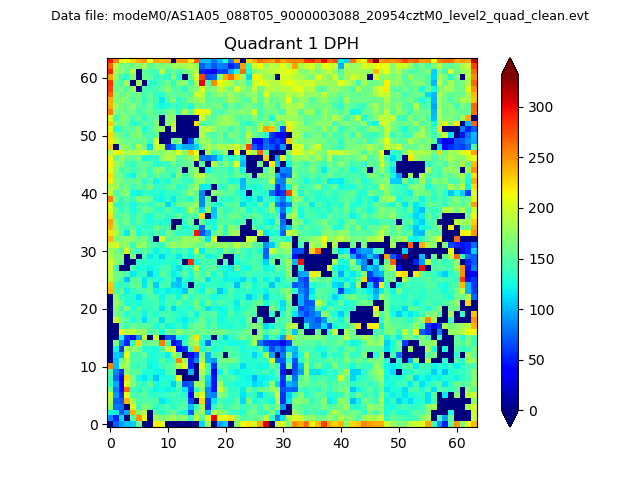 |
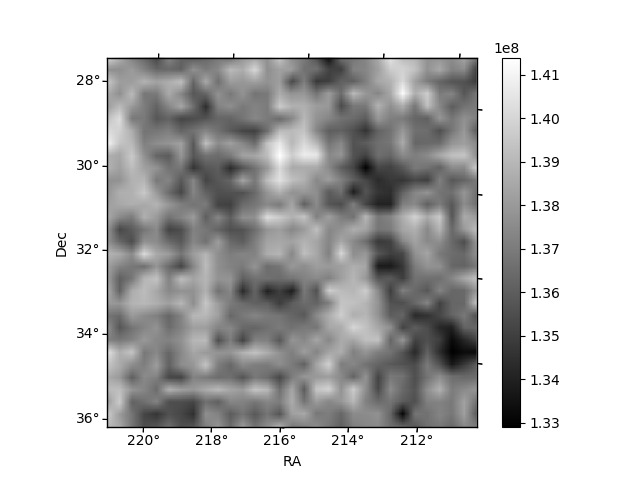
Quadrant B |
|---|---|---|---|
| Quadrant D | 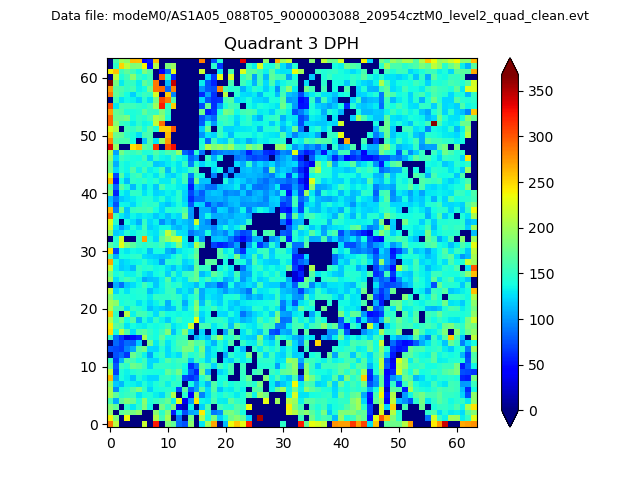 |
 |
Quadrant C |
| Plot type | Count rate plots | Images |
|---|---|---|
| Comparison with Poisson distribution Blue bars denote a histogram of data divided into 1 sec bins. Red curve is a Poisson curve with rate = median count rate of data. |
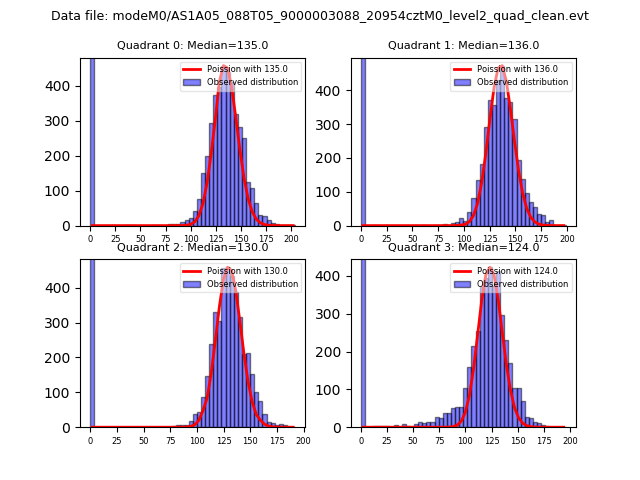 |
 |
| Quadrant-wise count rates Data is divided into 100 sec bins |
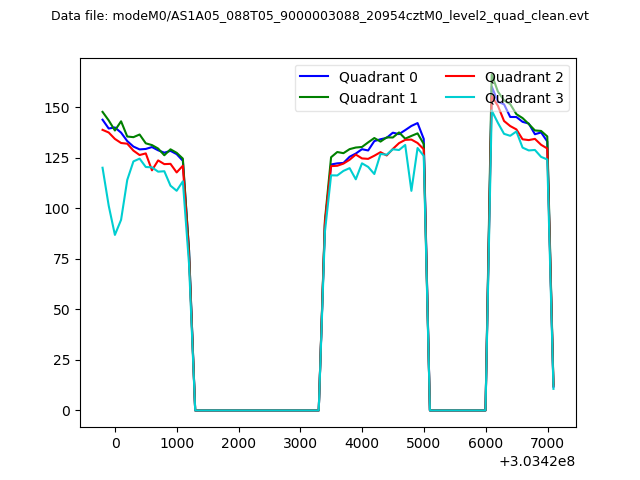 |
|
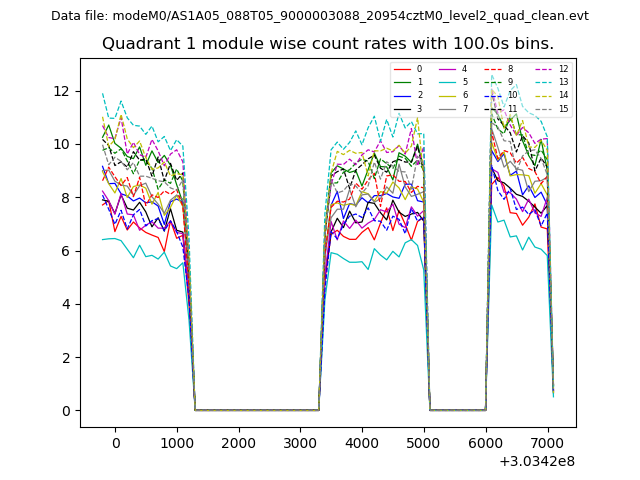
| Module-wise count rates for Quadrant A Data is divided into 100 sec bins |
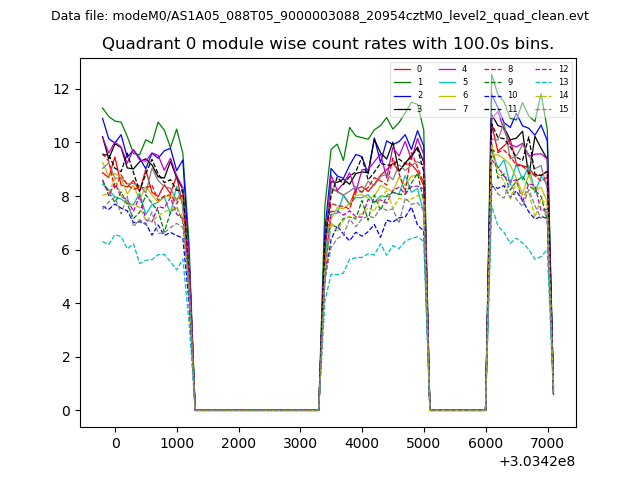 |
 |
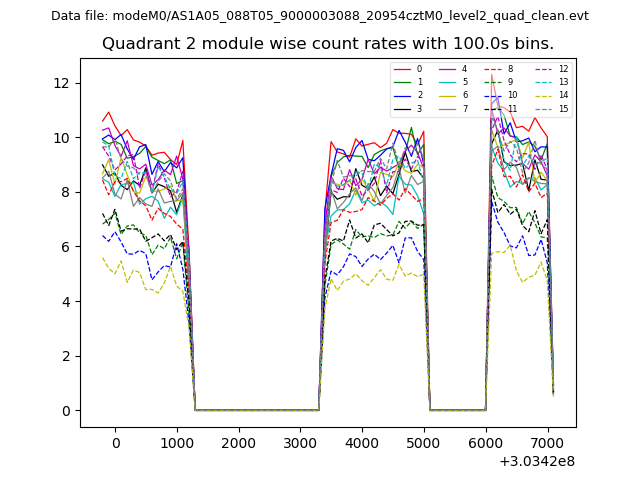
| Module-wise count rates for Quadrant B Data is divided into 100 sec bins |
 |
 |
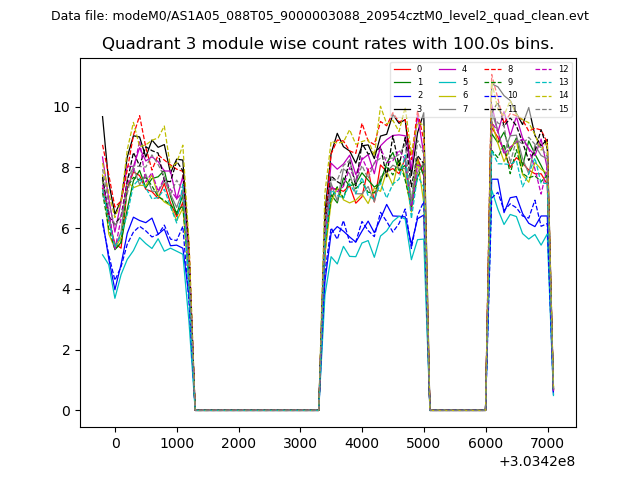
| Module-wise count rates for Quadrant C Data is divided into 100 sec bins |
 |
 |
| Module-wise count rates for Quadrant D Data is divided into 100 sec bins |
 |
 |
| Parameter | Plot |
|---|---|
| CZT HV Monitor | 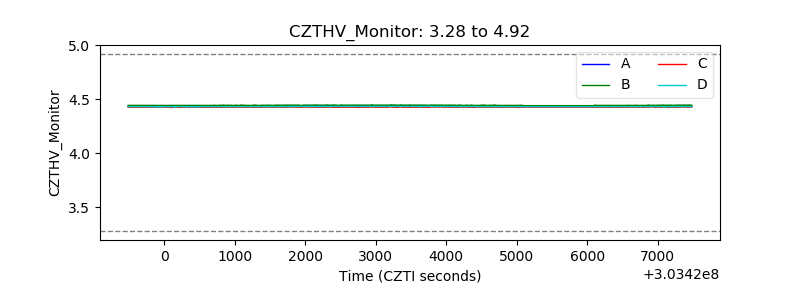 |
| D_VDD | 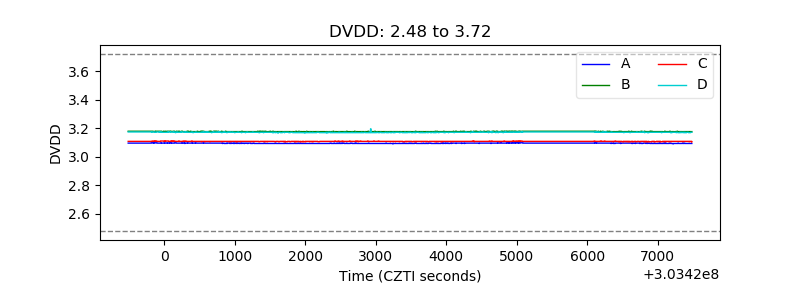 |
| Temperature 1 | 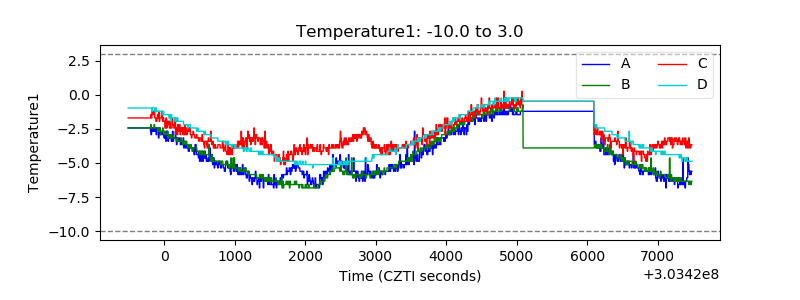 |
| Veto HV Monitor | 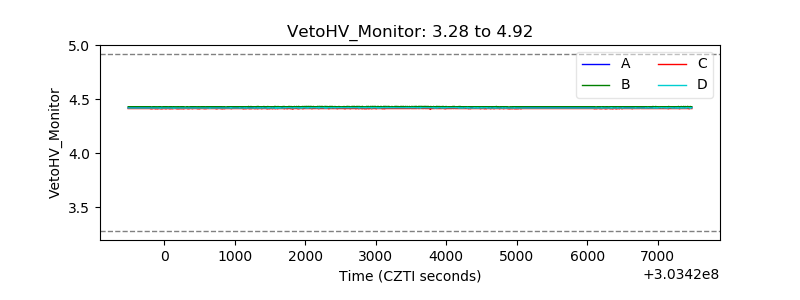 |
| Veto LLD | 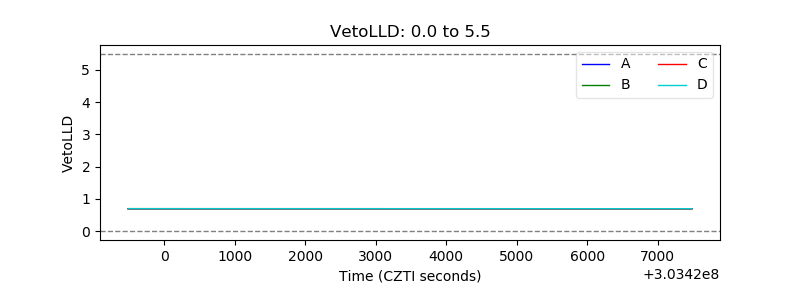 |
| Alpha Counter | 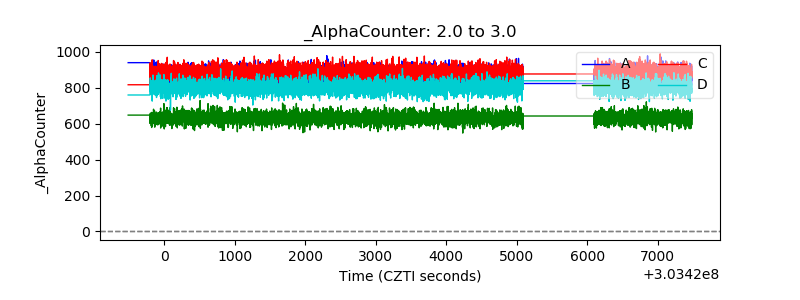 |
| _CPM_Rate | 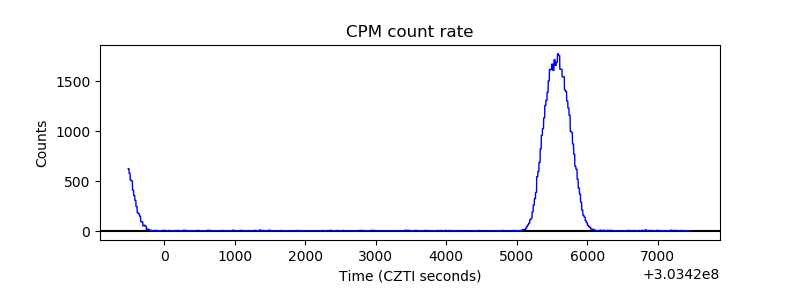 |
| CZT Counter | 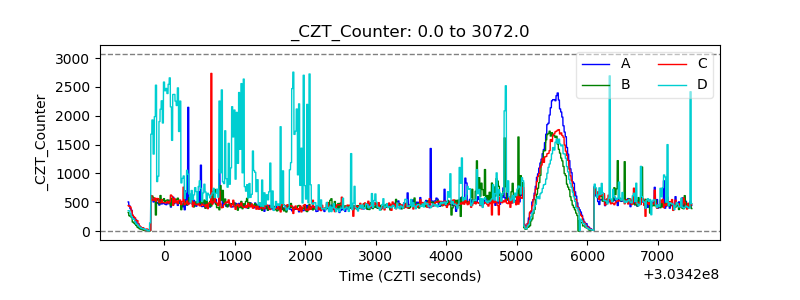 |
| +2.5 Volts monitor | 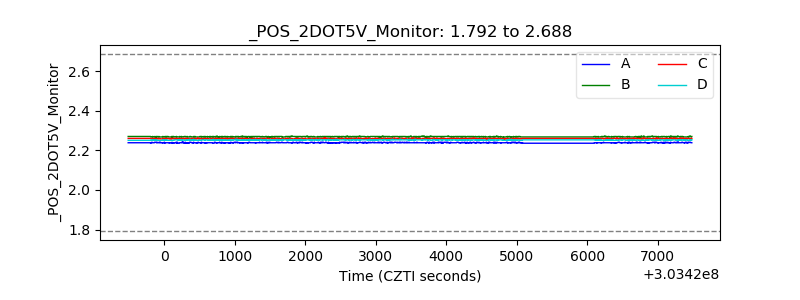 |
| +5 Volts monitor | 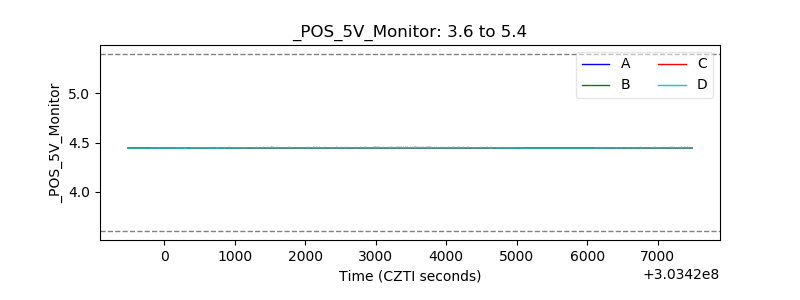 |
| _ROLL_ROT | 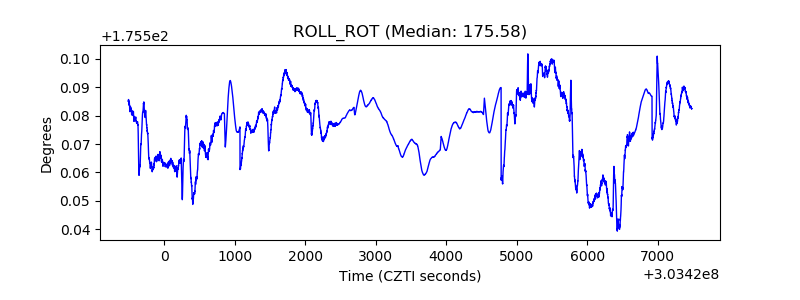 |
| _Roll_DEC | 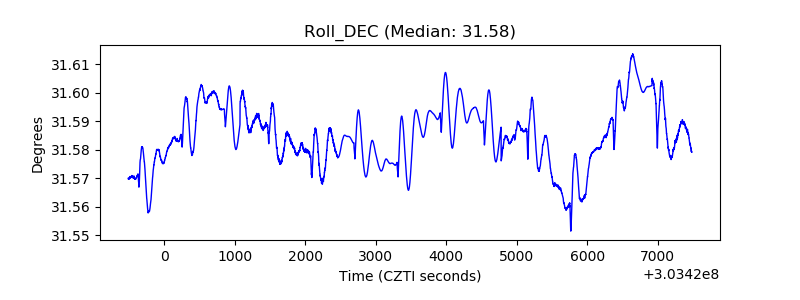 |
| _Roll_RA | 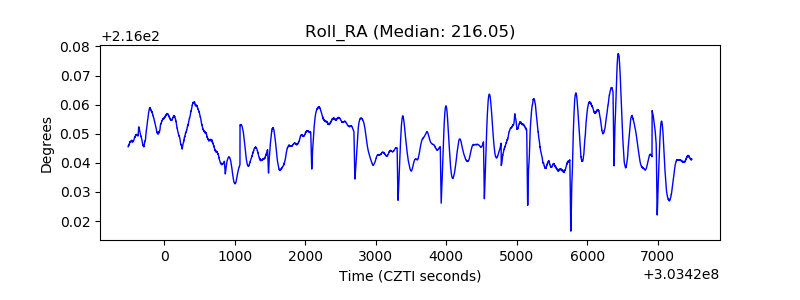 |
| Veto Counter | 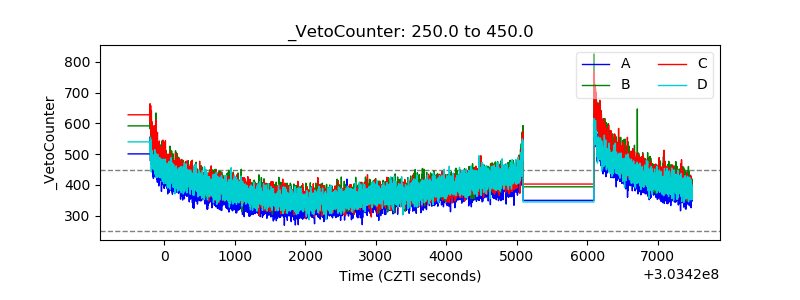 |