| Param | Original file | Final file |
|---|---|---|
| Filename | modeM0/AS1A05_088T05_9000003088_20956cztM0_level2.evt | modeM0/AS1A05_088T05_9000003088_20956cztM0_level2_quad_clean.evt |
| Size (bytes) | 461,327,040 | 79,729,920 |
| Size | 440.0 MB | 76.0 MB |
| Events in quadrant A | 3,151,317 | 504,413 |
| Events in quadrant B | 3,476,885 | 509,187 |
| Events in quadrant C | 3,242,098 | 480,353 |
| Events in quadrant D | 3,660,291 | 467,838 |
| Mode M9 | |||
|---|---|---|---|
| Quadrant | BADHDUFLAG | Total packets | Discarded packets |
| A | 0 | 19 | 0 |
| B | 0 | 19 | 0 |
| C | 0 | 20 | 0 |
| D | 0 | 20 | 0 |
| Mode M0 | |||
|---|---|---|---|
| Quadrant | BADHDUFLAG | Total packets | Discarded packets |
| A | 0 | 13442 | 4 |
| B | 0 | 14505 | 7 |
| C | 0 | 13700 | 5 |
| D | 0 | 15274 | 2 |
| Mode SS | |||
|---|---|---|---|
| Quadrant | BADHDUFLAG | Total packets | Discarded packets |
| A | 0 | 130 | 0 |
| B | 0 | 130 | 0 |
| C | 0 | 130 | 0 |
| D | 0 | 130 | 0 |
| Quadrant | Total seconds | Saturated seconds | Saturation percentage |
|---|---|---|---|
| A | 6494 | 39 | 0.600554% |
| B | 6492 | 75 | 1.155268% |
| C | 6492 | 108 | 1.663586% |
| D | 6494 | 125 | 1.924854% |
Noise dominated data is calculated using 1-second bins in cleaned event files. If a bin has >2000 counts, and if more than 50% of those come from <1% of pixels, then it is considered to be noise-dominated and hence unusable.
| Quadrant | # 1 sec bins | Bins with >0 counts | Bins with >2000 counts | High rate bins dominated by noise | Noise dominated (total time) | Noise dominated (detector-on time) | Marked lightcurve |
|---|---|---|---|---|---|---|---|
| A | 7630 | 6496 | 14 | 14 | 0.18% | 0.22% | 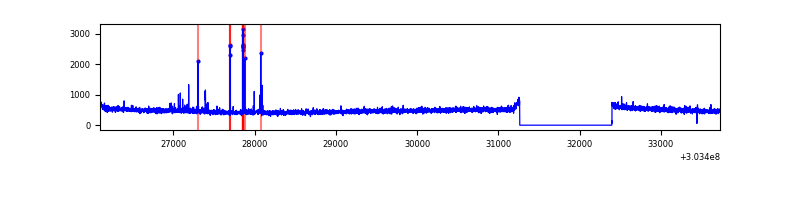 |
| B | 7630 | 6495 | 12 | 12 | 0.16% | 0.18% | 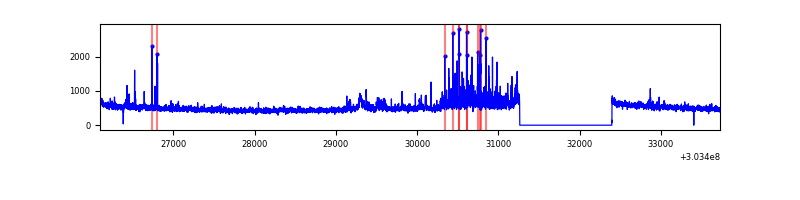 |
| C | 7629 | 6494 | 31 | 31 | 0.41% | 0.48% | 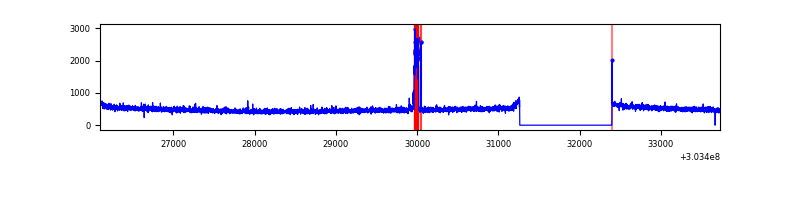 |
| D | 7629 | 6495 | 94 | 94 | 1.23% | 1.45% | 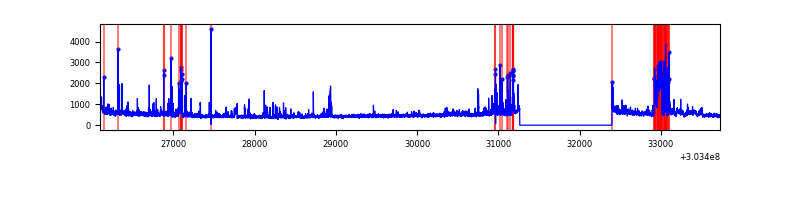 |
Top three noisy pixels from each quadrant. If the there are fewer than three noisy pixels in the level2.evt file, extra rows are filled as -1
| Pixel properties | Quadrant properties | ||||||
|---|---|---|---|---|---|---|---|
| Quadrant | DetID | PixID | Counts | Sigma | Mean | Median | Sigma |
| A | 5 | 16 | 60335 | 369.98 | 803 | 787 | 160.9 |
| A | 0 | 226 | 7145 | 39.5 | 803 | 787 | 160.9 |
| A | 3 | 137 | 6329 | 34.43 | 803 | 787 | 160.9 |
| B | 7 | 220 | 198898 | 1292.18 | 806 | 787 | 153.3 |
| B | 3 | 64 | 55322 | 355.7 | 806 | 787 | 153.3 |
| B | 0 | 190 | 27363 | 173.34 | 806 | 787 | 153.3 |
| C | 9 | 54 | 122448 | 678.18 | 769 | 774 | 179.4 |
| C | 14 | 238 | 120583 | 667.79 | 769 | 774 | 179.4 |
| C | 13 | 61 | 5337 | 25.43 | 769 | 774 | 179.4 |
| D | 7 | 238 | 272734 | 1465.07 | 773 | 751 | 185.6 |
| D | 1 | 52 | 239175 | 1284.3 | 773 | 751 | 185.6 |
| D | 1 | 239 | 103349 | 552.66 | 773 | 751 | 185.6 |
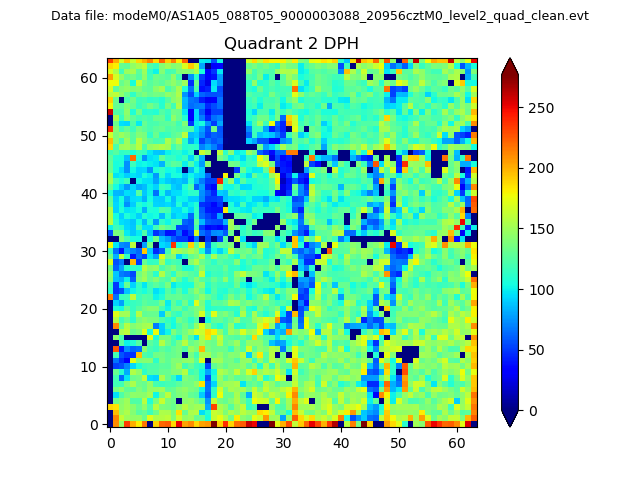
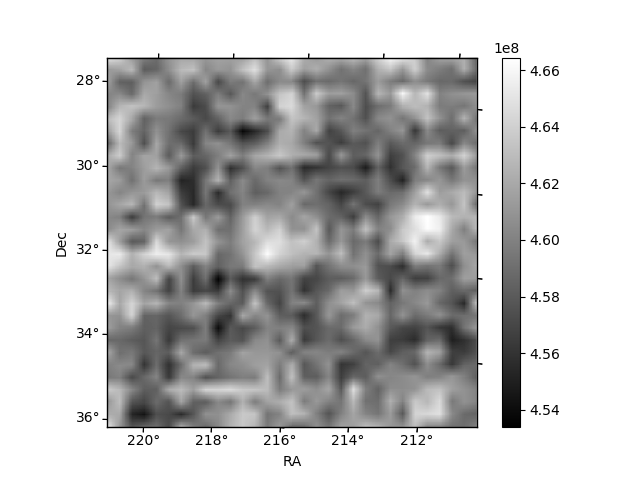
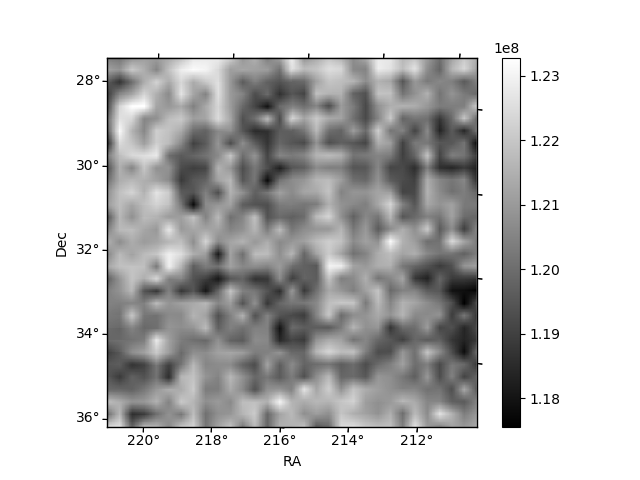
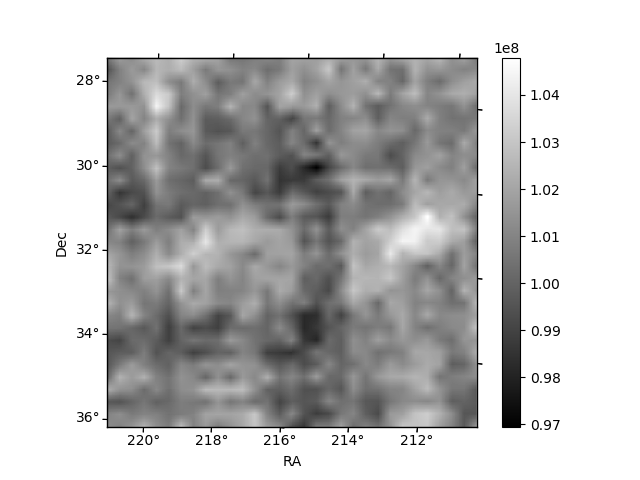
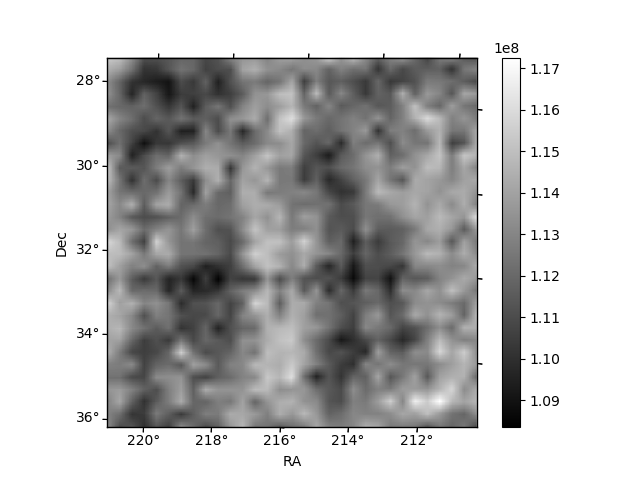
Histogram calculated using DETX and DETY for each event in the final _common_clean file
| Quadrant A | 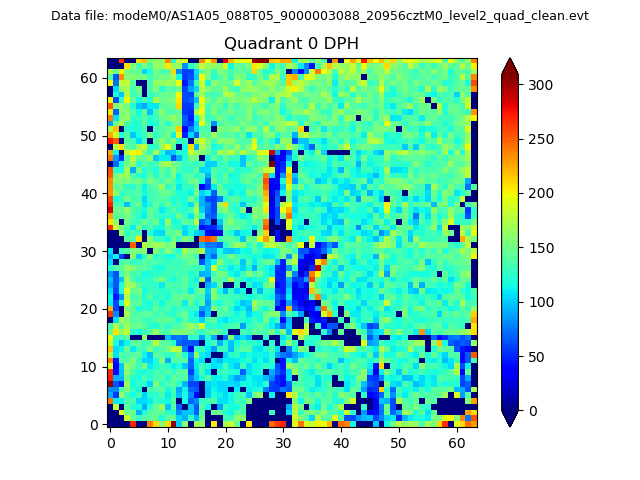 |
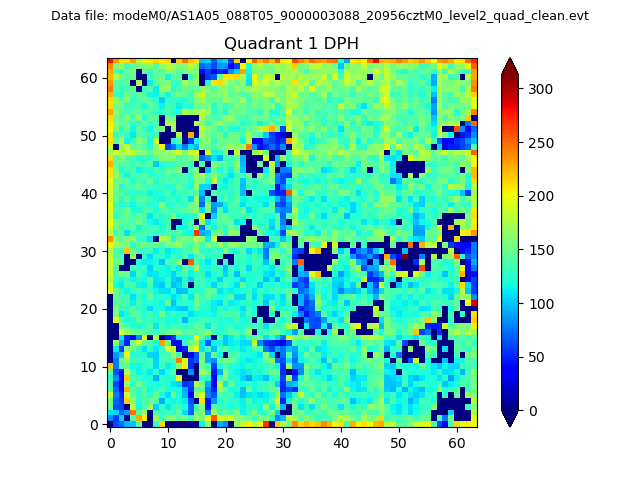 |
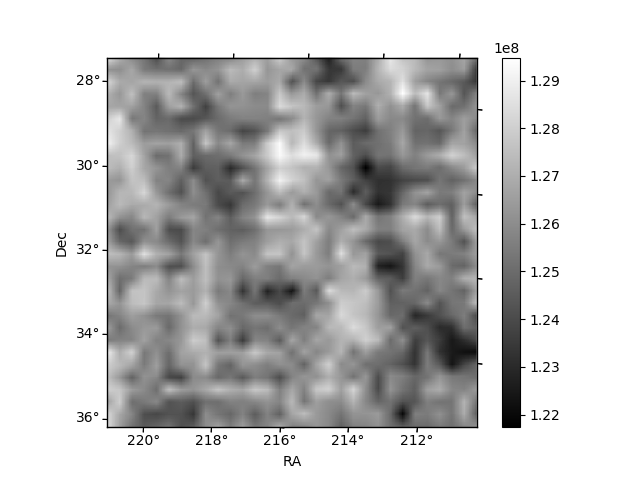
Quadrant B |
|---|---|---|---|
| Quadrant D | 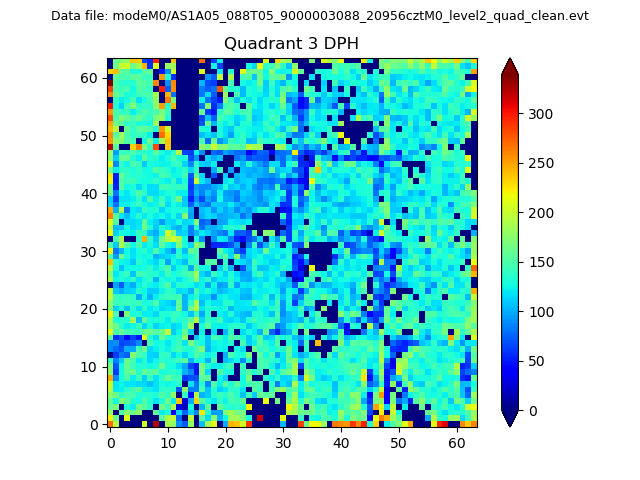 |
 |
Quadrant C |
| Plot type | Count rate plots | Images |
|---|---|---|
| Comparison with Poisson distribution Blue bars denote a histogram of data divided into 1 sec bins. Red curve is a Poisson curve with rate = median count rate of data. |
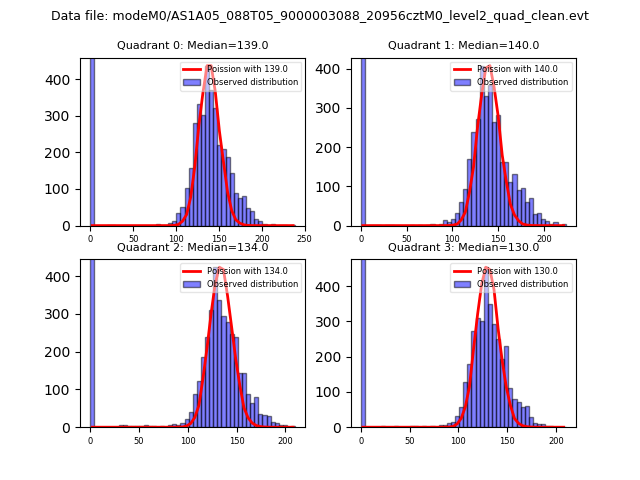 |
 |
| Quadrant-wise count rates Data is divided into 100 sec bins |
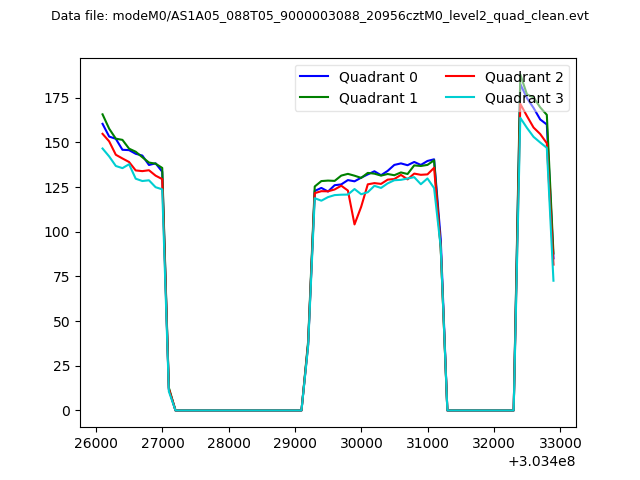 |
|
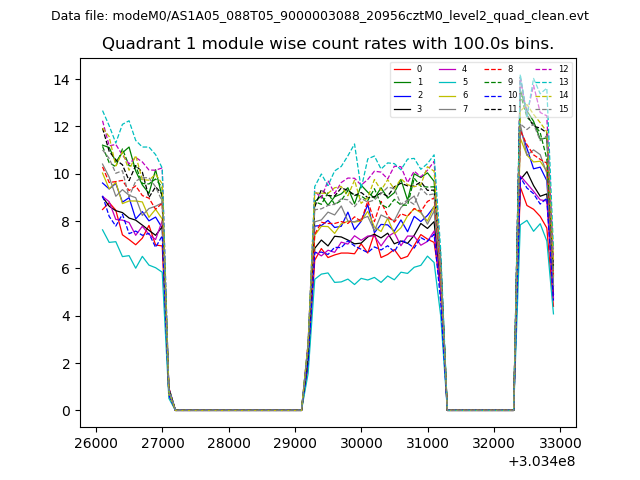
| Module-wise count rates for Quadrant A Data is divided into 100 sec bins |
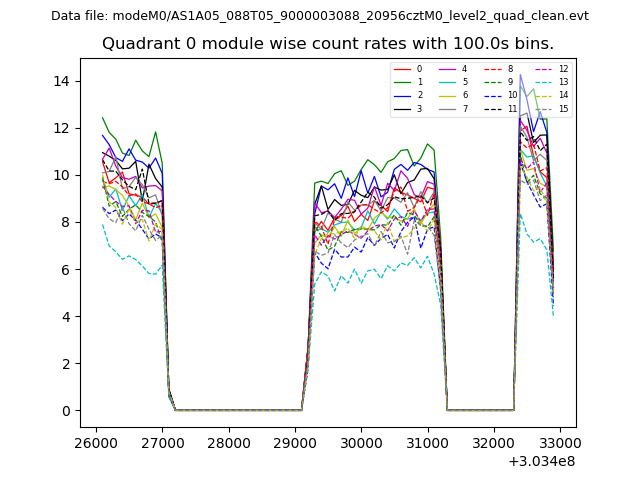 |
 |
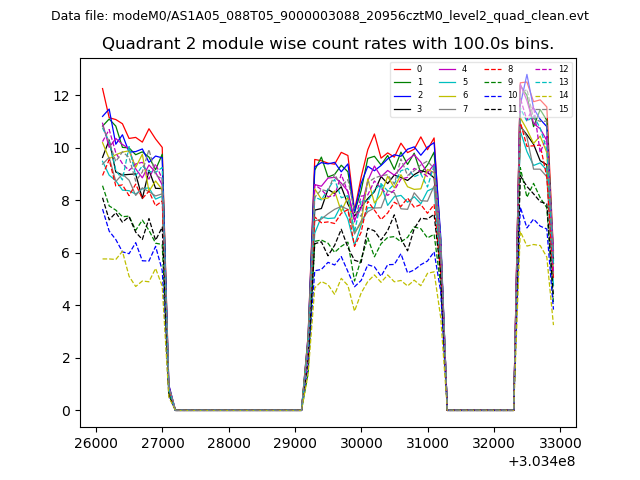
| Module-wise count rates for Quadrant B Data is divided into 100 sec bins |
 |
 |
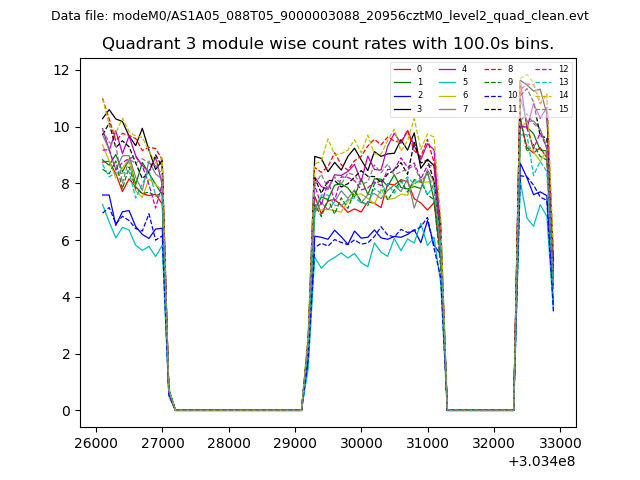
| Module-wise count rates for Quadrant C Data is divided into 100 sec bins |
 |
 |
| Module-wise count rates for Quadrant D Data is divided into 100 sec bins |
 |
 |
| Parameter | Plot |
|---|---|
| CZT HV Monitor | 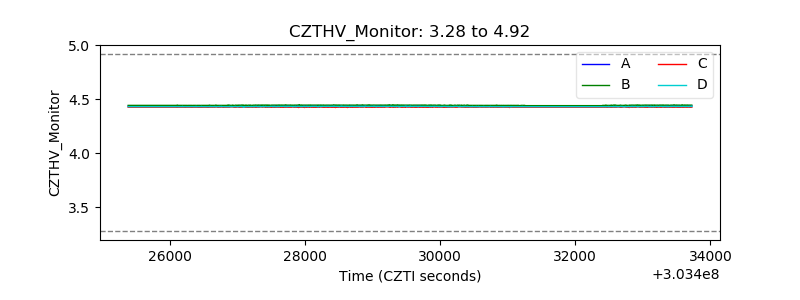 |
| D_VDD | 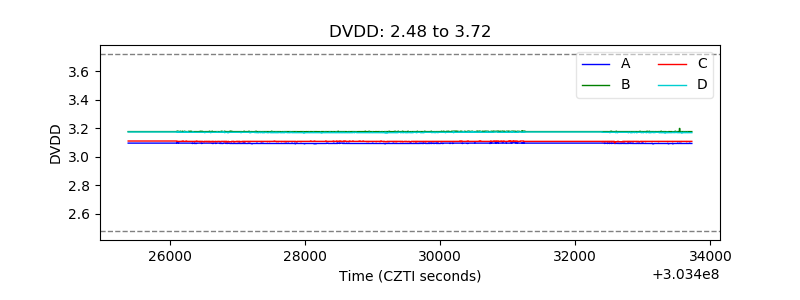 |
| Temperature 1 |  |
| Veto HV Monitor |  |
| Veto LLD | 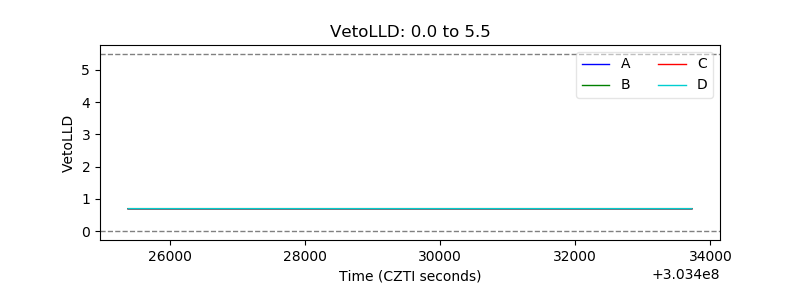 |
| Alpha Counter | 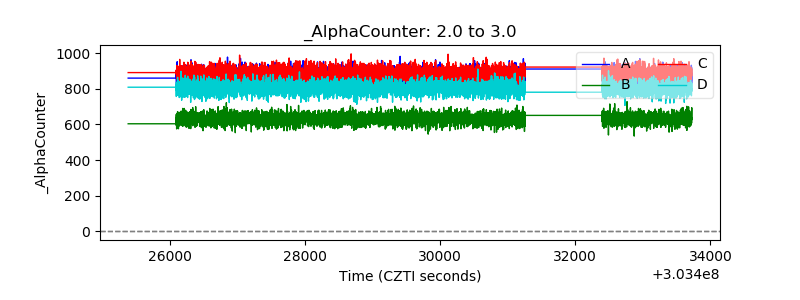 |
| _CPM_Rate | 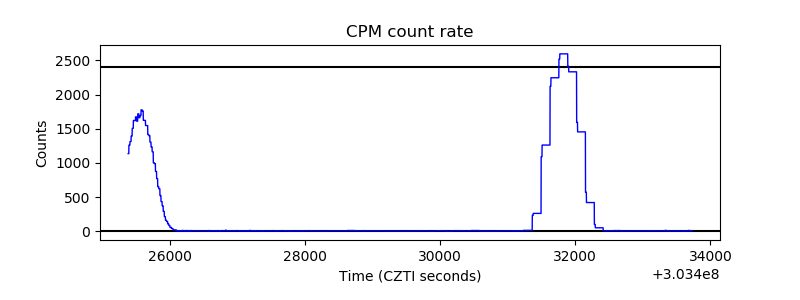 |
| CZT Counter | 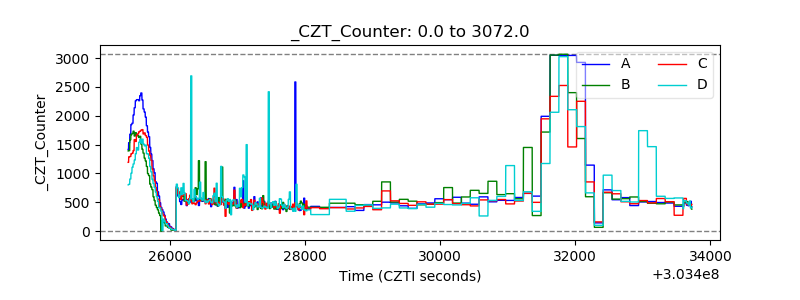 |
| +2.5 Volts monitor |  |
| +5 Volts monitor |  |
| _ROLL_ROT | 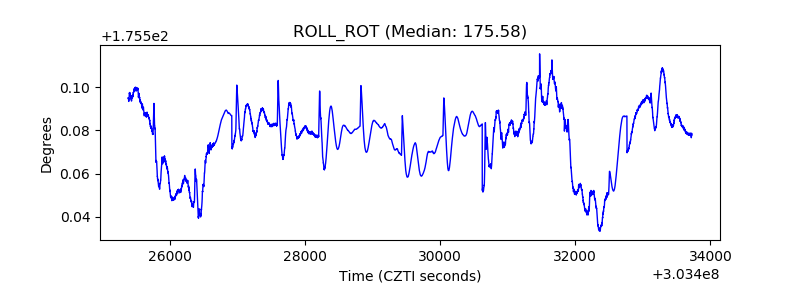 |
| _Roll_DEC | 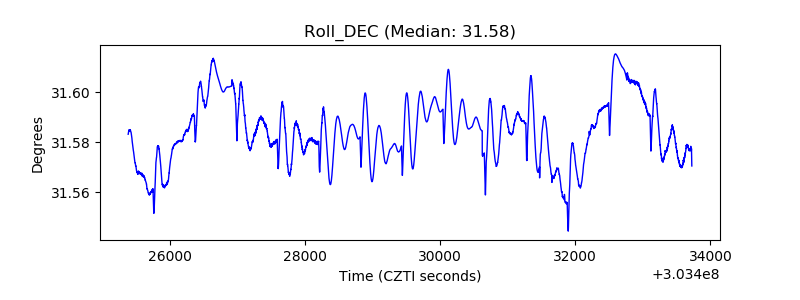 |
| _Roll_RA | 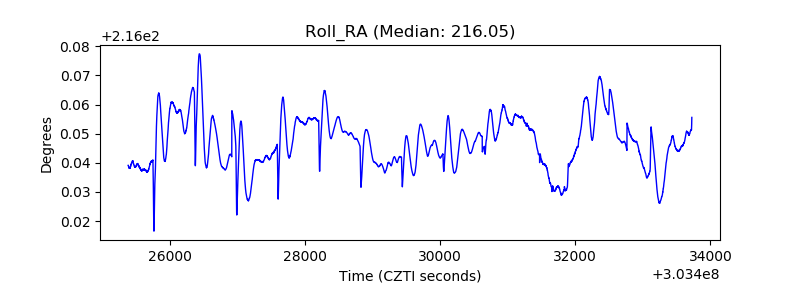 |
| Veto Counter | 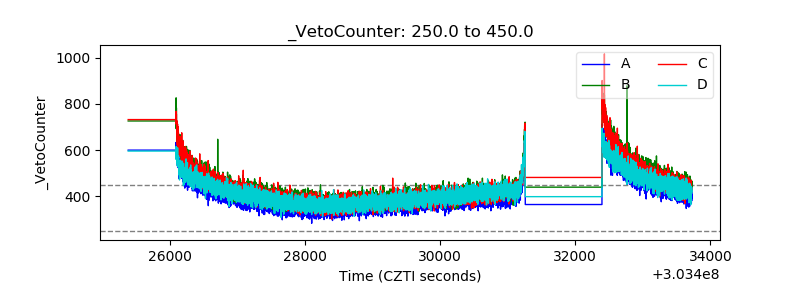 |