| Param | Original file | Final file |
|---|---|---|
| Filename | modeM0/AS1A05_088T05_9000003088_20958cztM0_level2.evt | modeM0/AS1A05_088T05_9000003088_20958cztM0_level2_quad_clean.evt |
| Size (bytes) | 799,943,040 | 125,568,000 |
| Size | 762.9 MB | 119.8 MB |
| Events in quadrant A | 5,484,778 | 778,291 |
| Events in quadrant B | 6,098,206 | 781,521 |
| Events in quadrant C | 5,542,315 | 743,860 |
| Events in quadrant D | 6,344,998 | 726,053 |
| Mode M9 | |||
|---|---|---|---|
| Quadrant | BADHDUFLAG | Total packets | Discarded packets |
| A | 0 | 24 | 0 |
| B | 0 | 24 | 0 |
| C | 0 | 24 | 0 |
| D | 0 | 24 | 0 |
| Mode M0 | |||
|---|---|---|---|
| Quadrant | BADHDUFLAG | Total packets | Discarded packets |
| A | 0 | 23279 | 2 |
| B | 0 | 25303 | 2 |
| C | 0 | 23442 | 2 |
| D | 0 | 26283 | 2 |
| Mode SS | |||
|---|---|---|---|
| Quadrant | BADHDUFLAG | Total packets | Discarded packets |
| A | 0 | 228 | 0 |
| B | 0 | 228 | 0 |
| C | 0 | 228 | 0 |
| D | 0 | 228 | 0 |
| Quadrant | Total seconds | Saturated seconds | Saturation percentage |
|---|---|---|---|
| A | 11165 | 70 | 0.626959% |
| B | 11166 | 152 | 1.361275% |
| C | 11166 | 136 | 1.217983% |
| D | 11166 | 172 | 1.540390% |
Noise dominated data is calculated using 1-second bins in cleaned event files. If a bin has >2000 counts, and if more than 50% of those come from <1% of pixels, then it is considered to be noise-dominated and hence unusable.
| Quadrant | # 1 sec bins | Bins with >0 counts | Bins with >2000 counts | High rate bins dominated by noise | Noise dominated (total time) | Noise dominated (detector-on time) | Marked lightcurve |
|---|---|---|---|---|---|---|---|
| A | 13525 | 11167 | 20 | 20 | 0.15% | 0.18% | 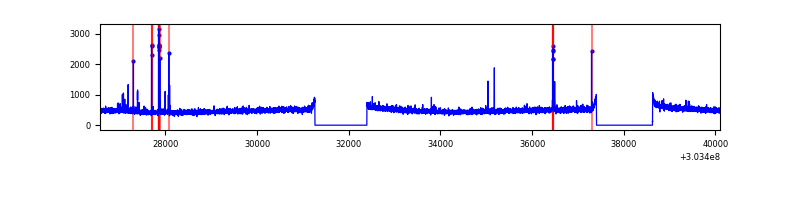 |
| B | 13526 | 11168 | 35 | 35 | 0.26% | 0.31% | 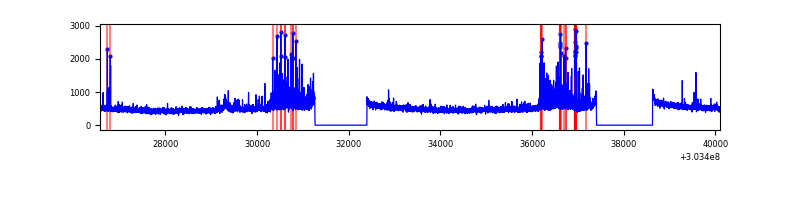 |
| C | 13526 | 11168 | 31 | 31 | 0.23% | 0.28% | 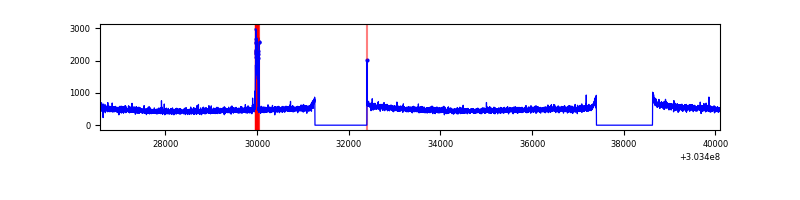 |
| D | 13526 | 11168 | 124 | 124 | 0.92% | 1.11% | 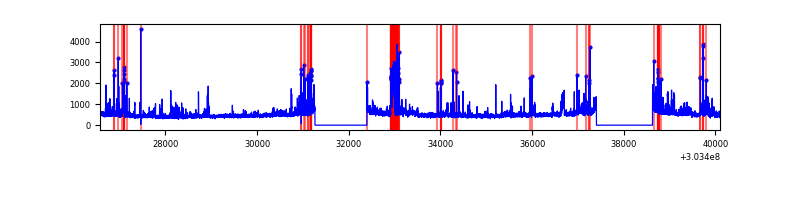 |
Top three noisy pixels from each quadrant. If the there are fewer than three noisy pixels in the level2.evt file, extra rows are filled as -1
| Pixel properties | Quadrant properties | ||||||
|---|---|---|---|---|---|---|---|
| Quadrant | DetID | PixID | Counts | Sigma | Mean | Median | Sigma |
| A | 5 | 16 | 96489 | 339.63 | 1402 | 1373 | 280.1 |
| A | 0 | 226 | 12358 | 39.22 | 1402 | 1373 | 280.1 |
| A | 3 | 137 | 10932 | 34.13 | 1402 | 1373 | 280.1 |
| B | 7 | 220 | 420979 | 1601.77 | 1402 | 1367 | 262.0 |
| B | 0 | 190 | 61043 | 227.8 | 1402 | 1367 | 262.0 |
| B | 3 | 64 | 57903 | 215.81 | 1402 | 1367 | 262.0 |
| C | 14 | 238 | 212119 | 686.18 | 1334 | 1344 | 307.2 |
| C | 9 | 54 | 123407 | 397.38 | 1334 | 1344 | 307.2 |
| C | 13 | 61 | 9415 | 26.28 | 1334 | 1344 | 307.2 |
| D | 1 | 52 | 559173 | 1723.73 | 1343 | 1309 | 323.6 |
| D | 7 | 238 | 313885 | 965.82 | 1343 | 1309 | 323.6 |
| D | 1 | 239 | 156266 | 478.8 | 1343 | 1309 | 323.6 |
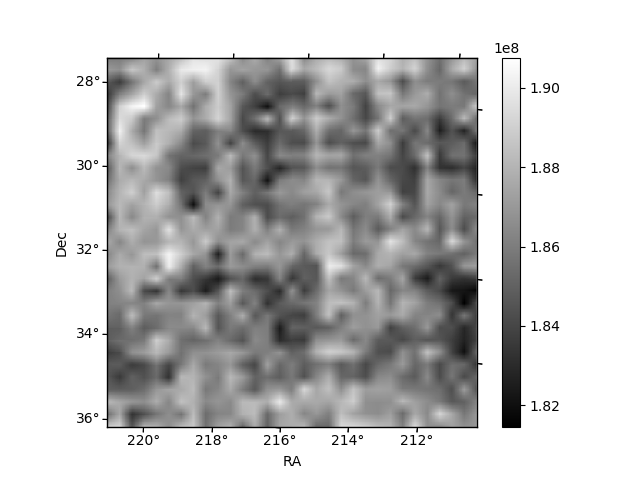
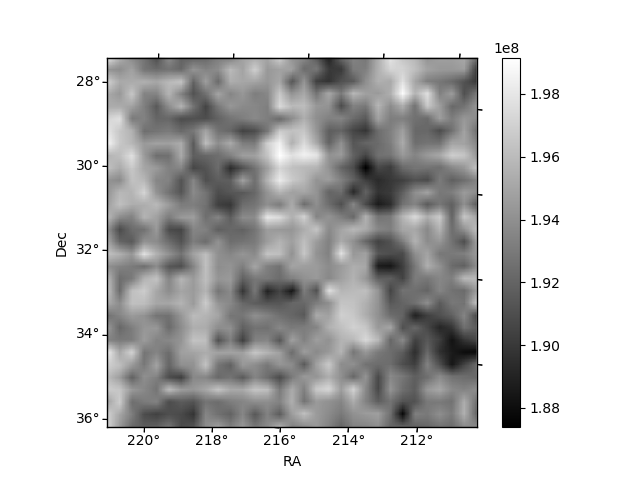
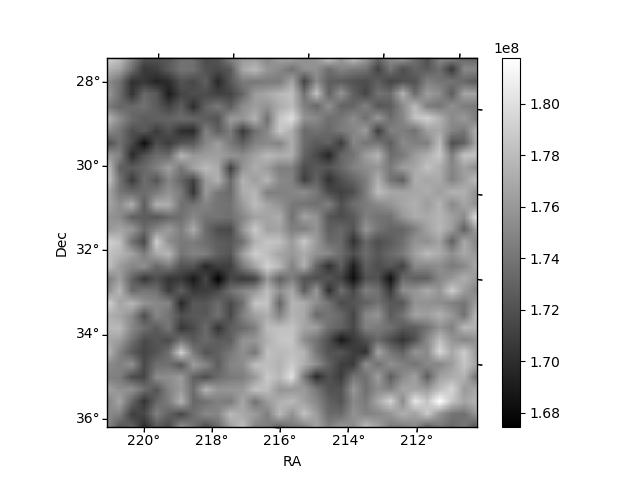
Histogram calculated using DETX and DETY for each event in the final _common_clean file
| Quadrant A | 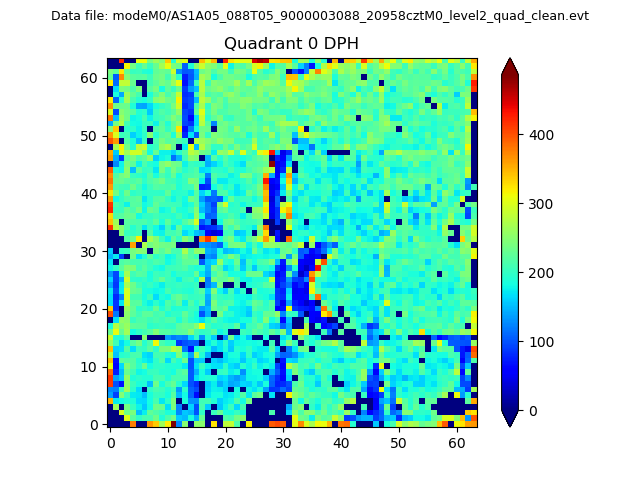 |
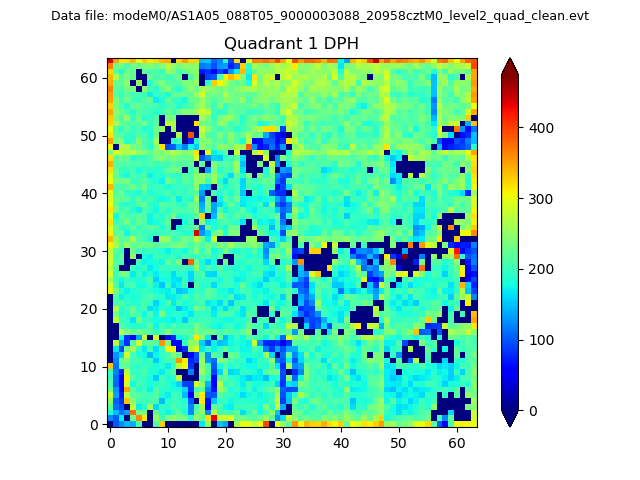 |
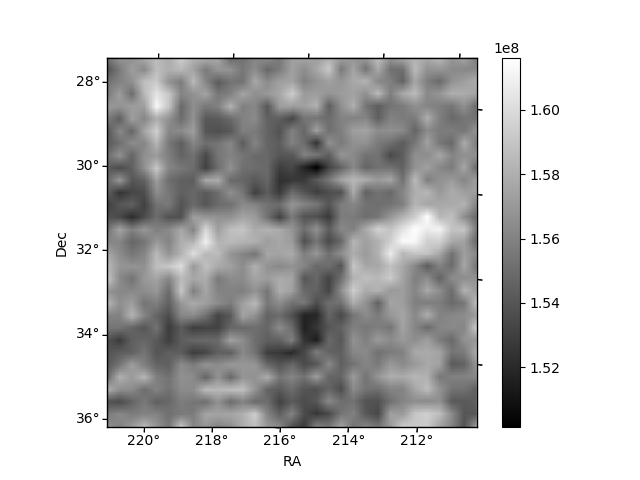
Quadrant B |
|---|---|---|---|
| Quadrant D | 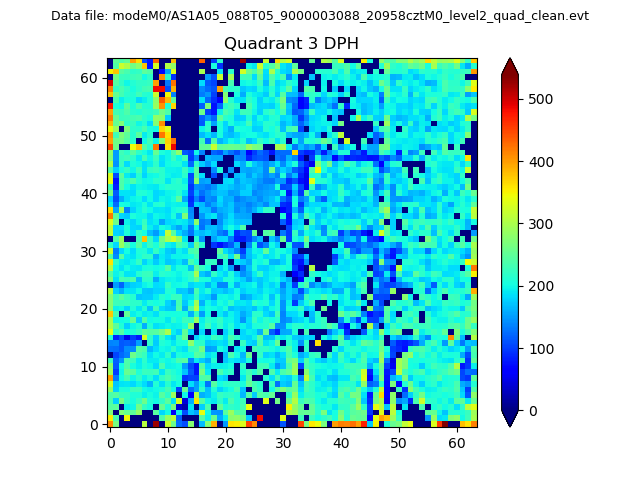 |
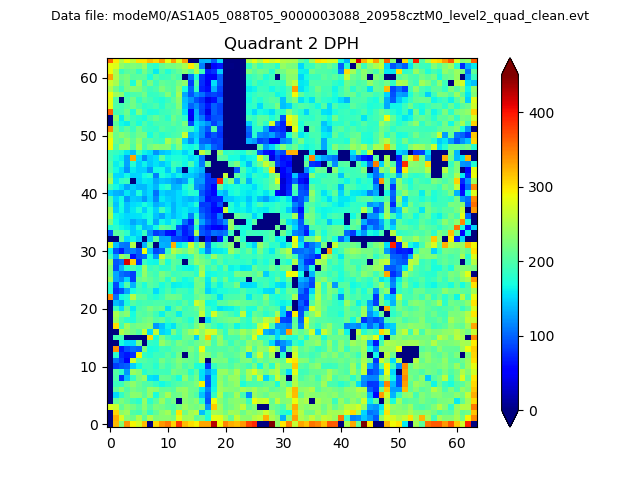 |
Quadrant C |
| Plot type | Count rate plots | Images |
|---|---|---|
| Comparison with Poisson distribution Blue bars denote a histogram of data divided into 1 sec bins. Red curve is a Poisson curve with rate = median count rate of data. |
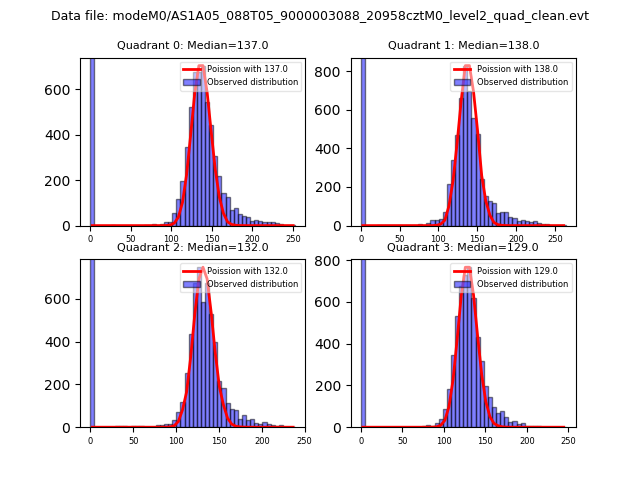 |
 |
| Quadrant-wise count rates Data is divided into 100 sec bins |
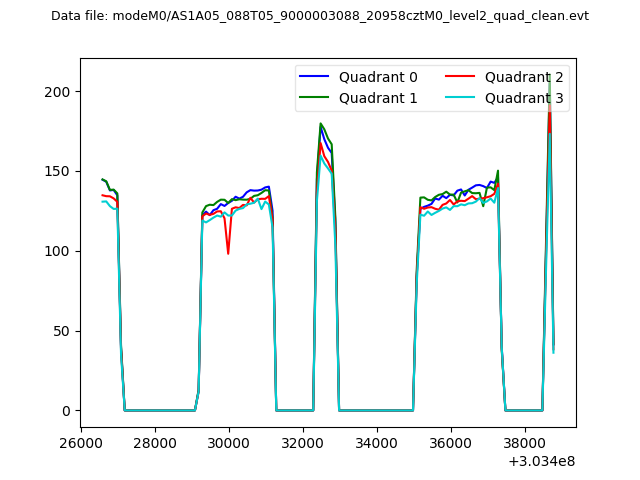 |
|
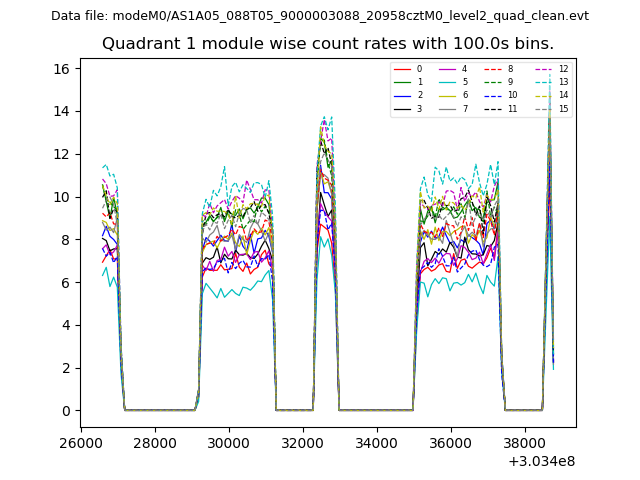
| Module-wise count rates for Quadrant A Data is divided into 100 sec bins |
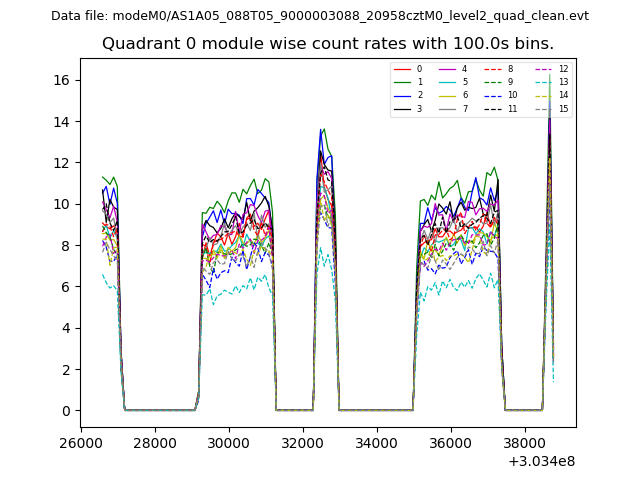 |
 |
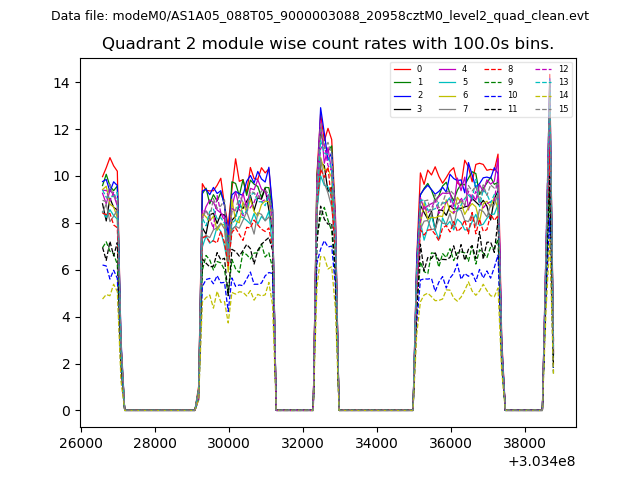
| Module-wise count rates for Quadrant B Data is divided into 100 sec bins |
 |
 |
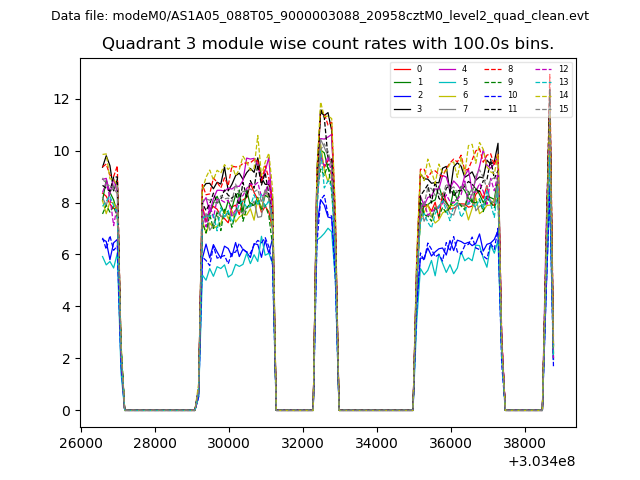
| Module-wise count rates for Quadrant C Data is divided into 100 sec bins |
 |
 |
| Module-wise count rates for Quadrant D Data is divided into 100 sec bins |
 |
 |
| Parameter | Plot |
|---|---|
| CZT HV Monitor | 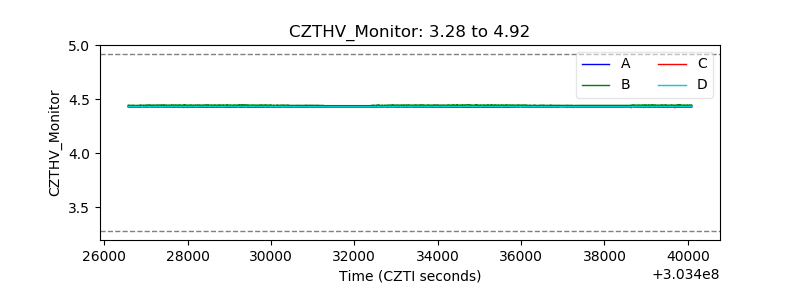 |
| D_VDD | 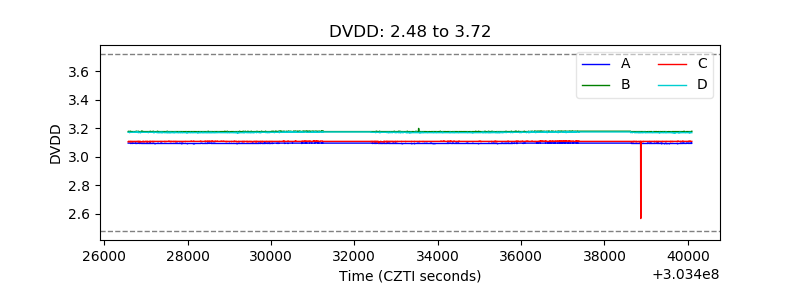 |
| Temperature 1 | 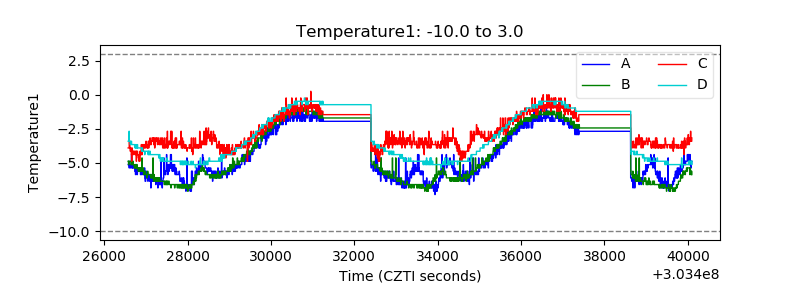 |
| Veto HV Monitor | 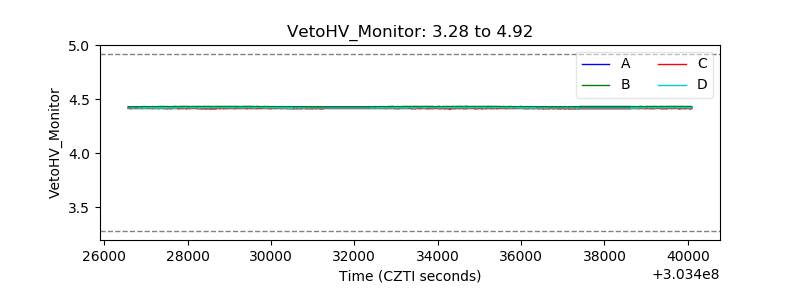 |
| Veto LLD |  |
| Alpha Counter | 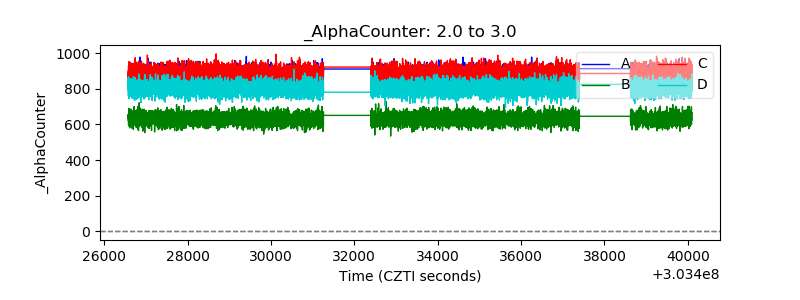 |
| _CPM_Rate | 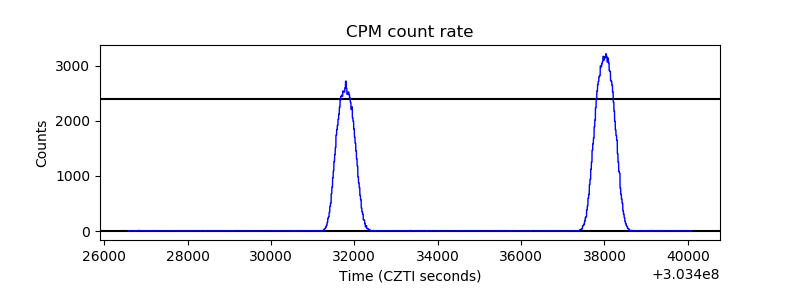 |
| CZT Counter |  |
| +2.5 Volts monitor |  |
| +5 Volts monitor | 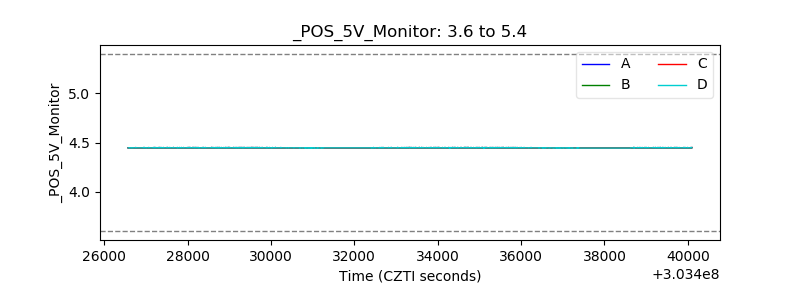 |
| _ROLL_ROT | 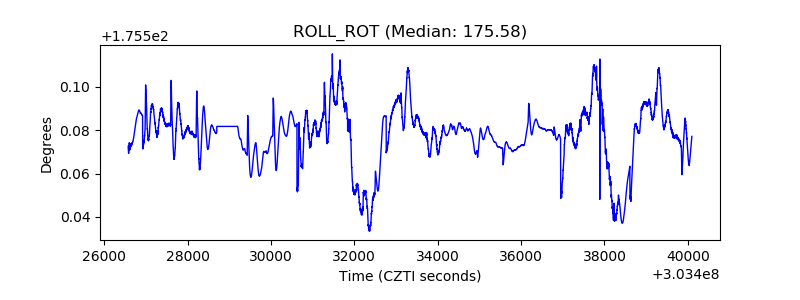 |
| _Roll_DEC | 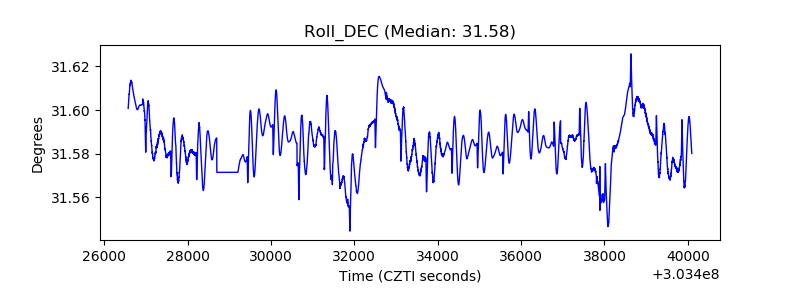 |
| _Roll_RA |  |
| Veto Counter | 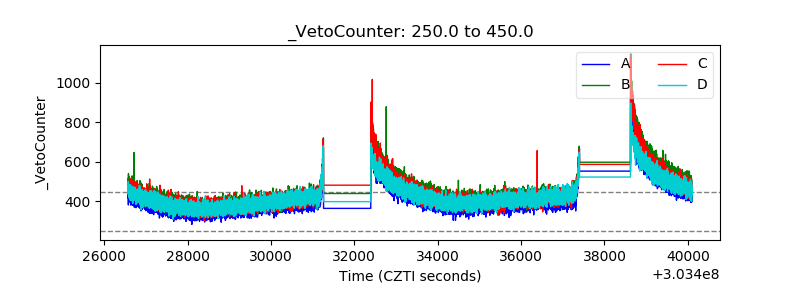 |