| Param | Original file | Final file |
|---|---|---|
| Filename | modeM0/AS1A05_088T05_9000003088_21124cztM0_level2.evt | modeM0/AS1A05_088T05_9000003088_21124cztM0_level2_quad_clean.evt |
| Size (bytes) | 31,078,080 | 4,426,560 |
| Size | 29.6 MB | 4.2 MB |
| Events in quadrant A | 171,668 | 26,879 |
| Events in quadrant B | 198,249 | 27,763 |
| Events in quadrant C | 182,440 | 27,052 |
| Events in quadrant D | 360,260 | 17,943 |
| Mode M9 | |||
|---|---|---|---|
| Quadrant | BADHDUFLAG | Total packets | Discarded packets |
| A | 0 | 3 | 3 |
| B | 0 | 3 | 3 |
| C | 0 | 4 | 3 |
| D | 0 | 4 | 4 |
| Mode M0 | |||
|---|---|---|---|
| Quadrant | BADHDUFLAG | Total packets | Discarded packets |
| A | 0 | 3515 | 2744 |
| B | 0 | 3722 | 2871 |
| C | 0 | 3466 | 2639 |
| D | 0 | 7486 | 6222 |
| Mode SS | |||
|---|---|---|---|
| Quadrant | BADHDUFLAG | Total packets | Discarded packets |
| A | 0 | 34 | 30 |
| B | 0 | 33 | 25 |
| C | 0 | 36 | 26 |
| D | 0 | 39 | 33 |
| Quadrant | Total seconds | Saturated seconds | Saturation percentage |
|---|---|---|---|
| A | 383 | 1 | 0.261097% |
| B | 387 | 5 | 1.291990% |
| C | 413 | 3 | 0.726392% |
| D | 293 | 64 | 21.843003% |
Noise dominated data is calculated using 1-second bins in cleaned event files. If a bin has >2000 counts, and if more than 50% of those come from <1% of pixels, then it is considered to be noise-dominated and hence unusable.
| Quadrant | # 1 sec bins | Bins with >0 counts | Bins with >2000 counts | High rate bins dominated by noise | Noise dominated (total time) | Noise dominated (detector-on time) | Marked lightcurve |
|---|---|---|---|---|---|---|---|
| A | 3831 | 507 | 0 | 0 | 0.00% | 0.00% | 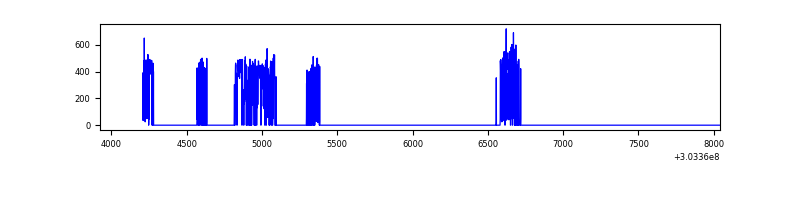 |
| B | 4118 | 519 | 3 | 3 | 0.07% | 0.58% | 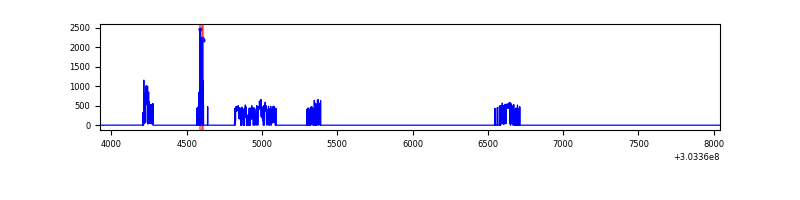 |
| C | 2787 | 524 | 0 | 0 | 0.00% | 0.00% | 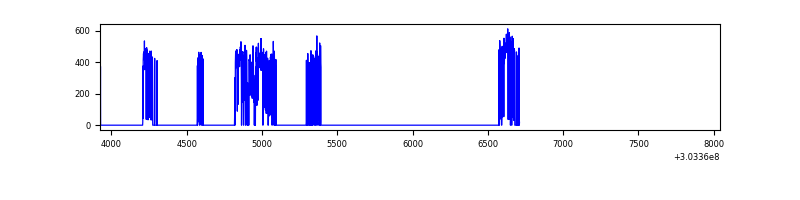 |
| D | 2501 | 402 | 40 | 40 | 1.60% | 9.95% | 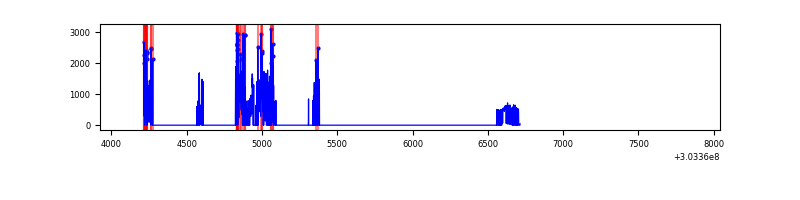 |
Top three noisy pixels from each quadrant. If the there are fewer than three noisy pixels in the level2.evt file, extra rows are filled as -1
| Pixel properties | Quadrant properties | ||||||
|---|---|---|---|---|---|---|---|
| Quadrant | DetID | PixID | Counts | Sigma | Mean | Median | Sigma |
| A | 15 | 192 | 2683 | 239.88 | 43 | 42 | 11.0 |
| A | 14 | 238 | 589 | 49.68 | 43 | 42 | 11.0 |
| A | 13 | 254 | 473 | 39.15 | 43 | 42 | 11.0 |
| B | 3 | 64 | 12847 | 1222.46 | 43 | 42 | 10.5 |
| B | 7 | 220 | 6733 | 638.77 | 43 | 42 | 10.5 |
| B | 0 | 228 | 4729 | 447.46 | 43 | 42 | 10.5 |
| C | 14 | 238 | 6799 | 534.43 | 44 | 44 | 12.6 |
| C | 13 | 61 | 322 | 21.99 | 44 | 44 | 12.6 |
| C | 3 | 233 | 319 | 21.76 | 44 | 44 | 12.6 |
| D | 1 | 239 | 113909 | 12402.01 | 30 | 28 | 9.2 |
| D | 5 | 222 | 71167 | 7747.27 | 30 | 28 | 9.2 |
| D | 1 | 20 | 41201 | 4483.87 | 30 | 28 | 9.2 |
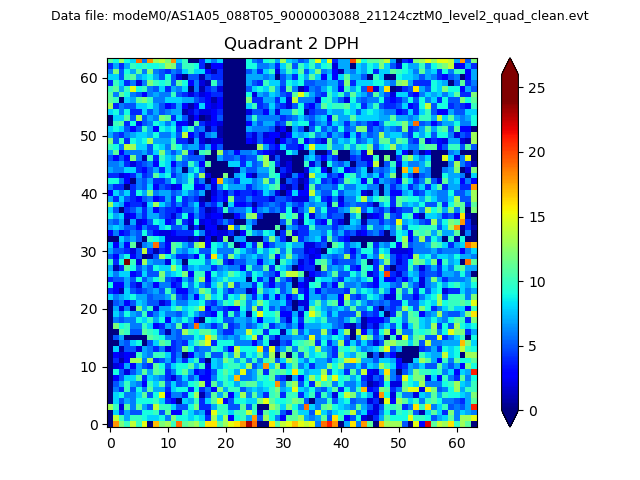
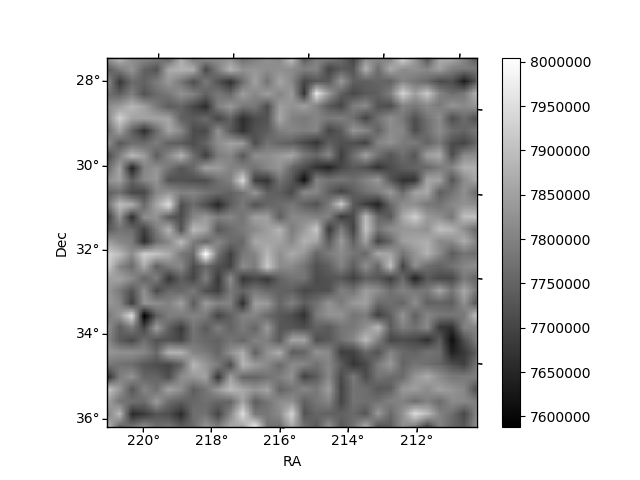
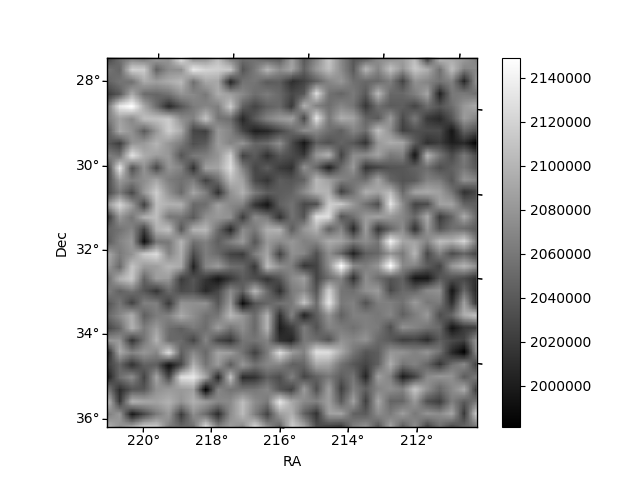
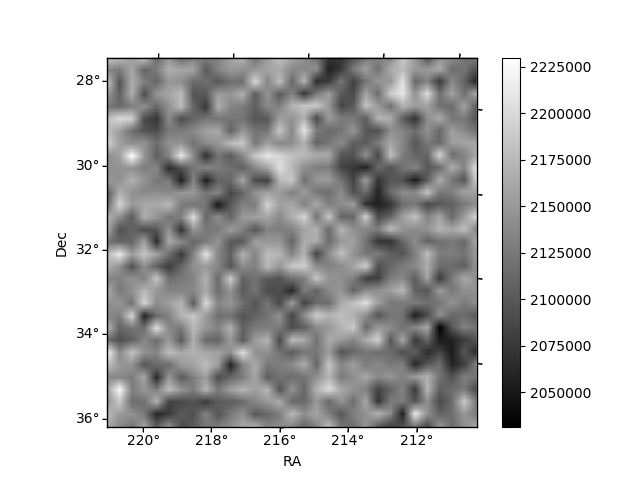
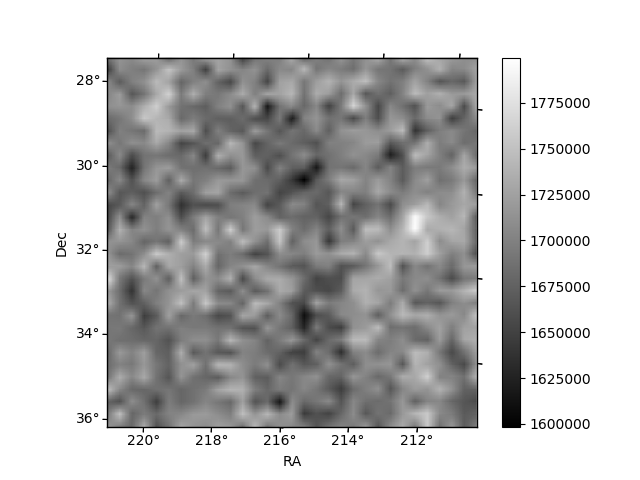
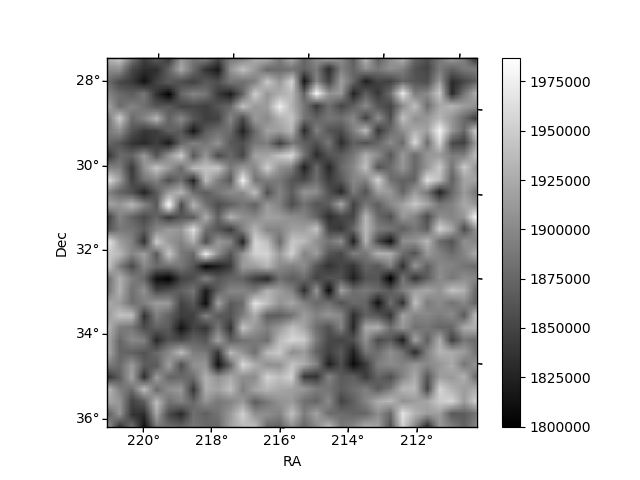
Histogram calculated using DETX and DETY for each event in the final _common_clean file
| Quadrant A | 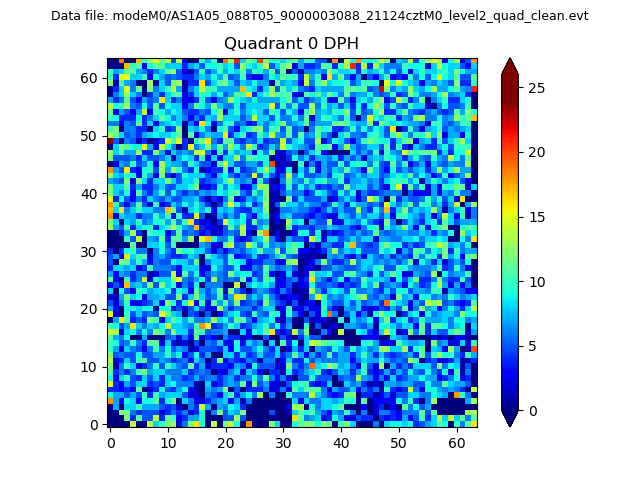 |
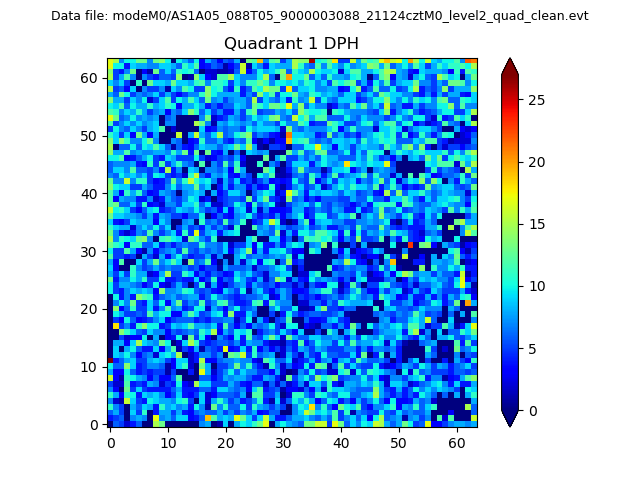 |
Quadrant B |
|---|---|---|---|
| Quadrant D | 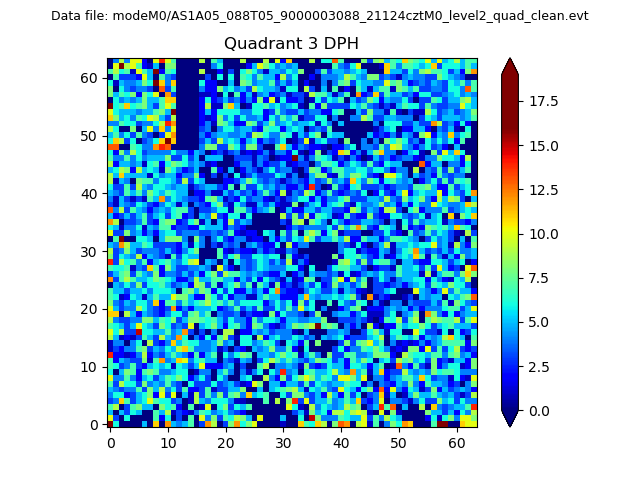 |
 |
Quadrant C |
| Plot type | Count rate plots | Images |
|---|---|---|
| Comparison with Poisson distribution Blue bars denote a histogram of data divided into 1 sec bins. Red curve is a Poisson curve with rate = median count rate of data. |
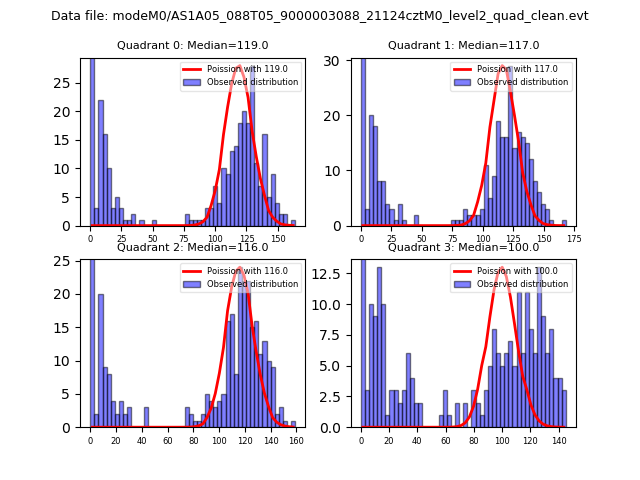 |
 |
| Quadrant-wise count rates Data is divided into 100 sec bins |
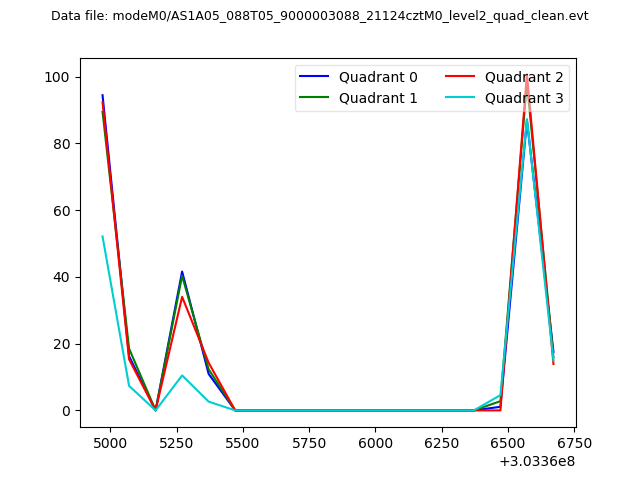 |
|
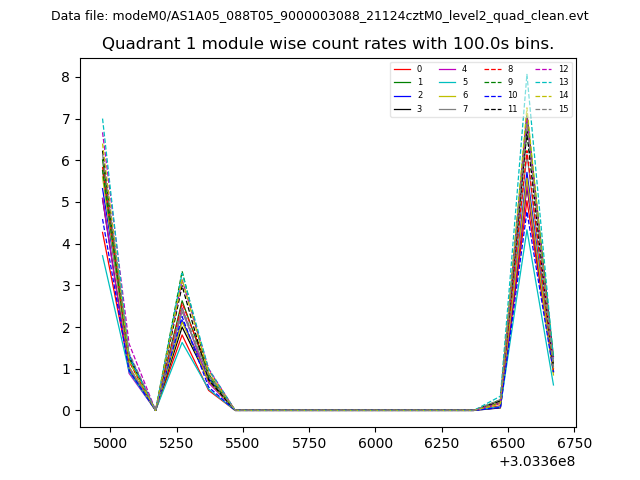
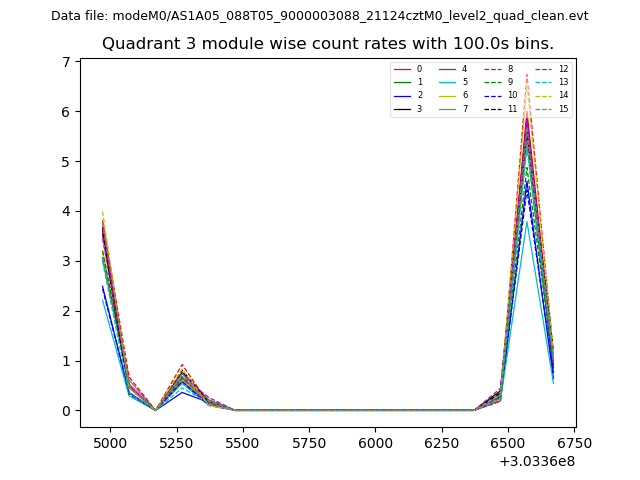
| Module-wise count rates for Quadrant A Data is divided into 100 sec bins |
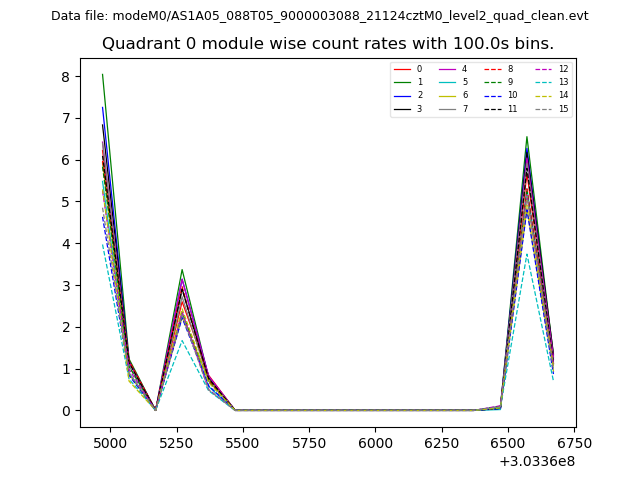 |
 |
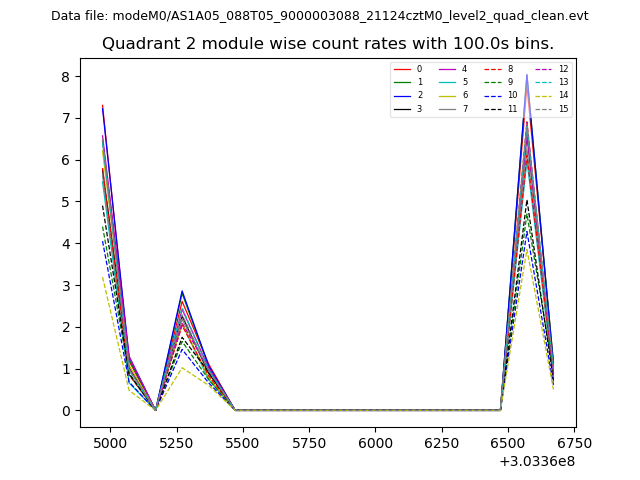
| Module-wise count rates for Quadrant B Data is divided into 100 sec bins |
 |
 |
| Module-wise count rates for Quadrant C Data is divided into 100 sec bins |
 |
 |
| Module-wise count rates for Quadrant D Data is divided into 100 sec bins |
 |
 |
| Parameter | Plot |
|---|---|
| CZT HV Monitor |  |
| D_VDD | 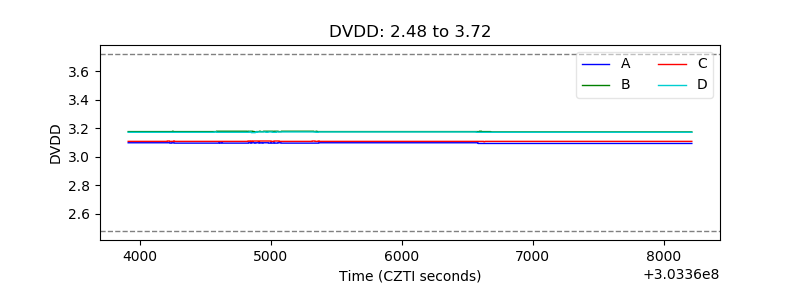 |
| Temperature 1 | 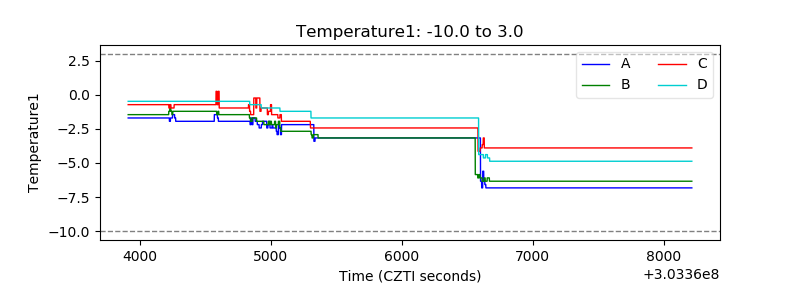 |
| Veto HV Monitor | 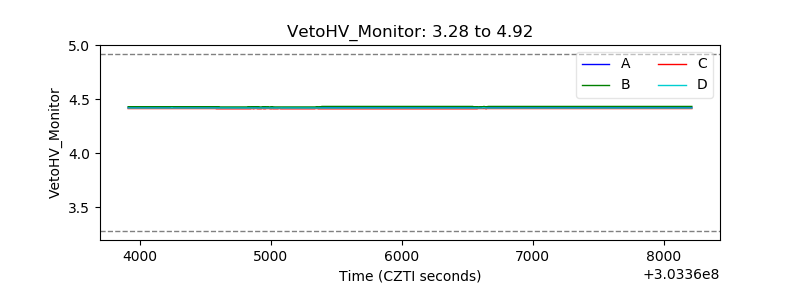 |
| Veto LLD | 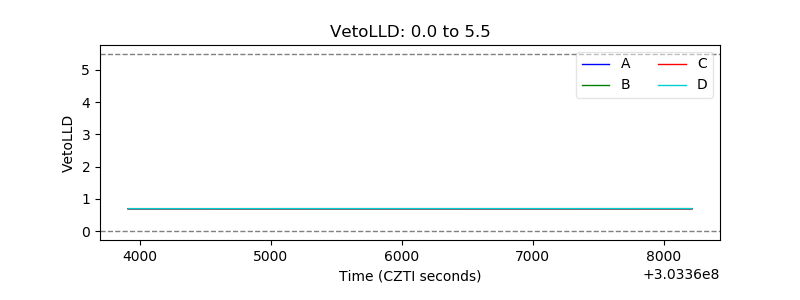 |
| Alpha Counter | 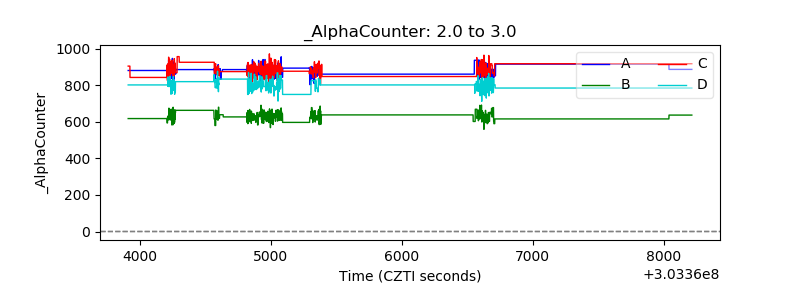 |
| _CPM_Rate | 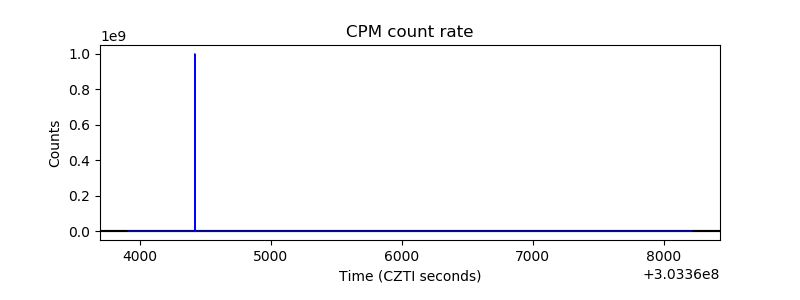 |
| CZT Counter | 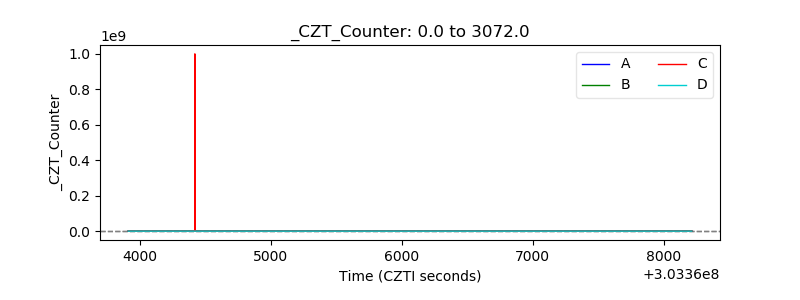 |
| +2.5 Volts monitor |  |
| +5 Volts monitor |  |
| _ROLL_ROT | 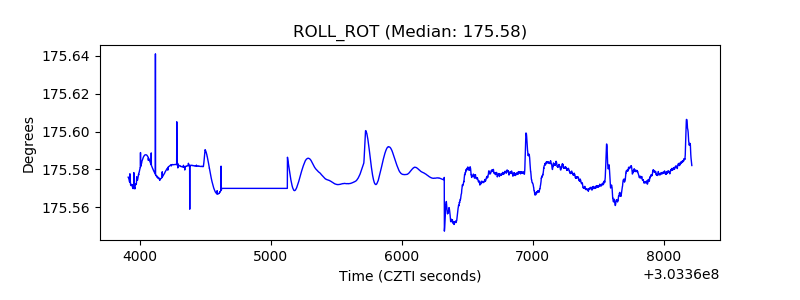 |
| _Roll_DEC | 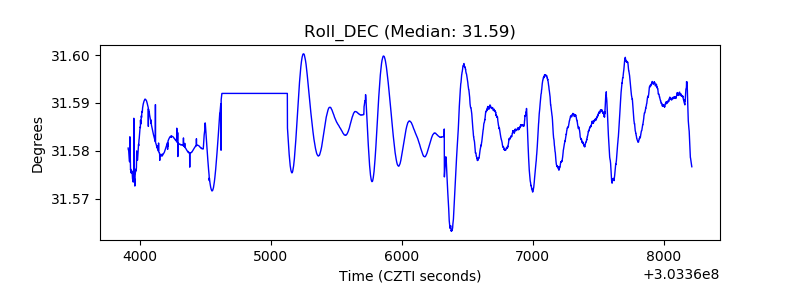 |
| _Roll_RA | 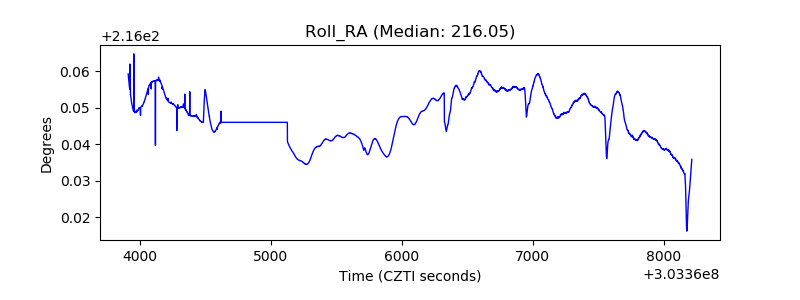 |
| Veto Counter | 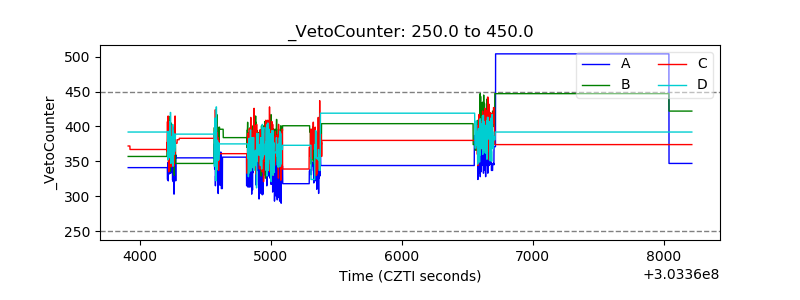 |