| Param | Original file | Final file |
|---|---|---|
| Filename | modeM0/AS1A05_227T03_9000003086cztM0_level2.fits | modeM0/AS1A05_227T03_9000003086cztM0_level2_quad_clean.evt |
| Size (bytes) | 141,203,520 | 155,384,640 |
| Size | 134.7 MB | 148.2 MB |
| Events in quadrant A | 855,862 | 954,112 |
| Events in quadrant B | 813,588 | 940,124 |
| Events in quadrant C | 838,984 | 921,996 |
| Events in quadrant D | 733,508 | 854,544 |
| Mode SS | |||
|---|---|---|---|
| Quadrant | BADHDUFLAG | Total packets | Discarded packets |
| A | 0 | 306 | 0 |
| B | 0 | 306 | 0 |
| C | 0 | 306 | 0 |
| D | 0 | 306 | 0 |
| Mode M9 | |||
|---|---|---|---|
| Quadrant | BADHDUFLAG | Total packets | Discarded packets |
| A | 0 | 12 | 0 |
| B | 0 | 12 | 0 |
| C | 0 | 12 | 0 |
| D | 0 | 12 | 0 |
| Mode M0 | |||
|---|---|---|---|
| Quadrant | BADHDUFLAG | Total packets | Discarded packets |
| A | 0 | 30597 | 0 |
| B | 0 | 32029 | 0 |
| C | 0 | 30999 | 0 |
| D | 0 | 32574 | 0 |
| Quadrant | Total seconds | Saturated seconds | Saturation percentage |
|---|---|---|---|
| A | 14993 | 121 | 0.807043% |
| B | 14993 | 156 | 1.040486% |
| C | 14993 | 169 | 1.127193% |
| D | 14993 | 168 | 1.120523% |
Noise dominated data is calculated using 1-second bins in cleaned event files. If a bin has >2000 counts, and if more than 50% of those come from <1% of pixels, then it is considered to be noise-dominated and hence unusable.
| Quadrant | # 1 sec bins | Bins with >0 counts | Bins with >2000 counts | High rate bins dominated by noise | Noise dominated (total time) | Noise dominated (detector-on time) | Marked lightcurve |
|---|---|---|---|---|---|---|---|
| A | 16243 | 14992 | 0 | 0 | 0.00% | 0.00% |  |
| B | 16243 | 14992 | 0 | 0 | 0.00% | 0.00% |  |
| C | 16243 | 14992 | 0 | 0 | 0.00% | 0.00% |  |
| D | 16242 | 14990 | 0 | 0 | 0.00% | 0.00% |  |
Top three noisy pixels from each quadrant. If the there are fewer than three noisy pixels in the level2.evt file, extra rows are filled as -1
| Pixel properties | Quadrant properties | ||||||
|---|---|---|---|---|---|---|---|
| Quadrant | DetID | PixID | Counts | Sigma | Mean | Median | Sigma |
| A | 14 | 188 | 845 | 11.27 | 222 | 209 | 56.4 |
| A | 0 | 29 | 814 | 10.72 | 222 | 209 | 56.4 |
| A | 14 | 204 | 735 | 9.32 | 222 | 209 | 56.4 |
| B | 2 | 9 | 646 | 9.74 | 216 | 205 | 45.3 |
| B | 2 | 8 | 601 | 8.75 | 216 | 205 | 45.3 |
| B | 14 | 254 | 546 | 7.53 | 216 | 205 | 45.3 |
| C | 1 | 81 | 635 | 7.31 | 221 | 207 | 58.5 |
| C | 12 | 241 | 616 | 6.99 | 221 | 207 | 58.5 |
| C | 1 | 80 | 612 | 6.92 | 221 | 207 | 58.5 |
| D | 3 | 14 | 565 | 6.57 | 209 | 191 | 56.9 |
| D | 1 | 31 | 530 | 5.96 | 209 | 191 | 56.9 |
| D | 10 | 189 | 508 | 5.57 | 209 | 191 | 56.9 |
Histogram calculated using DETX and DETY for each event in the final _common_clean file
| Quadrant A | 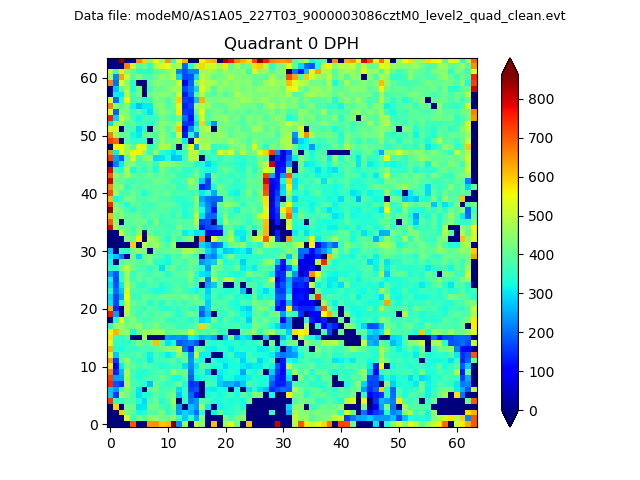 |
 |
Quadrant B |
|---|---|---|---|
| Quadrant D |  |
 |
Quadrant C |
| Plot type | Count rate plots | Images |
|---|---|---|
| Comparison with Poisson distribution Blue bars denote a histogram of data divided into 1 sec bins. Red curve is a Poisson curve with rate = median count rate of data. |
 |
 |
| Quadrant-wise count rates Data is divided into 100 sec bins |
 |
|
| Module-wise count rates for Quadrant A Data is divided into 100 sec bins |
 |
 |
| Module-wise count rates for Quadrant B Data is divided into 100 sec bins |
 |
 |
| Module-wise count rates for Quadrant C Data is divided into 100 sec bins |
 |
 |
| Module-wise count rates for Quadrant D Data is divided into 100 sec bins |
 |
 |
| Parameter | Plot |
|---|---|
| CZT HV Monitor |  |
| D_VDD | 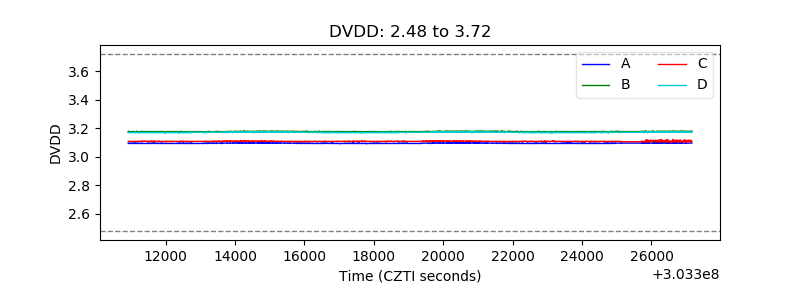 |
| Temperature 1 |  |
| Veto HV Monitor |  |
| Veto LLD |  |
| Alpha Counter |  |
| _CPM_Rate |  |
| CZT Counter |  |
| +2.5 Volts monitor |  |
| +5 Volts monitor |  |
| _ROLL_ROT |  |
| _Roll_DEC |  |
| _Roll_RA |  |
| Veto Counter |  |