| Param | Original file | Final file |
|---|---|---|
| Filename | modeM0/AS1A05_227T03_9000003086_20935cztM0_level2.evt | modeM0/AS1A05_227T03_9000003086_20935cztM0_level2_quad_clean.evt |
| Size (bytes) | 247,374,720 | 51,154,560 |
| Size | 235.9 MB | 48.8 MB |
| Events in quadrant A | 1,689,145 | 328,042 |
| Events in quadrant B | 1,856,200 | 331,265 |
| Events in quadrant C | 1,738,382 | 325,127 |
| Events in quadrant D | 1,969,811 | 317,670 |
| Mode SS | |||
|---|---|---|---|
| Quadrant | BADHDUFLAG | Total packets | Discarded packets |
| A | 0 | 72 | 0 |
| B | 0 | 72 | 0 |
| C | 0 | 72 | 0 |
| D | 0 | 72 | 0 |
| Mode M9 | |||
|---|---|---|---|
| Quadrant | BADHDUFLAG | Total packets | Discarded packets |
| A | 0 | 3 | 0 |
| B | 0 | 3 | 0 |
| C | 0 | 3 | 0 |
| D | 0 | 3 | 0 |
| Mode M0 | |||
|---|---|---|---|
| Quadrant | BADHDUFLAG | Total packets | Discarded packets |
| A | 0 | 7186 | 1 |
| B | 0 | 7582 | 2 |
| C | 0 | 7256 | 1 |
| D | 0 | 7987 | 1 |
| Quadrant | Total seconds | Saturated seconds | Saturation percentage |
|---|---|---|---|
| A | 3481 | 46 | 1.321459% |
| B | 3480 | 62 | 1.781609% |
| C | 3480 | 63 | 1.810345% |
| D | 3480 | 54 | 1.551724% |
Noise dominated data is calculated using 1-second bins in cleaned event files. If a bin has >2000 counts, and if more than 50% of those come from <1% of pixels, then it is considered to be noise-dominated and hence unusable.
| Quadrant | # 1 sec bins | Bins with >0 counts | Bins with >2000 counts | High rate bins dominated by noise | Noise dominated (total time) | Noise dominated (detector-on time) | Marked lightcurve |
|---|---|---|---|---|---|---|---|
| A | 3781 | 3482 | 0 | 0 | 0.00% | 0.00% | 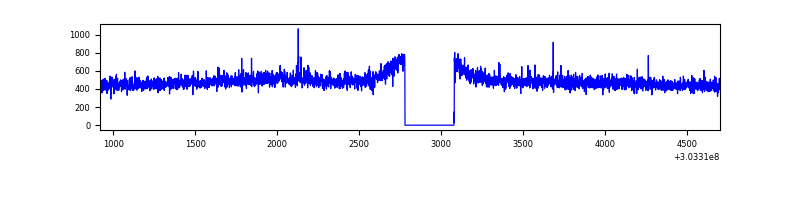 |
| B | 3780 | 3481 | 5 | 5 | 0.13% | 0.14% | 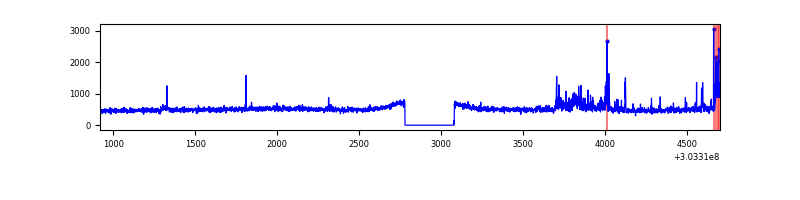 |
| C | 3780 | 3481 | 0 | 0 | 0.00% | 0.00% | 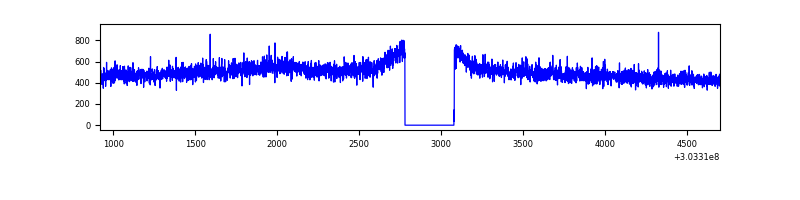 |
| D | 3780 | 3481 | 21 | 21 | 0.56% | 0.60% | 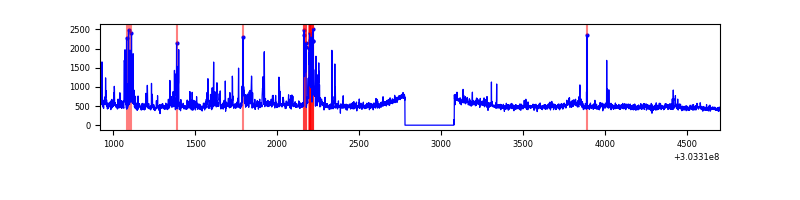 |
Top three noisy pixels from each quadrant. If the there are fewer than three noisy pixels in the level2.evt file, extra rows are filled as -1
| Pixel properties | Quadrant properties | ||||||
|---|---|---|---|---|---|---|---|
| Quadrant | DetID | PixID | Counts | Sigma | Mean | Median | Sigma |
| A | 0 | 226 | 3863 | 38.18 | 438 | 427 | 90.0 |
| A | 3 | 137 | 3654 | 35.85 | 438 | 427 | 90.0 |
| A | 12 | 194 | 3198 | 30.79 | 438 | 427 | 90.0 |
| B | 7 | 220 | 43094 | 505.99 | 435 | 423 | 84.3 |
| B | 0 | 190 | 37477 | 439.39 | 435 | 423 | 84.3 |
| B | 0 | 229 | 36438 | 427.07 | 435 | 423 | 84.3 |
| C | 14 | 238 | 66307 | 657.29 | 424 | 427 | 100.2 |
| C | 7 | 247 | 16208 | 157.45 | 424 | 427 | 100.2 |
| C | 13 | 61 | 2985 | 25.52 | 424 | 427 | 100.2 |
| D | 9 | 1 | 171468 | 1640.56 | 430 | 417 | 104.3 |
| D | 1 | 20 | 79137 | 755.01 | 430 | 417 | 104.3 |
| D | 1 | 52 | 72185 | 688.33 | 430 | 417 | 104.3 |
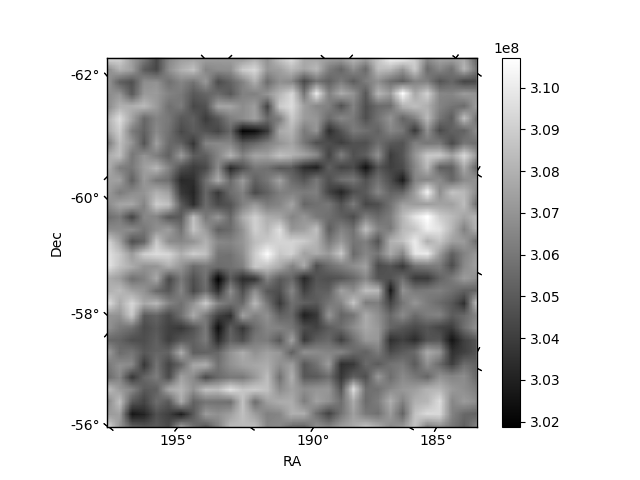
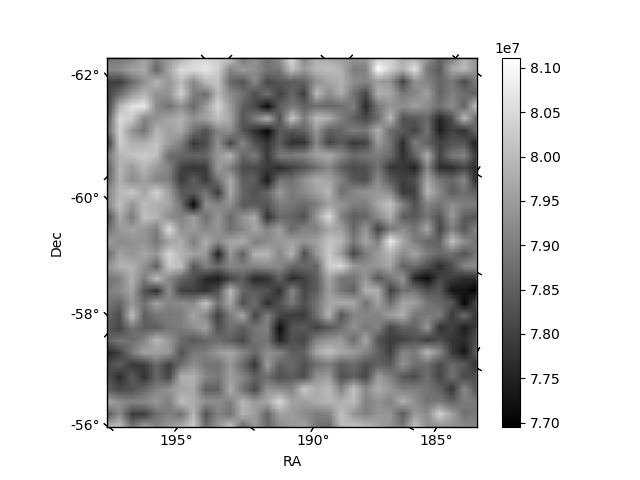
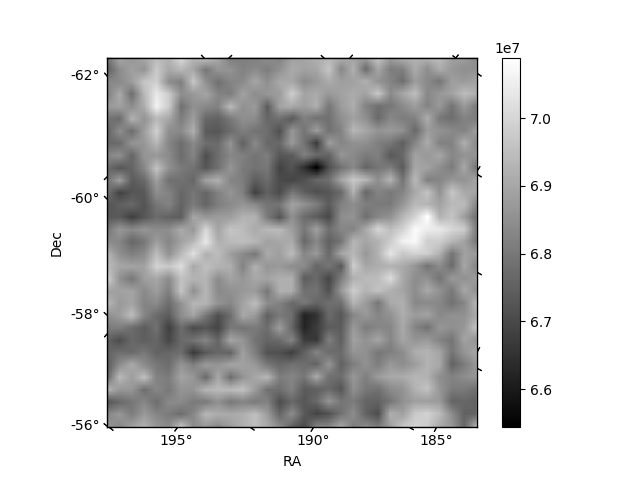
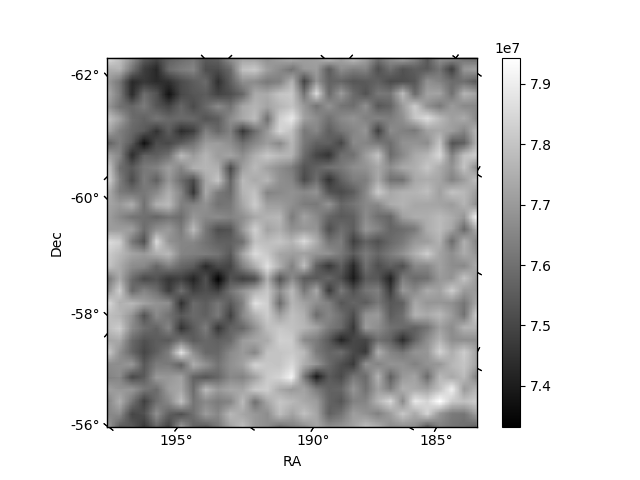
Histogram calculated using DETX and DETY for each event in the final _common_clean file
| Quadrant A | 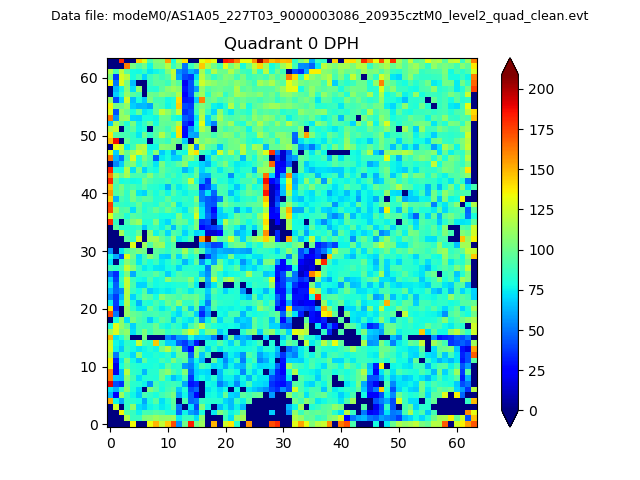 |
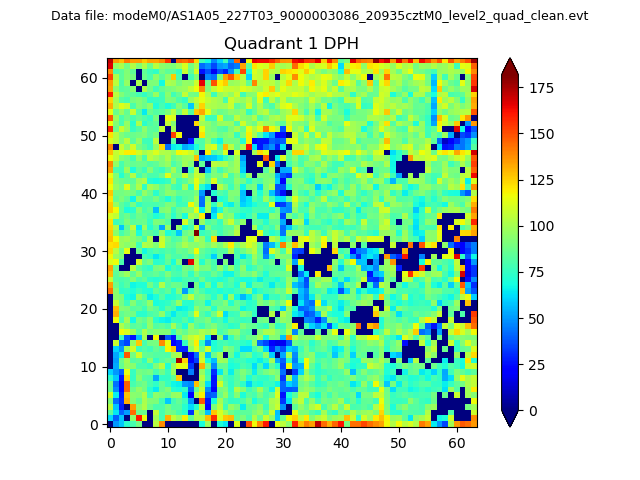 |
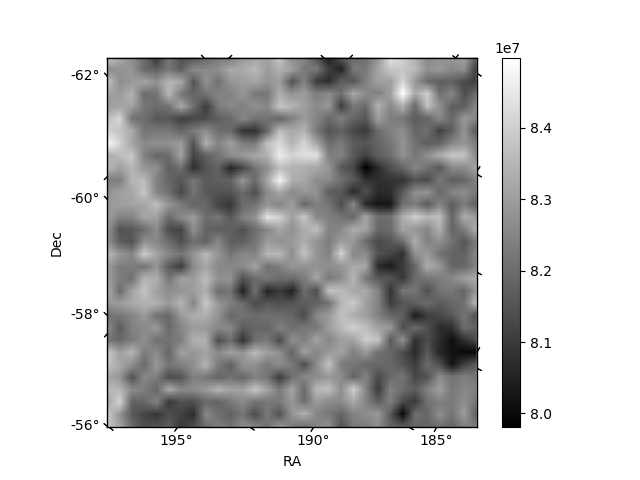
Quadrant B |
|---|---|---|---|
| Quadrant D | 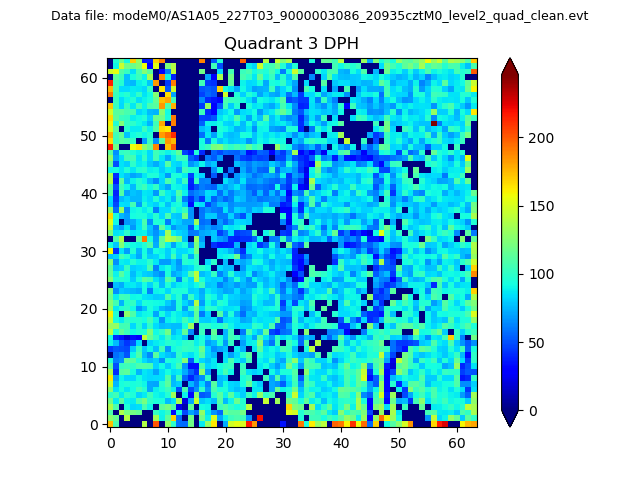 |
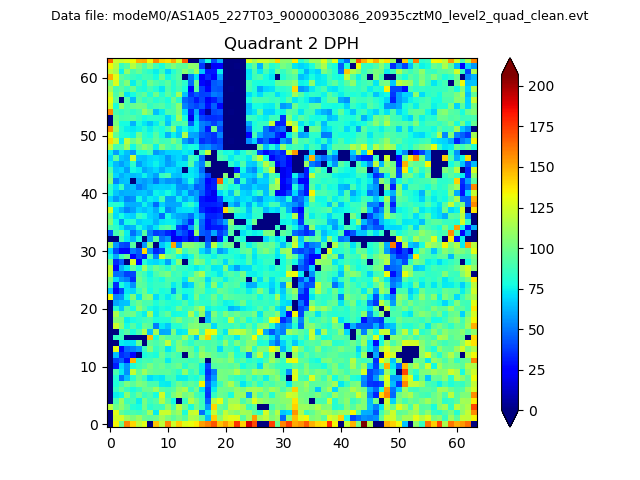 |
Quadrant C |
| Plot type | Count rate plots | Images |
|---|---|---|
| Comparison with Poisson distribution Blue bars denote a histogram of data divided into 1 sec bins. Red curve is a Poisson curve with rate = median count rate of data. |
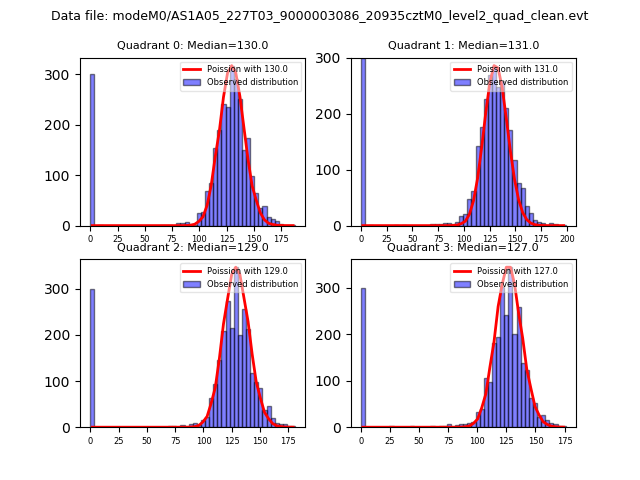 |
 |
| Quadrant-wise count rates Data is divided into 100 sec bins |
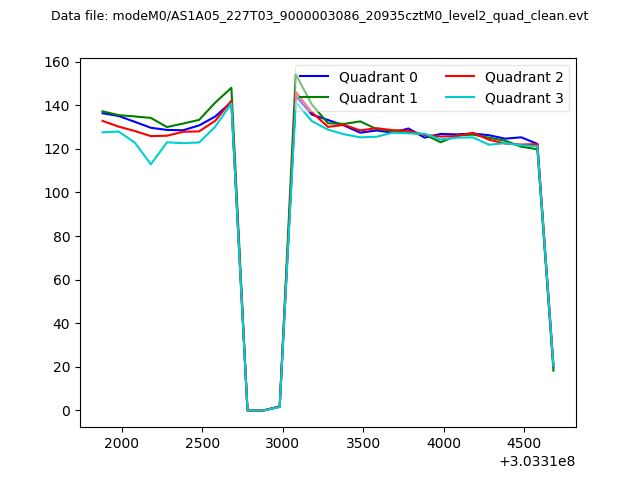 |
|
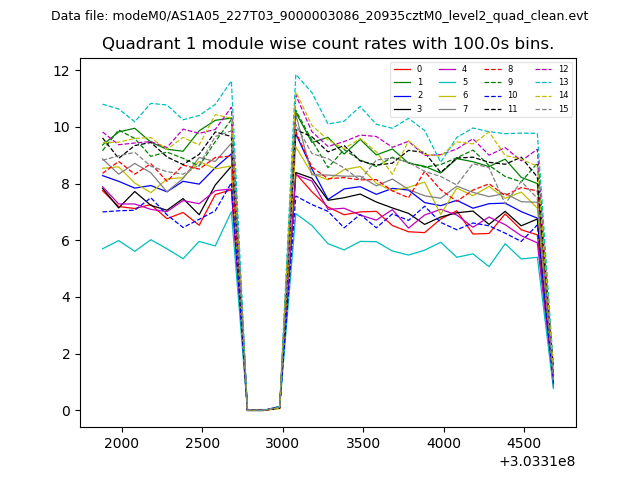
| Module-wise count rates for Quadrant A Data is divided into 100 sec bins |
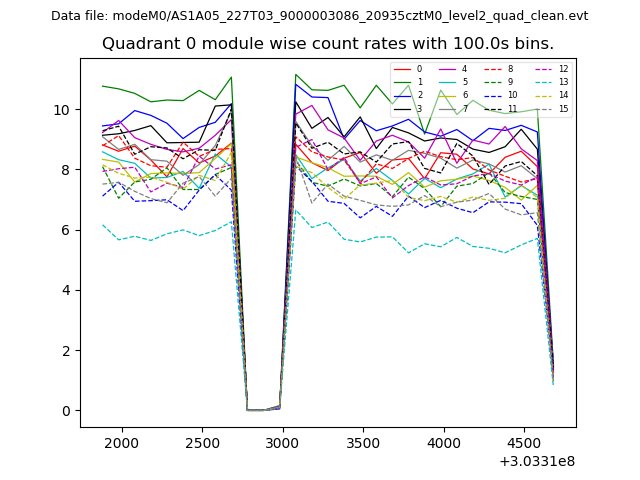 |
 |
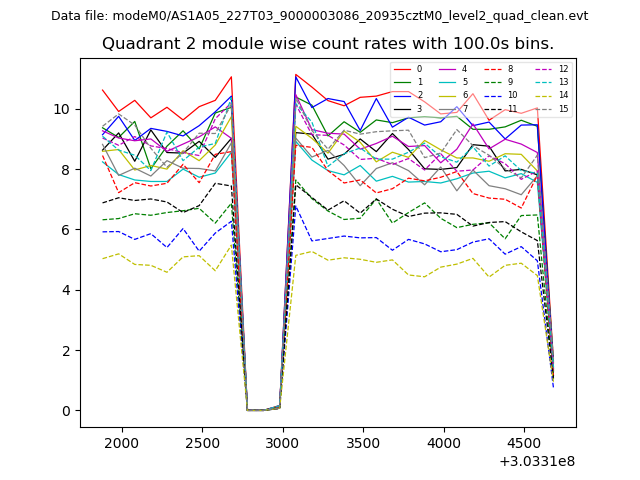
| Module-wise count rates for Quadrant B Data is divided into 100 sec bins |
 |
 |
| Module-wise count rates for Quadrant C Data is divided into 100 sec bins |
 |
 |
| Module-wise count rates for Quadrant D Data is divided into 100 sec bins |
 |
 |
| Parameter | Plot |
|---|---|
| CZT HV Monitor | 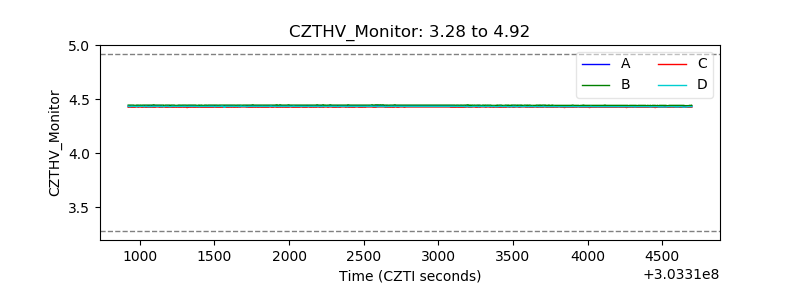 |
| D_VDD | 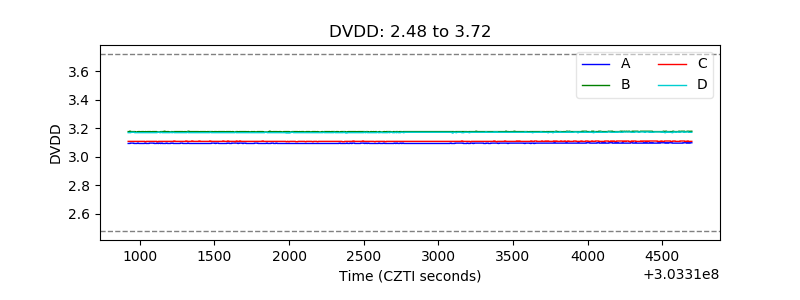 |
| Temperature 1 | 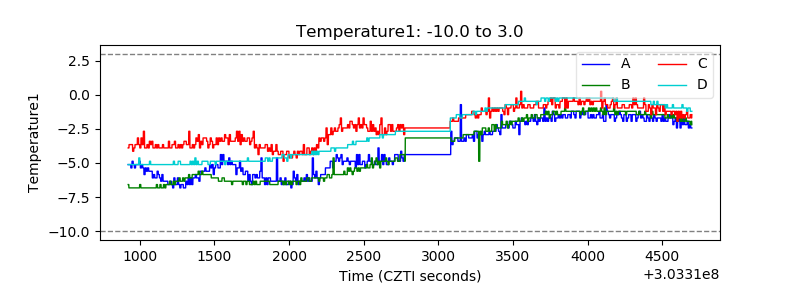 |
| Veto HV Monitor | 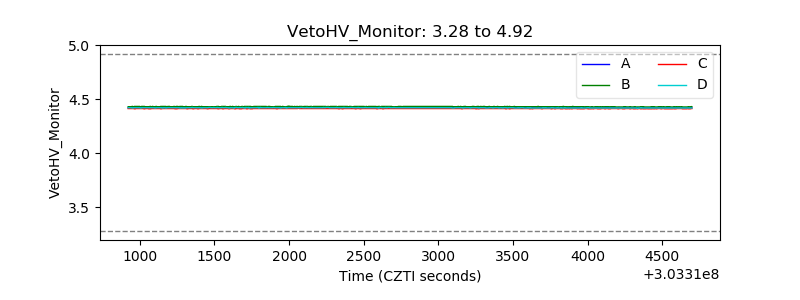 |
| Veto LLD |  |
| Alpha Counter | 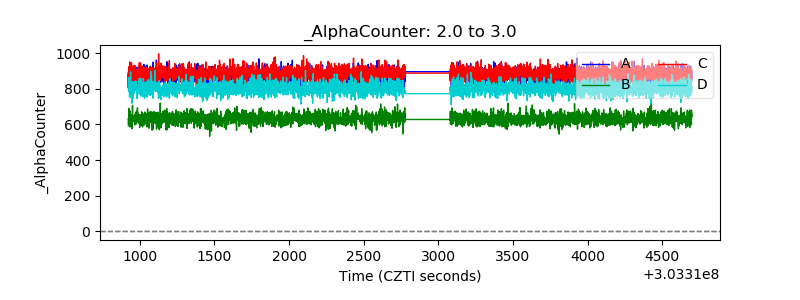 |
| _CPM_Rate | 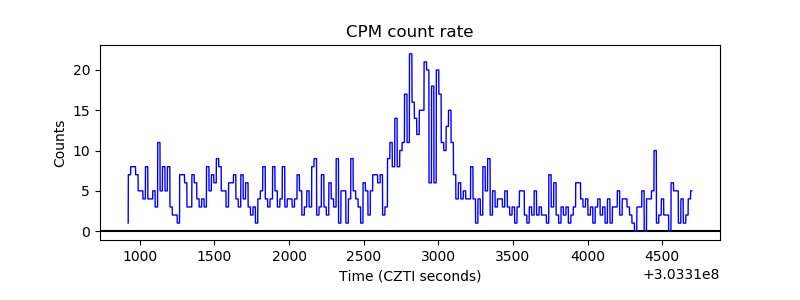 |
| CZT Counter | 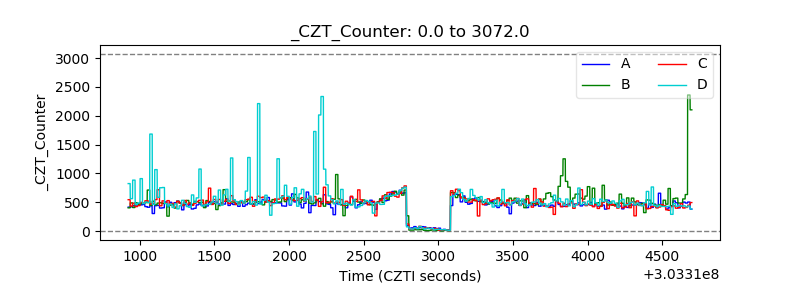 |
| +2.5 Volts monitor |  |
| +5 Volts monitor |  |
| _ROLL_ROT | 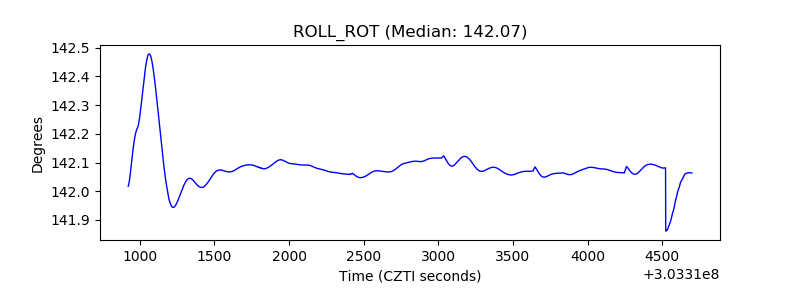 |
| _Roll_DEC | 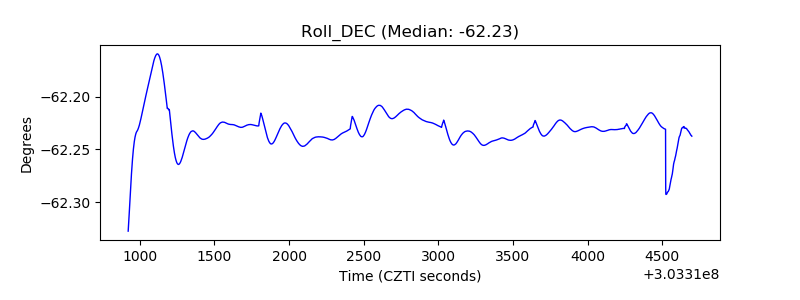 |
| _Roll_RA | 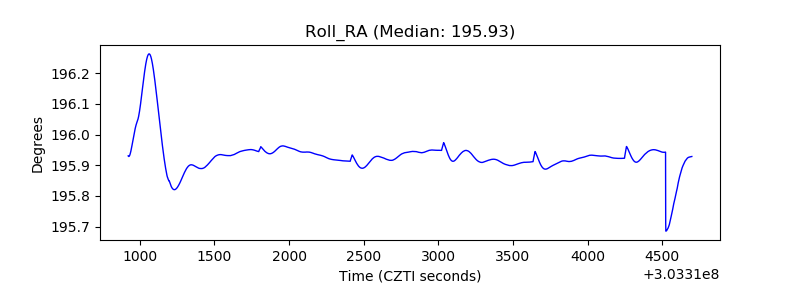 |
| Veto Counter |  |