| Param | Original file | Final file |
|---|---|---|
| Filename | modeM0/AS1T03_131T01_9000003090_20958cztM0_level2.evt | modeM0/AS1T03_131T01_9000003090_20958cztM0_level2_quad_clean.evt |
| Size (bytes) | 328,947,840 | 57,830,400 |
| Size | 313.7 MB | 55.2 MB |
| Events in quadrant A | 2,181,158 | 368,800 |
| Events in quadrant B | 2,372,659 | 380,438 |
| Events in quadrant C | 2,269,695 | 362,133 |
| Events in quadrant D | 2,853,512 | 344,554 |
| Mode SS | |||
|---|---|---|---|
| Quadrant | BADHDUFLAG | Total packets | Discarded packets |
| A | 0 | 84 | 0 |
| B | 0 | 84 | 0 |
| C | 0 | 84 | 0 |
| D | 0 | 84 | 0 |
| Mode M9 | |||
|---|---|---|---|
| Quadrant | BADHDUFLAG | Total packets | Discarded packets |
| A | 0 | 14 | 0 |
| B | 0 | 14 | 0 |
| C | 0 | 14 | 0 |
| D | 0 | 14 | 0 |
| Mode M0 | |||
|---|---|---|---|
| Quadrant | BADHDUFLAG | Total packets | Discarded packets |
| A | 0 | 8816 | 0 |
| B | 0 | 9495 | 0 |
| C | 0 | 9081 | 0 |
| D | 0 | 11240 | 0 |
| Quadrant | Total seconds | Saturated seconds | Saturation percentage |
|---|---|---|---|
| A | 4193 | 26 | 0.620081% |
| B | 4193 | 56 | 1.335559% |
| C | 4193 | 66 | 1.574052% |
| D | 4193 | 112 | 2.671119% |
Noise dominated data is calculated using 1-second bins in cleaned event files. If a bin has >2000 counts, and if more than 50% of those come from <1% of pixels, then it is considered to be noise-dominated and hence unusable.
| Quadrant | # 1 sec bins | Bins with >0 counts | Bins with >2000 counts | High rate bins dominated by noise | Noise dominated (total time) | Noise dominated (detector-on time) | Marked lightcurve |
|---|---|---|---|---|---|---|---|
| A | 5498 | 4194 | 0 | 0 | 0.00% | 0.00% | 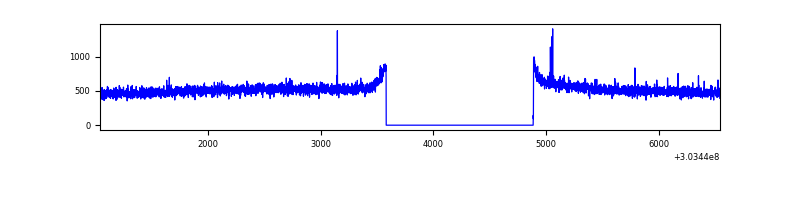 |
| B | 5498 | 4194 | 6 | 6 | 0.11% | 0.14% | 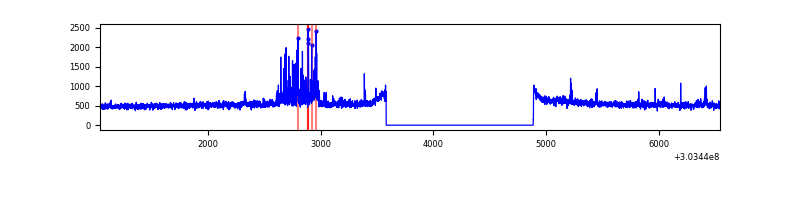 |
| C | 5498 | 4194 | 11 | 11 | 0.20% | 0.26% |  |
| D | 5498 | 4194 | 66 | 66 | 1.20% | 1.57% | 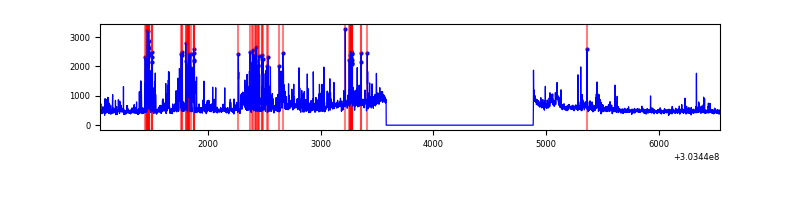 |
Top three noisy pixels from each quadrant. If the there are fewer than three noisy pixels in the level2.evt file, extra rows are filled as -1
| Pixel properties | Quadrant properties | ||||||
|---|---|---|---|---|---|---|---|
| Quadrant | DetID | PixID | Counts | Sigma | Mean | Median | Sigma |
| A | 5 | 16 | 9881 | 81.9 | 564 | 555 | 113.9 |
| A | 0 | 226 | 4812 | 37.38 | 564 | 555 | 113.9 |
| A | 3 | 137 | 4390 | 33.68 | 564 | 555 | 113.9 |
| B | 7 | 220 | 110645 | 1031.1 | 566 | 553 | 106.8 |
| B | 0 | 190 | 18816 | 171.05 | 566 | 553 | 106.8 |
| B | 12 | 111 | 12349 | 110.48 | 566 | 553 | 106.8 |
| C | 14 | 238 | 85221 | 671.14 | 541 | 548 | 126.2 |
| C | 9 | 54 | 72330 | 568.96 | 541 | 548 | 126.2 |
| C | 13 | 61 | 3757 | 25.44 | 541 | 548 | 126.2 |
| D | 5 | 222 | 457129 | 3451.2 | 543 | 528 | 132.3 |
| D | 1 | 52 | 203180 | 1531.74 | 543 | 528 | 132.3 |
| D | 7 | 238 | 53214 | 398.23 | 543 | 528 | 132.3 |
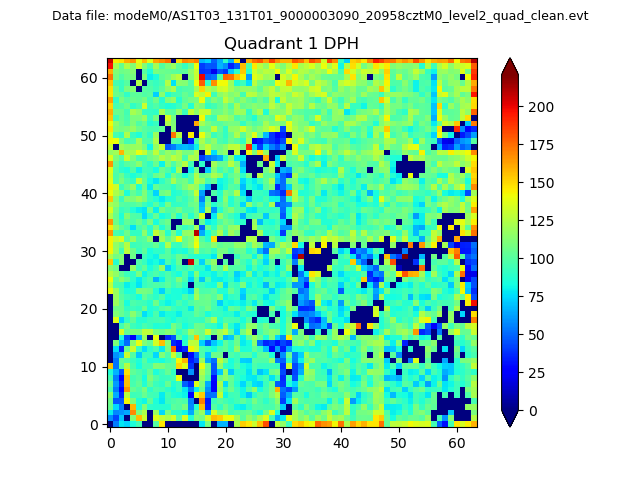
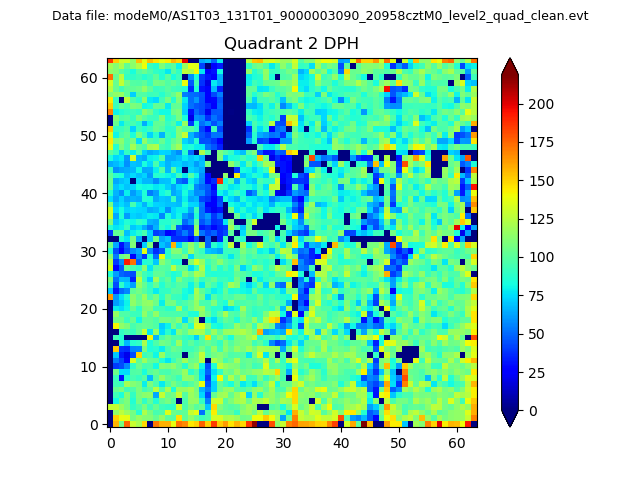
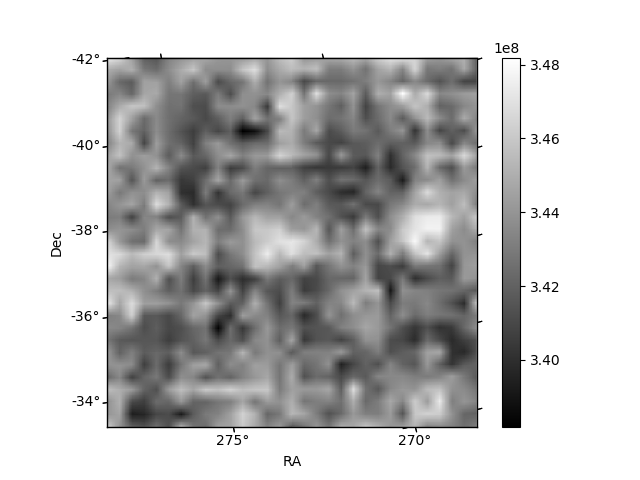
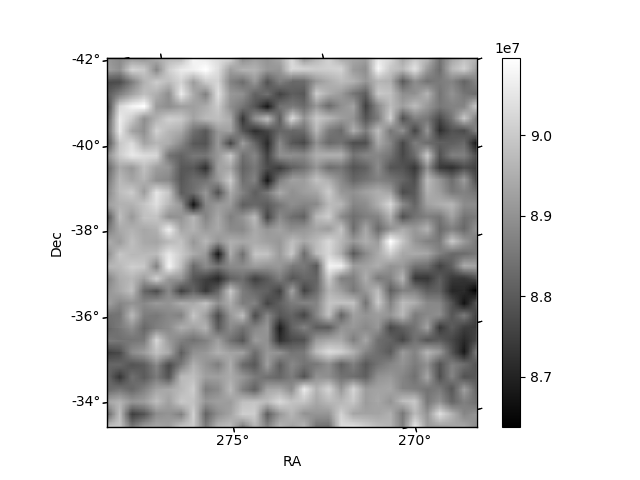
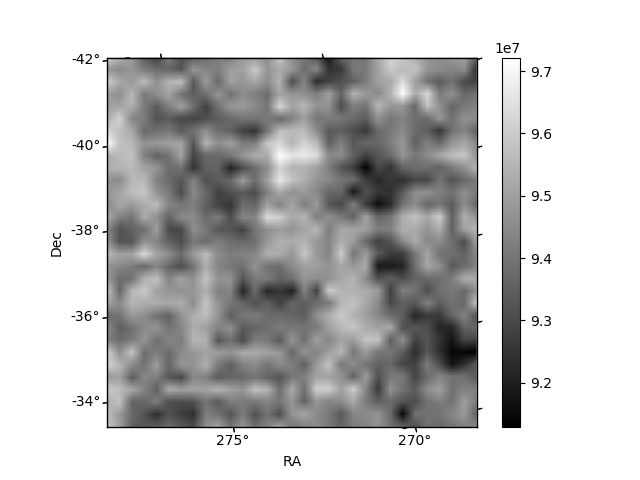
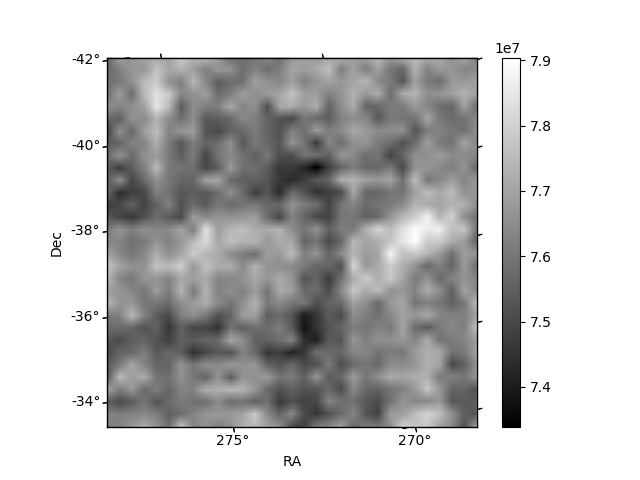
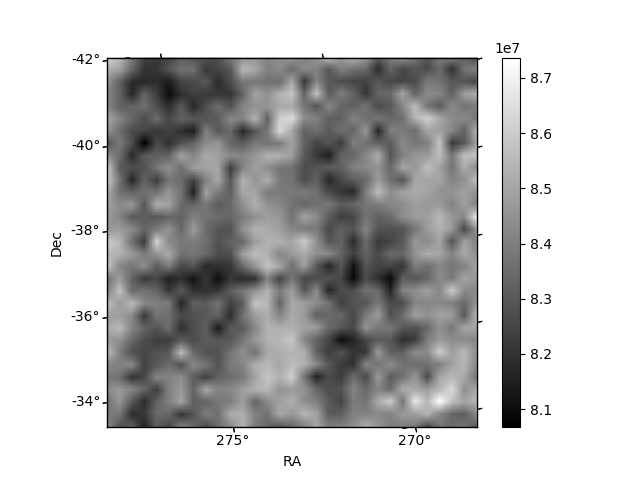
Histogram calculated using DETX and DETY for each event in the final _common_clean file
| Quadrant A | 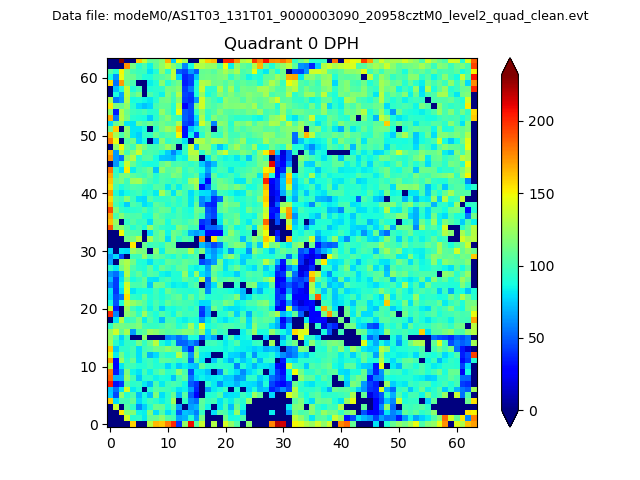 |
 |
Quadrant B |
|---|---|---|---|
| Quadrant D | 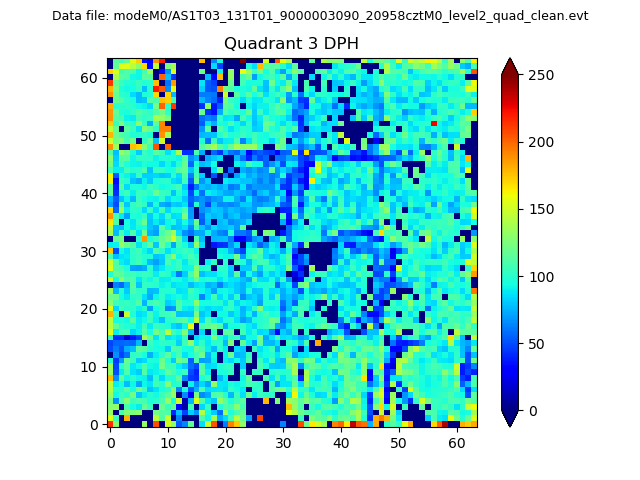 |
 |
Quadrant C |
| Plot type | Count rate plots | Images |
|---|---|---|
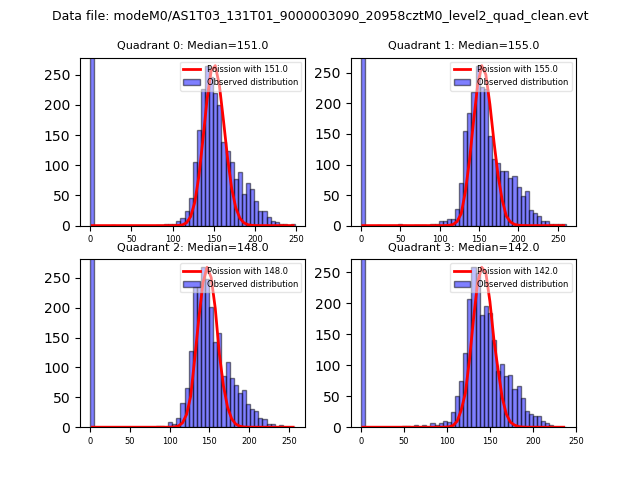
| Comparison with Poisson distribution Blue bars denote a histogram of data divided into 1 sec bins. Red curve is a Poisson curve with rate = median count rate of data. |
 |
 |
| Quadrant-wise count rates Data is divided into 100 sec bins |
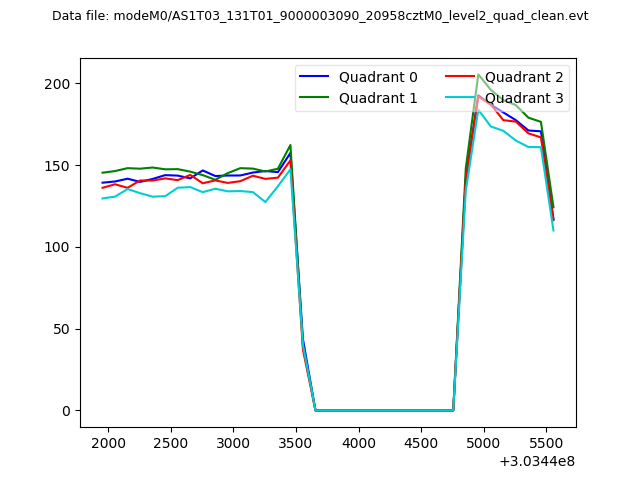 |
|
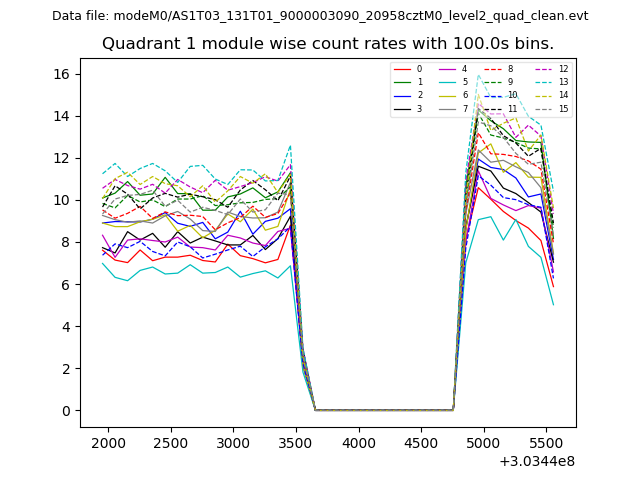
| Module-wise count rates for Quadrant A Data is divided into 100 sec bins |
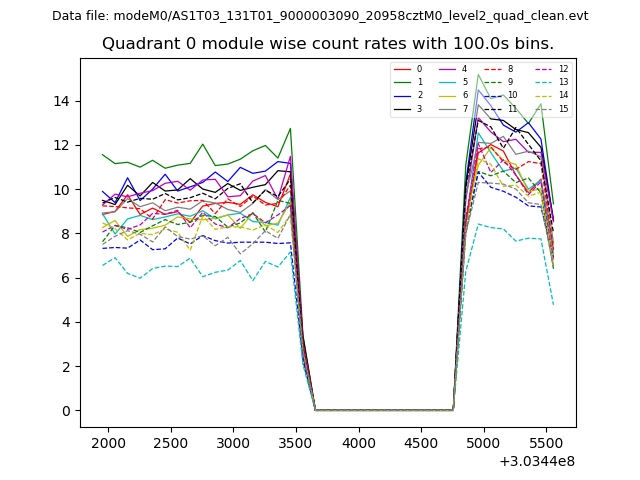 |
 |
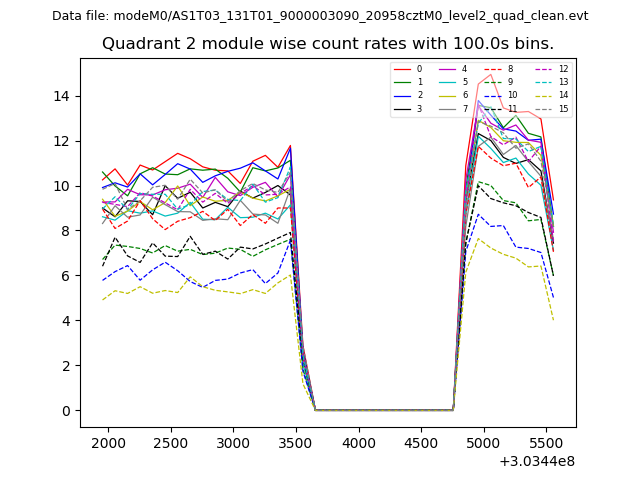
| Module-wise count rates for Quadrant B Data is divided into 100 sec bins |
 |
 |
| Module-wise count rates for Quadrant C Data is divided into 100 sec bins |
 |
 |
| Module-wise count rates for Quadrant D Data is divided into 100 sec bins |
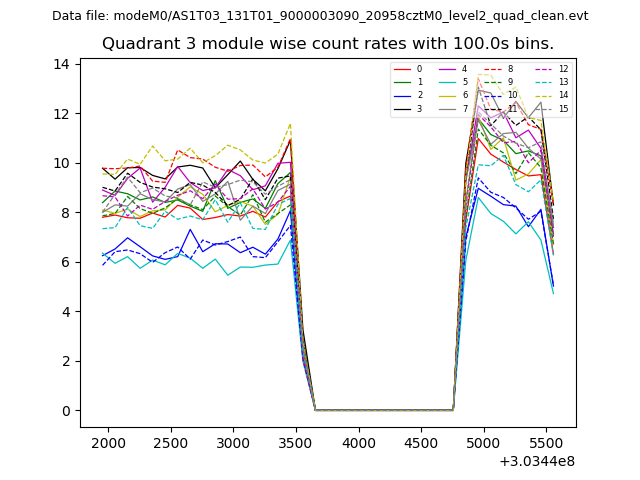 |
 |
| Parameter | Plot |
|---|---|
| CZT HV Monitor | 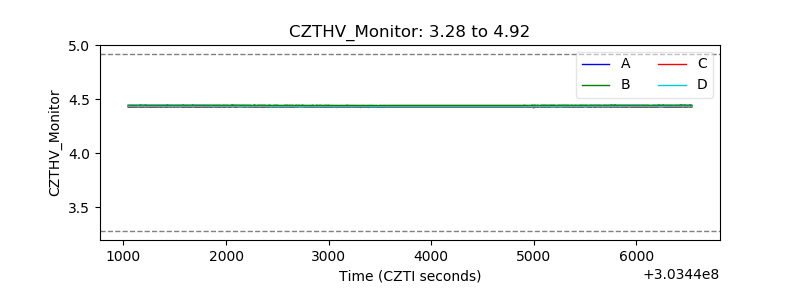 |
| D_VDD | 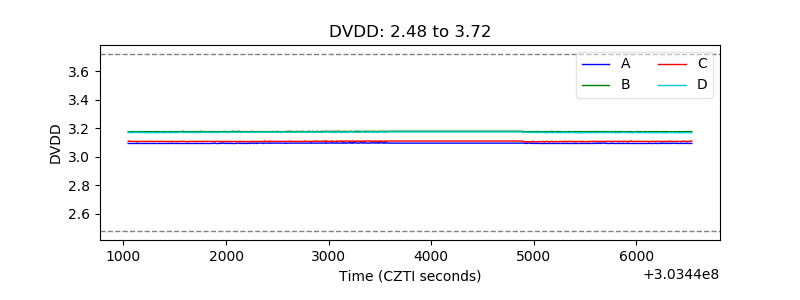 |
| Temperature 1 | 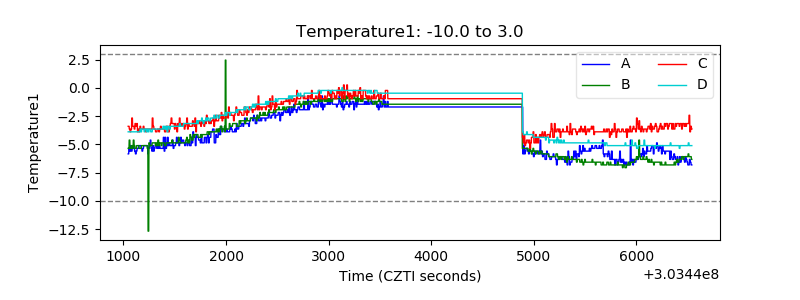 |
| Veto HV Monitor | 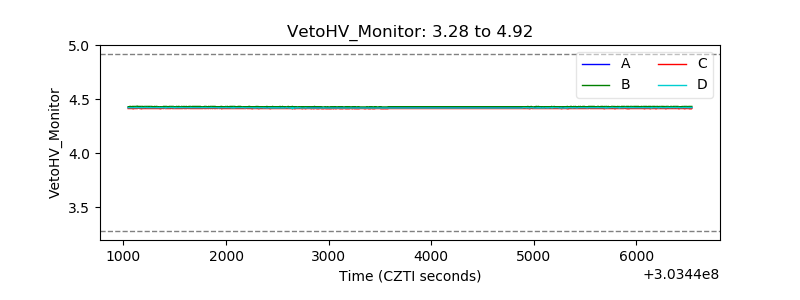 |
| Veto LLD | 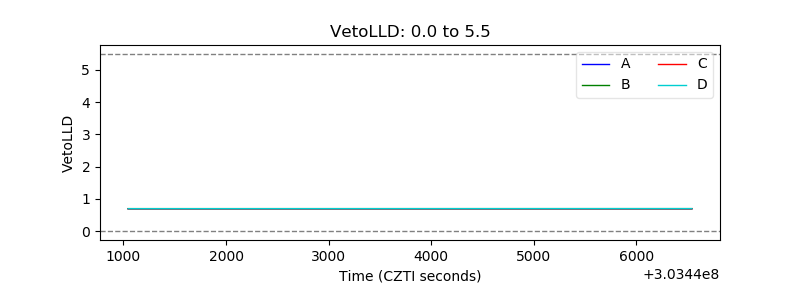 |
| Alpha Counter | 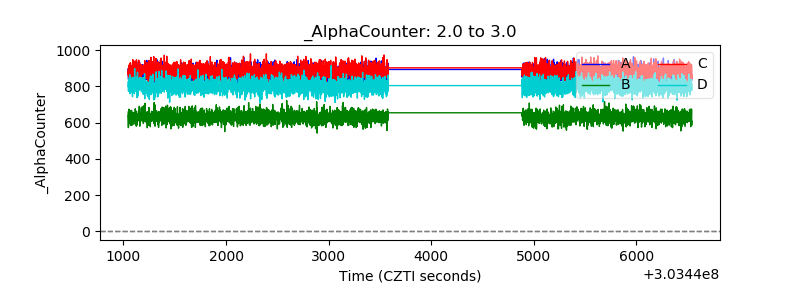 |
| _CPM_Rate | 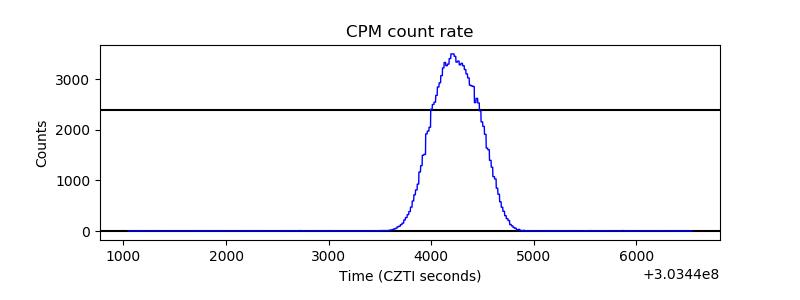 |
| CZT Counter | 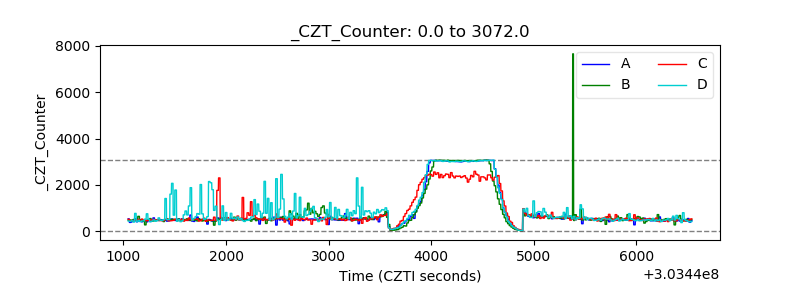 |
| +2.5 Volts monitor |  |
| +5 Volts monitor |  |
| _ROLL_ROT | 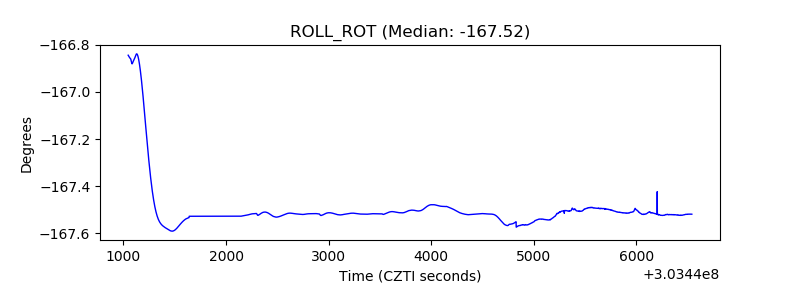 |
| _Roll_DEC | 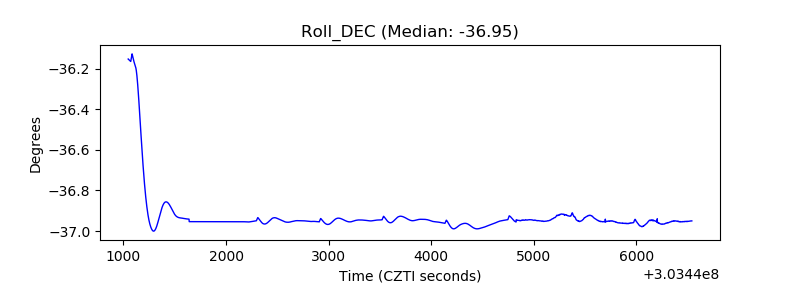 |
| _Roll_RA | 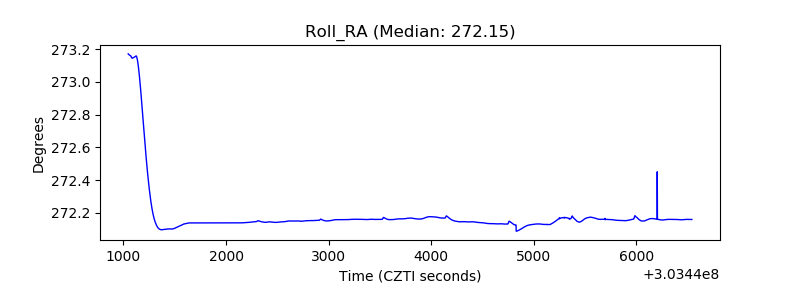 |
| Veto Counter | 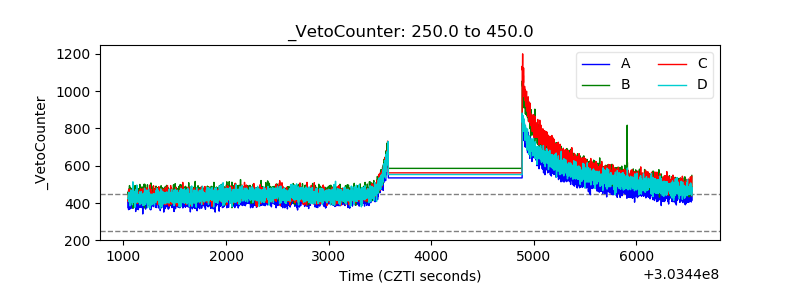 |