| Param | Original file | Final file |
|---|---|---|
| Filename | modeM0/AS1T03_131T01_9000003090_20959cztM0_level2.evt | modeM0/AS1T03_131T01_9000003090_20959cztM0_level2_quad_clean.evt |
| Size (bytes) | 710,997,120 | 113,650,560 |
| Size | 678.1 MB | 108.4 MB |
| Events in quadrant A | 4,767,565 | 713,599 |
| Events in quadrant B | 5,144,636 | 733,349 |
| Events in quadrant C | 4,774,826 | 706,395 |
| Events in quadrant D | 6,239,957 | 667,357 |
| Mode SS | |||
|---|---|---|---|
| Quadrant | BADHDUFLAG | Total packets | Discarded packets |
| A | 0 | 180 | 0 |
| B | 0 | 180 | 0 |
| C | 0 | 180 | 0 |
| D | 0 | 180 | 0 |
| Mode M9 | |||
|---|---|---|---|
| Quadrant | BADHDUFLAG | Total packets | Discarded packets |
| A | 0 | 28 | 0 |
| B | 0 | 28 | 0 |
| C | 0 | 28 | 0 |
| D | 0 | 28 | 0 |
| Mode M0 | |||
|---|---|---|---|
| Quadrant | BADHDUFLAG | Total packets | Discarded packets |
| A | 0 | 19276 | 1 |
| B | 0 | 20595 | 1 |
| C | 0 | 19137 | 1 |
| D | 0 | 24367 | 1 |
| Quadrant | Total seconds | Saturated seconds | Saturation percentage |
|---|---|---|---|
| A | 8962 | 74 | 0.825709% |
| B | 8961 | 113 | 1.261020% |
| C | 8961 | 121 | 1.350296% |
| D | 8961 | 294 | 3.280884% |
Noise dominated data is calculated using 1-second bins in cleaned event files. If a bin has >2000 counts, and if more than 50% of those come from <1% of pixels, then it is considered to be noise-dominated and hence unusable.
| Quadrant | # 1 sec bins | Bins with >0 counts | Bins with >2000 counts | High rate bins dominated by noise | Noise dominated (total time) | Noise dominated (detector-on time) | Marked lightcurve |
|---|---|---|---|---|---|---|---|
| A | 11642 | 8964 | 27 | 27 | 0.23% | 0.30% | 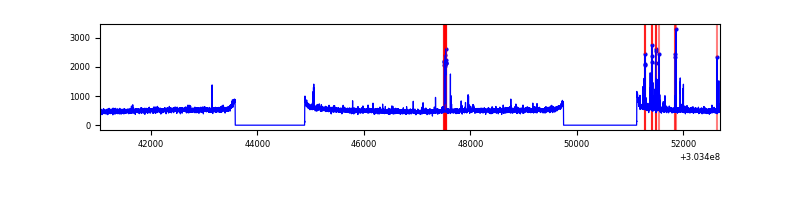 |
| B | 11641 | 8963 | 22 | 22 | 0.19% | 0.25% | 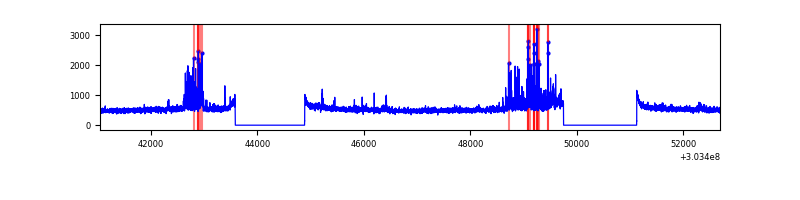 |
| C | 11641 | 8963 | 11 | 11 | 0.09% | 0.12% | 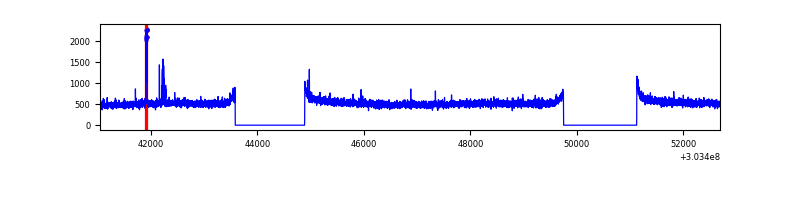 |
| D | 11641 | 8963 | 191 | 191 | 1.64% | 2.13% | 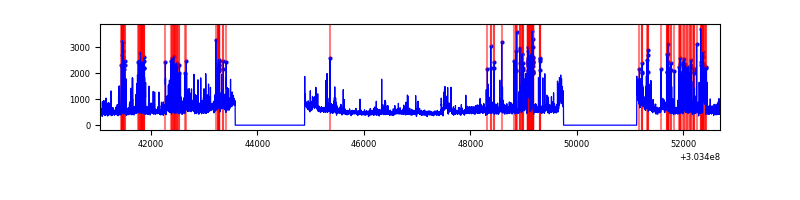 |
Top three noisy pixels from each quadrant. If the there are fewer than three noisy pixels in the level2.evt file, extra rows are filled as -1
| Pixel properties | Quadrant properties | ||||||
|---|---|---|---|---|---|---|---|
| Quadrant | DetID | PixID | Counts | Sigma | Mean | Median | Sigma |
| A | 5 | 16 | 168539 | 701.54 | 1196 | 1172 | 238.6 |
| A | 0 | 226 | 10311 | 38.31 | 1196 | 1172 | 238.6 |
| A | 3 | 137 | 9162 | 33.49 | 1196 | 1172 | 238.6 |
| B | 7 | 220 | 302200 | 1355.54 | 1202 | 1178 | 222.1 |
| B | 4 | 216 | 68421 | 302.8 | 1202 | 1178 | 222.1 |
| B | 0 | 190 | 31539 | 136.72 | 1202 | 1178 | 222.1 |
| C | 14 | 238 | 184129 | 687.65 | 1157 | 1169 | 266.1 |
| C | 9 | 54 | 74036 | 273.87 | 1157 | 1169 | 266.1 |
| C | 7 | 247 | 9836 | 32.57 | 1157 | 1169 | 266.1 |
| D | 5 | 222 | 685579 | 2440.17 | 1155 | 1123 | 280.5 |
| D | 1 | 52 | 492979 | 1753.53 | 1155 | 1123 | 280.5 |
| D | 9 | 1 | 445966 | 1585.92 | 1155 | 1123 | 280.5 |
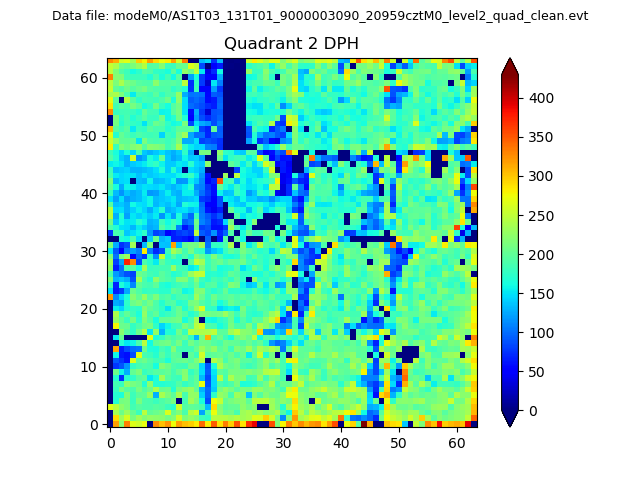
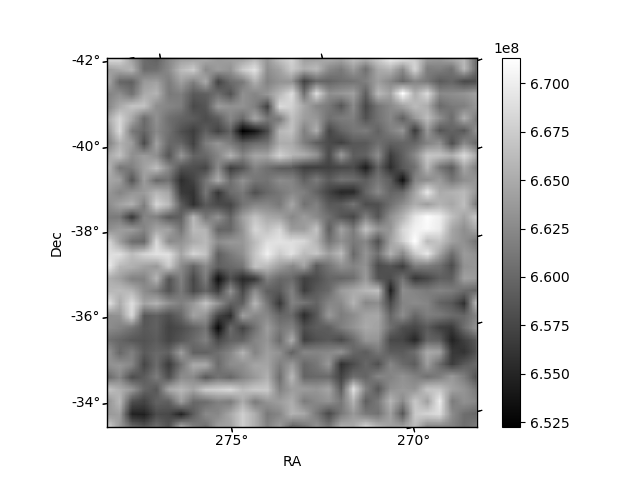
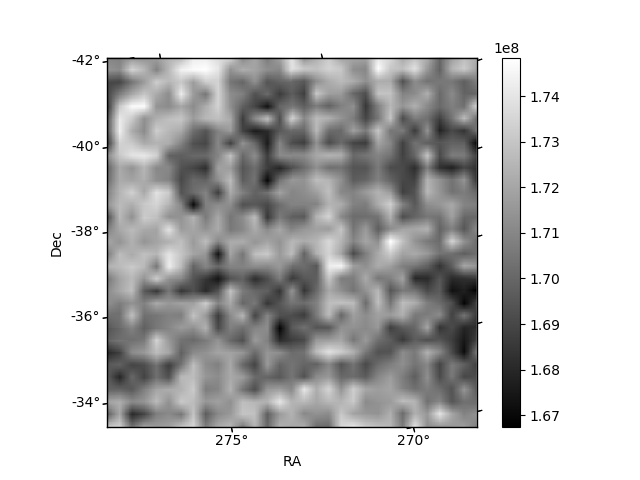
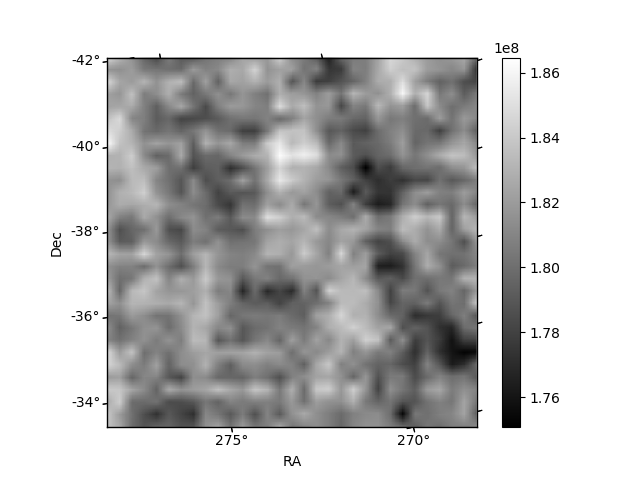
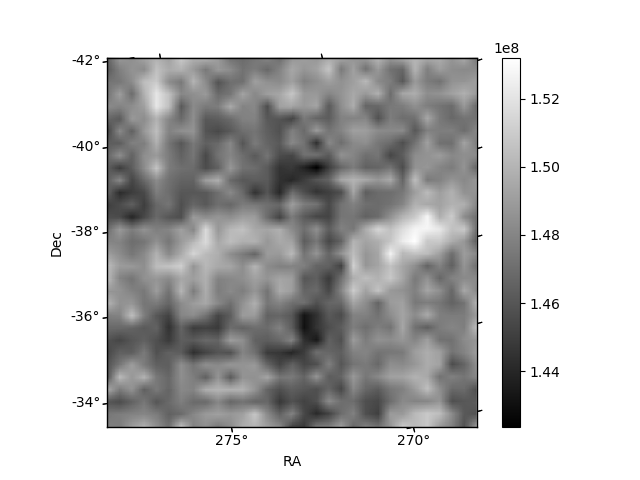
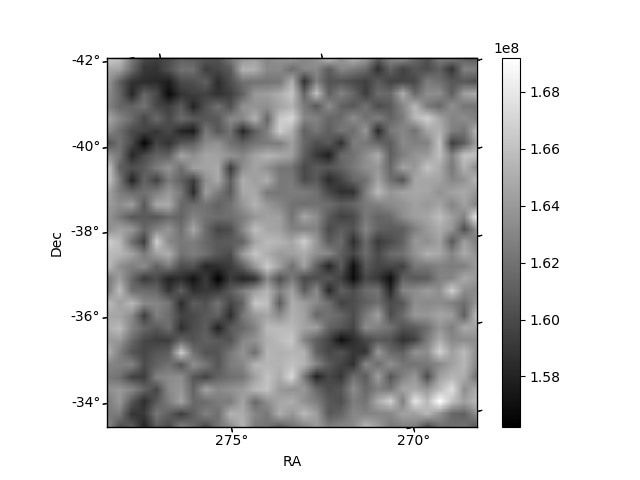
Histogram calculated using DETX and DETY for each event in the final _common_clean file
| Quadrant A | 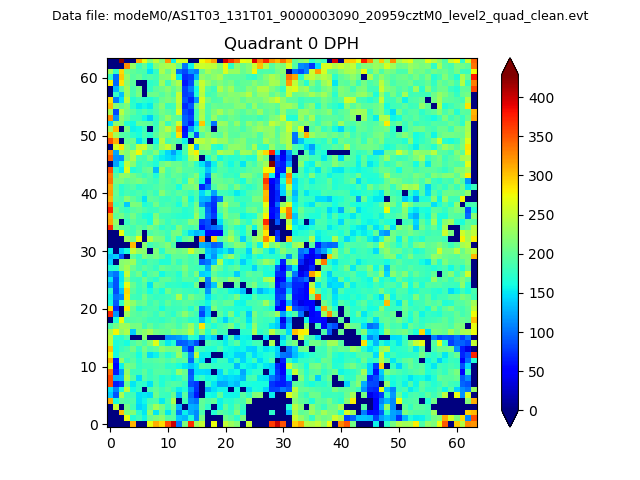 |
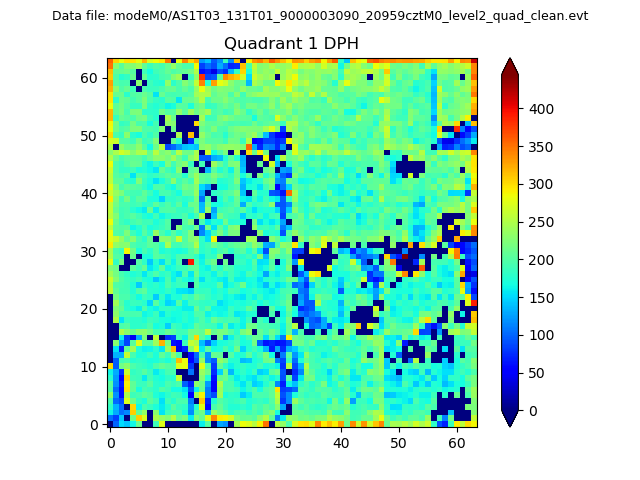 |
Quadrant B |
|---|---|---|---|
| Quadrant D | 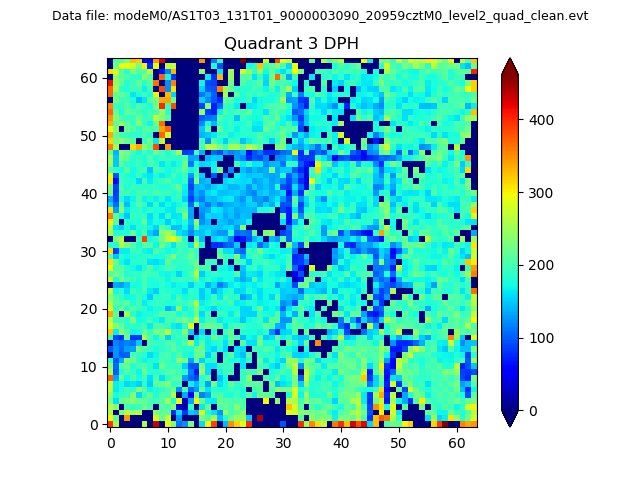 |
 |
Quadrant C |
| Plot type | Count rate plots | Images |
|---|---|---|
| Comparison with Poisson distribution Blue bars denote a histogram of data divided into 1 sec bins. Red curve is a Poisson curve with rate = median count rate of data. |
 |
 |
| Quadrant-wise count rates Data is divided into 100 sec bins |
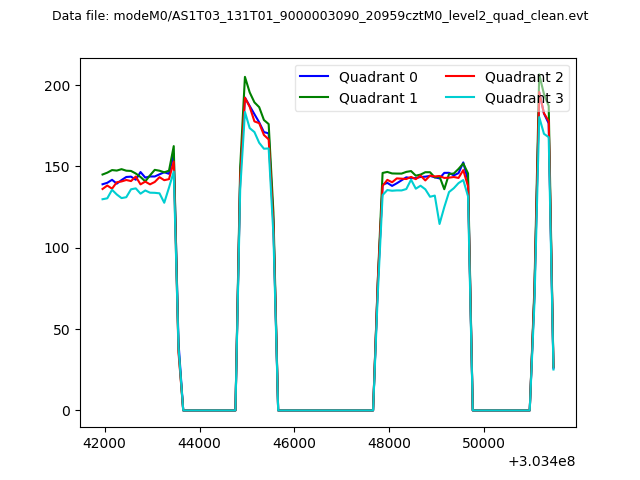 |
|
| Module-wise count rates for Quadrant A Data is divided into 100 sec bins |
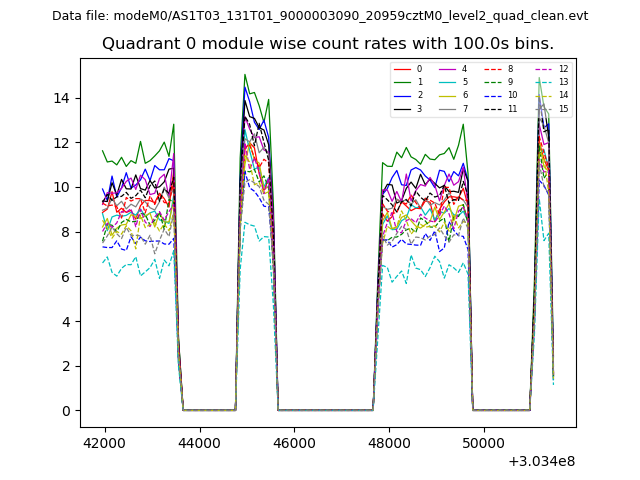 |
 |
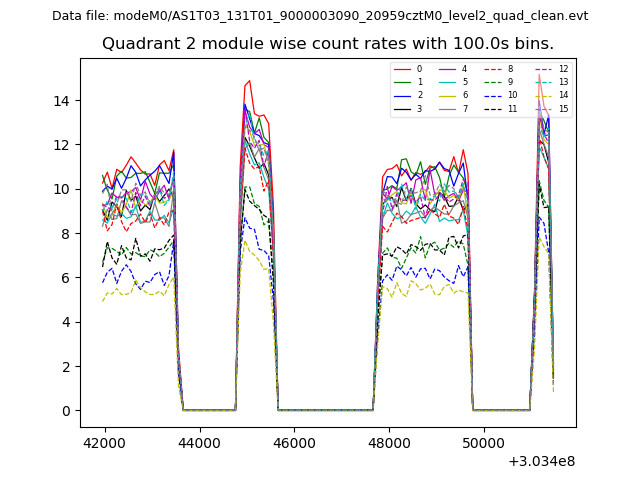
| Module-wise count rates for Quadrant B Data is divided into 100 sec bins |
 |
 |
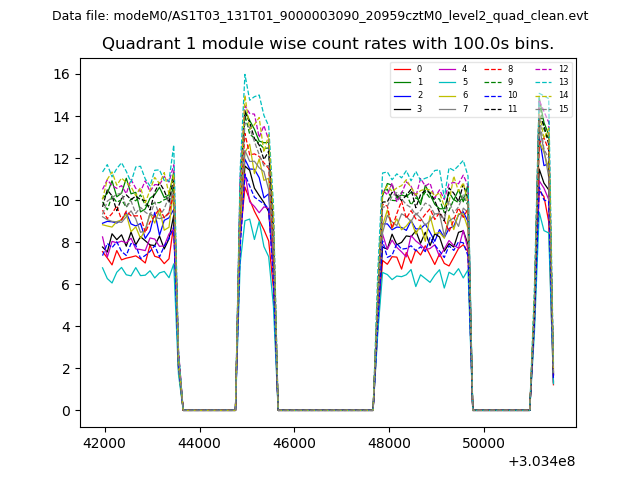
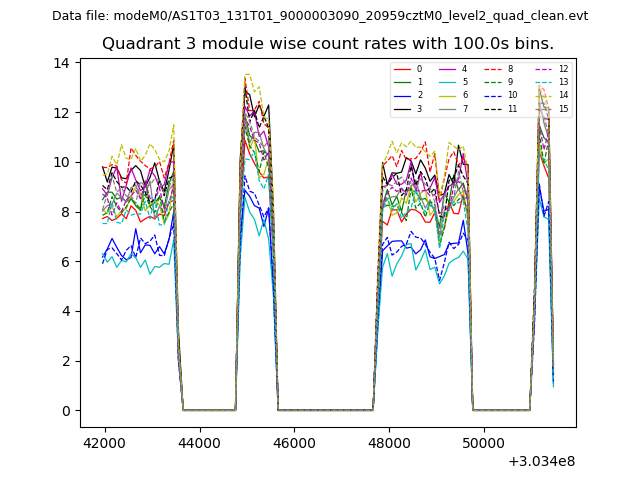
| Module-wise count rates for Quadrant C Data is divided into 100 sec bins |
 |
 |
| Module-wise count rates for Quadrant D Data is divided into 100 sec bins |
 |
 |
| Parameter | Plot |
|---|---|
| CZT HV Monitor | 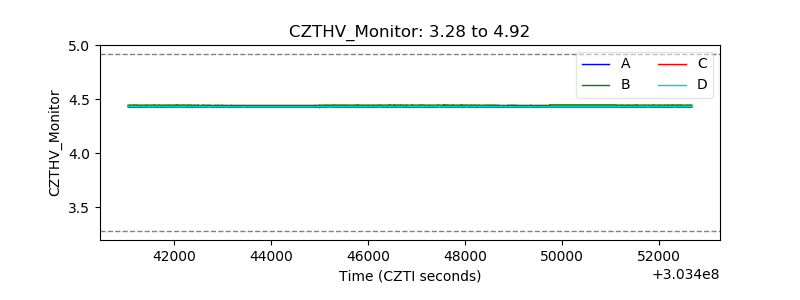 |
| D_VDD | 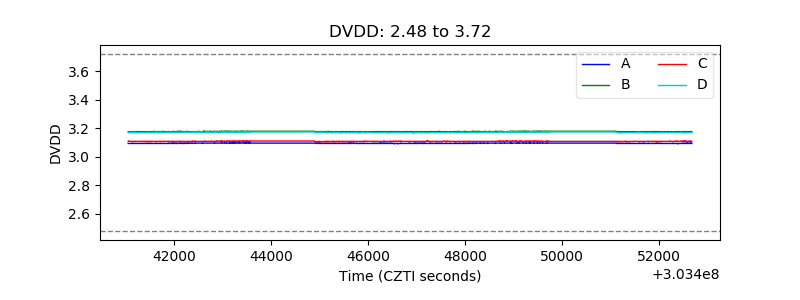 |
| Temperature 1 | 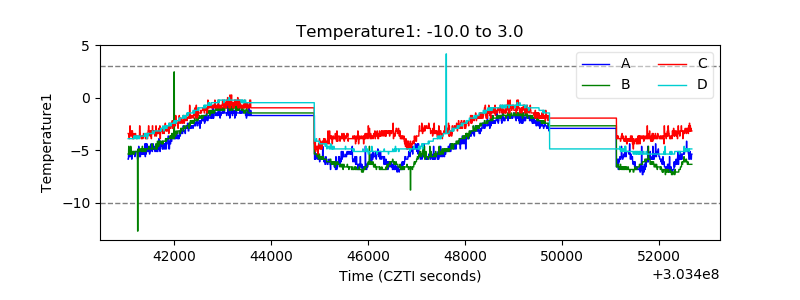 |
| Veto HV Monitor | 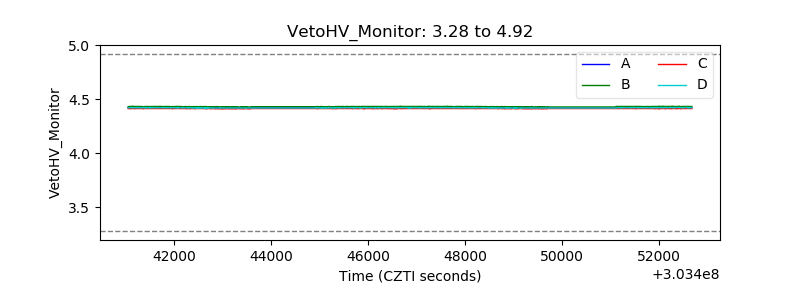 |
| Veto LLD | 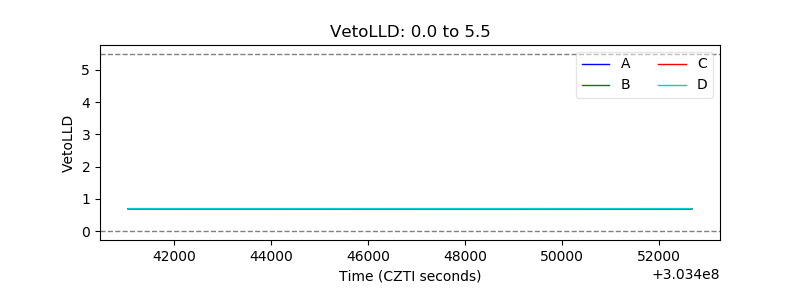 |
| Alpha Counter | 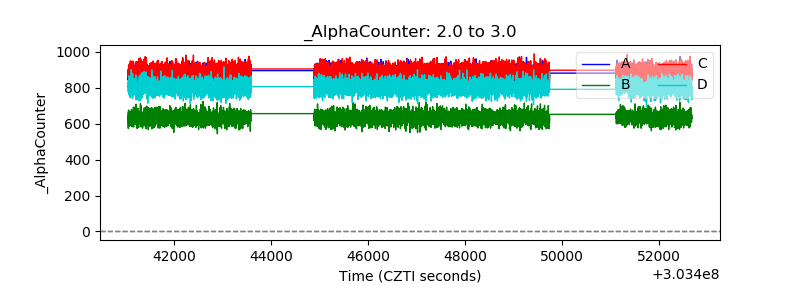 |
| _CPM_Rate | 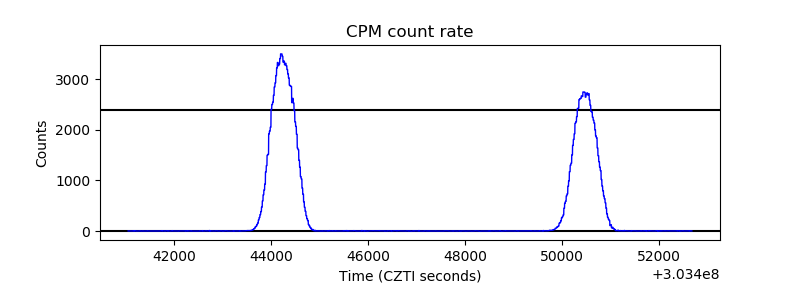 |
| CZT Counter | 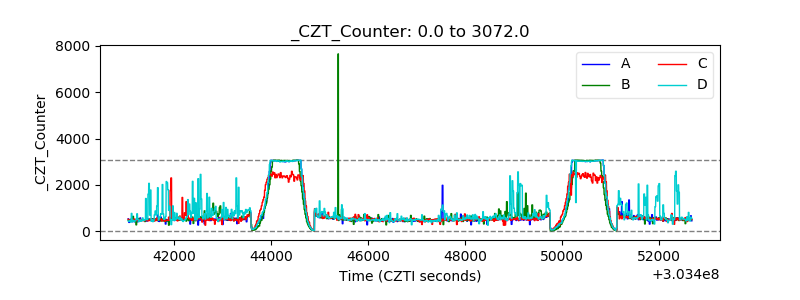 |
| +2.5 Volts monitor | 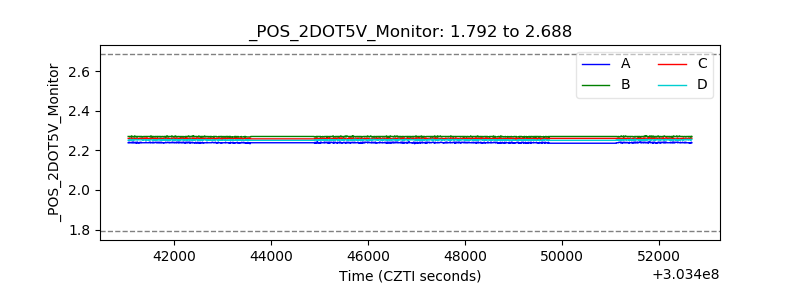 |
| +5 Volts monitor |  |
| _ROLL_ROT | 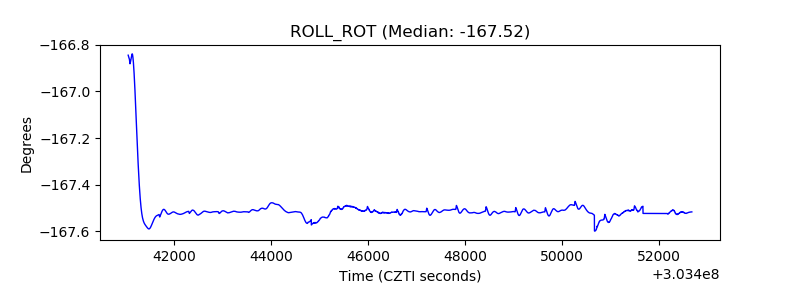 |
| _Roll_DEC | 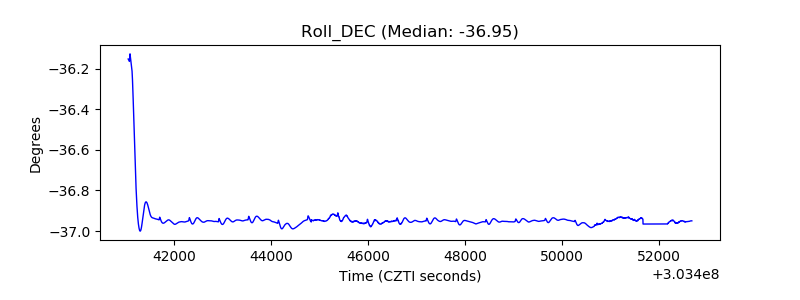 |
| _Roll_RA | 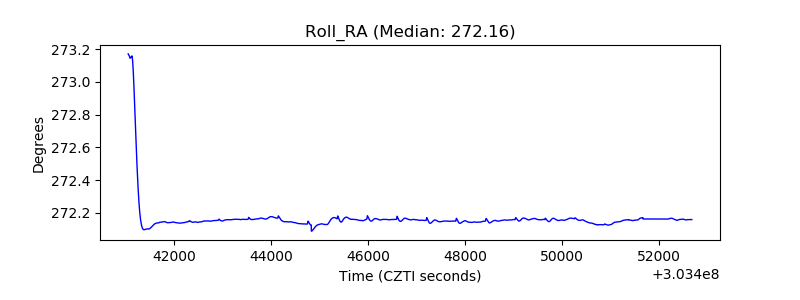 |
| Veto Counter | 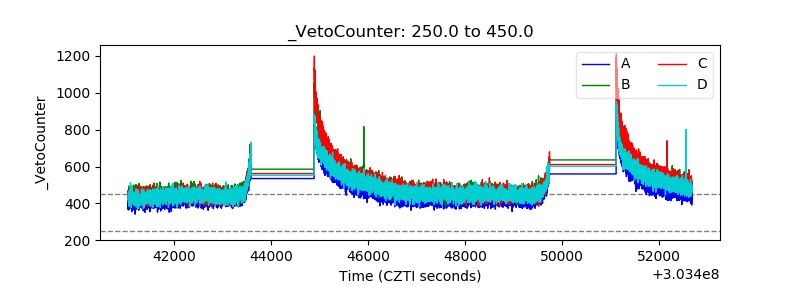 |