| Param | Original file | Final file |
|---|---|---|
| Filename | modeM0/AS1T03_131T01_9000003090_20960cztM0_level2.evt | modeM0/AS1T03_131T01_9000003090_20960cztM0_level2_quad_clean.evt |
| Size (bytes) | 513,720,000 | 67,939,200 |
| Size | 489.9 MB | 64.8 MB |
| Events in quadrant A | 3,484,532 | 406,078 |
| Events in quadrant B | 3,560,771 | 416,273 |
| Events in quadrant C | 3,406,152 | 405,198 |
| Events in quadrant D | 4,671,786 | 382,034 |
| Mode SS | |||
|---|---|---|---|
| Quadrant | BADHDUFLAG | Total packets | Discarded packets |
| A | 0 | 132 | 0 |
| B | 0 | 132 | 0 |
| C | 0 | 132 | 0 |
| D | 0 | 132 | 0 |
| Mode M9 | |||
|---|---|---|---|
| Quadrant | BADHDUFLAG | Total packets | Discarded packets |
| A | 0 | 20 | 0 |
| B | 0 | 21 | 0 |
| C | 0 | 21 | 0 |
| D | 0 | 21 | 0 |
| Mode M0 | |||
|---|---|---|---|
| Quadrant | BADHDUFLAG | Total packets | Discarded packets |
| A | 0 | 14043 | 2 |
| B | 0 | 14278 | 2 |
| C | 0 | 13665 | 2 |
| D | 0 | 17986 | 2 |
| Quadrant | Total seconds | Saturated seconds | Saturation percentage |
|---|---|---|---|
| A | 6408 | 51 | 0.795880% |
| B | 6408 | 58 | 0.905119% |
| C | 6408 | 69 | 1.076779% |
| D | 6408 | 224 | 3.495630% |
Noise dominated data is calculated using 1-second bins in cleaned event files. If a bin has >2000 counts, and if more than 50% of those come from <1% of pixels, then it is considered to be noise-dominated and hence unusable.
| Quadrant | # 1 sec bins | Bins with >0 counts | Bins with >2000 counts | High rate bins dominated by noise | Noise dominated (total time) | Noise dominated (detector-on time) | Marked lightcurve |
|---|---|---|---|---|---|---|---|
| A | 7768 | 6409 | 28 | 28 | 0.36% | 0.44% | 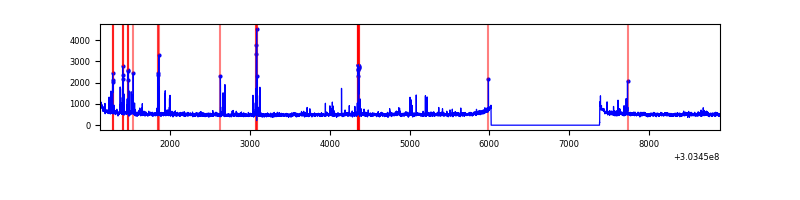 |
| B | 7768 | 6409 | 13 | 13 | 0.17% | 0.20% |  |
| C | 7768 | 6409 | 1 | 1 | 0.01% | 0.02% | 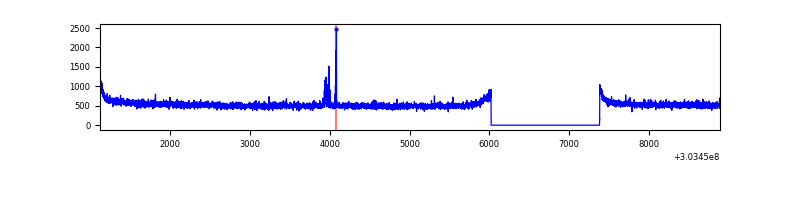 |
| D | 7768 | 6409 | 168 | 168 | 2.16% | 2.62% | 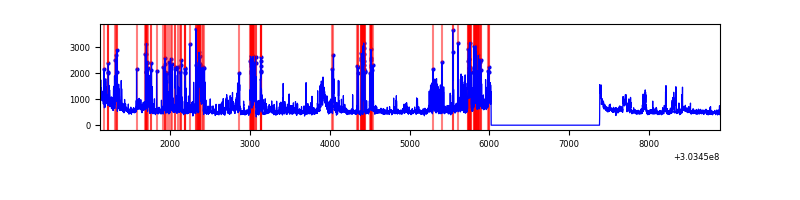 |
Top three noisy pixels from each quadrant. If the there are fewer than three noisy pixels in the level2.evt file, extra rows are filled as -1
| Pixel properties | Quadrant properties | ||||||
|---|---|---|---|---|---|---|---|
| Quadrant | DetID | PixID | Counts | Sigma | Mean | Median | Sigma |
| A | 5 | 16 | 204635 | 1205.09 | 850 | 834 | 169.1 |
| A | 6 | 16 | 12018 | 66.13 | 850 | 834 | 169.1 |
| A | 0 | 226 | 7619 | 40.12 | 850 | 834 | 169.1 |
| B | 7 | 220 | 134254 | 840.91 | 856 | 839 | 158.7 |
| B | 3 | 64 | 23689 | 144.02 | 856 | 839 | 158.7 |
| B | 0 | 190 | 19046 | 114.76 | 856 | 839 | 158.7 |
| C | 14 | 238 | 131993 | 684.27 | 831 | 840 | 191.7 |
| C | 0 | 79 | 30278 | 153.59 | 831 | 840 | 191.7 |
| C | 13 | 61 | 5818 | 25.97 | 831 | 840 | 191.7 |
| D | 1 | 52 | 622738 | 3126.52 | 826 | 803 | 198.9 |
| D | 9 | 1 | 450591 | 2261.12 | 826 | 803 | 198.9 |
| D | 5 | 222 | 269014 | 1348.32 | 826 | 803 | 198.9 |
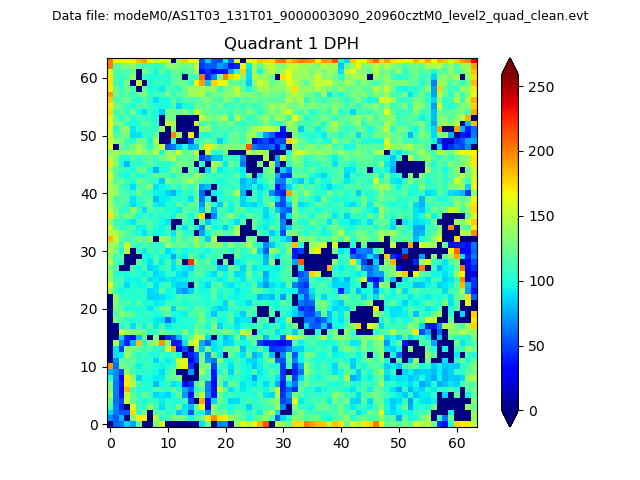
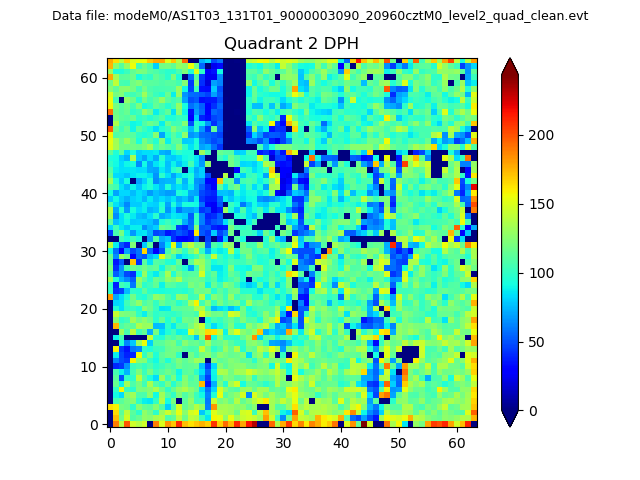
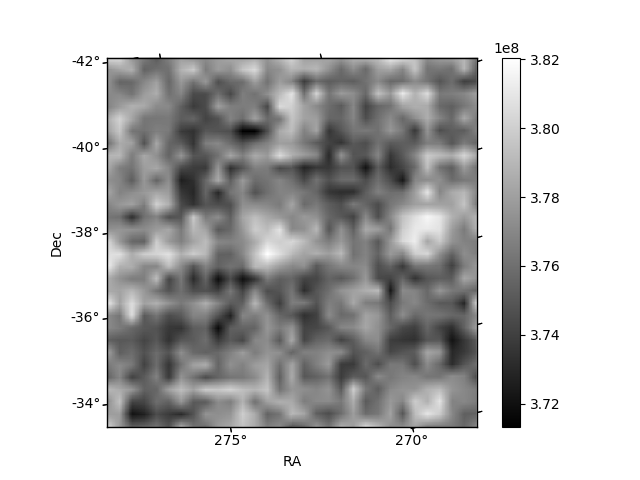
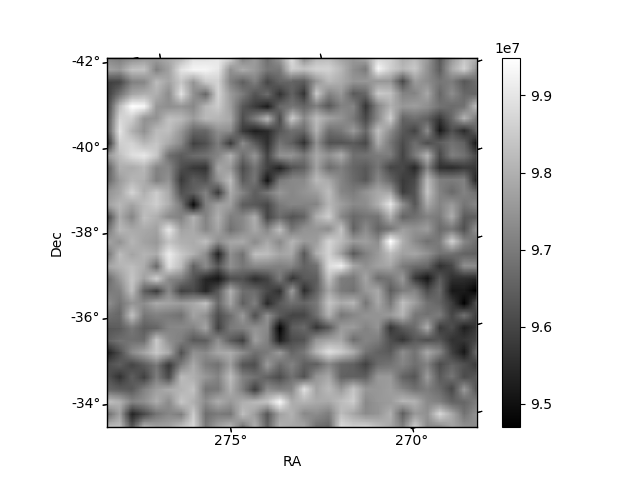
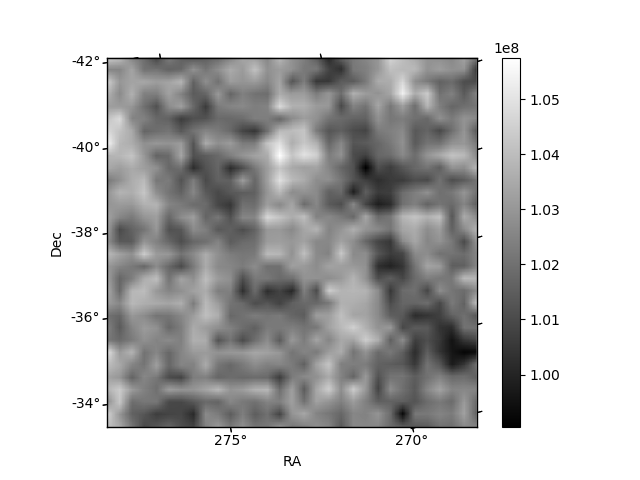
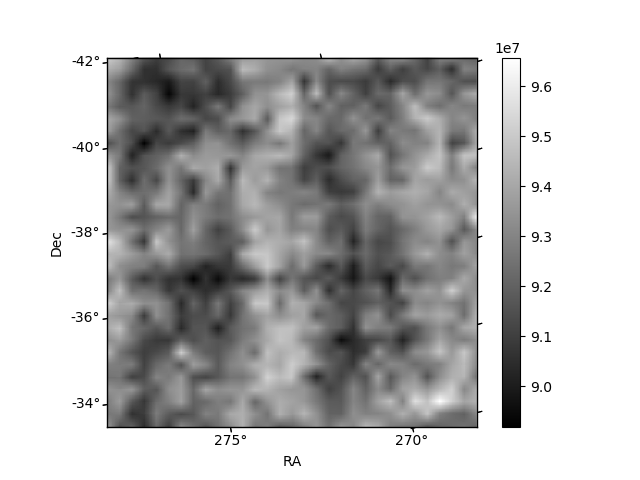
Histogram calculated using DETX and DETY for each event in the final _common_clean file
| Quadrant A | 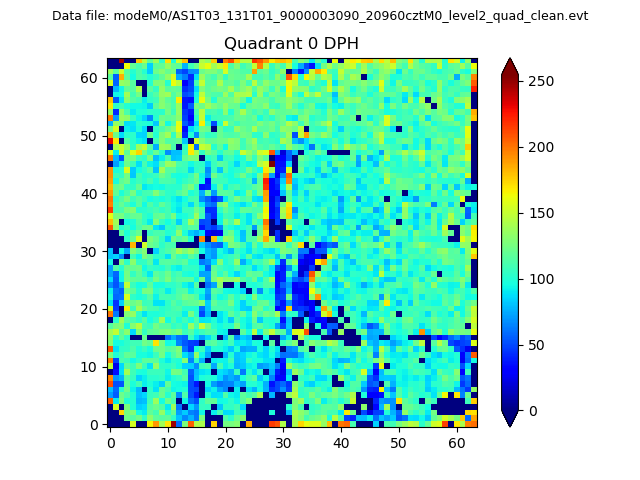 |
 |
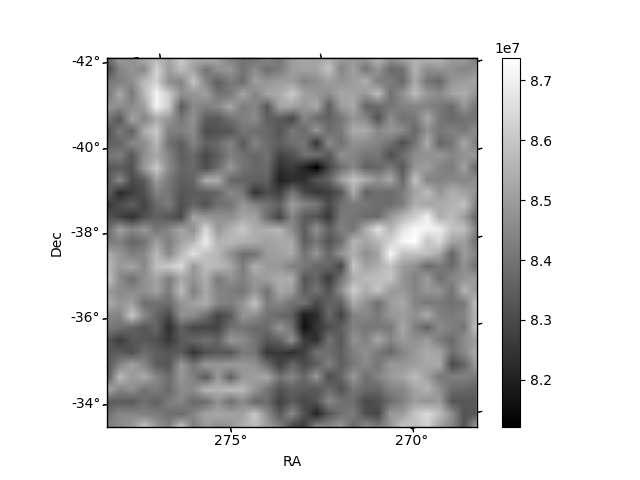
Quadrant B |
|---|---|---|---|
| Quadrant D | 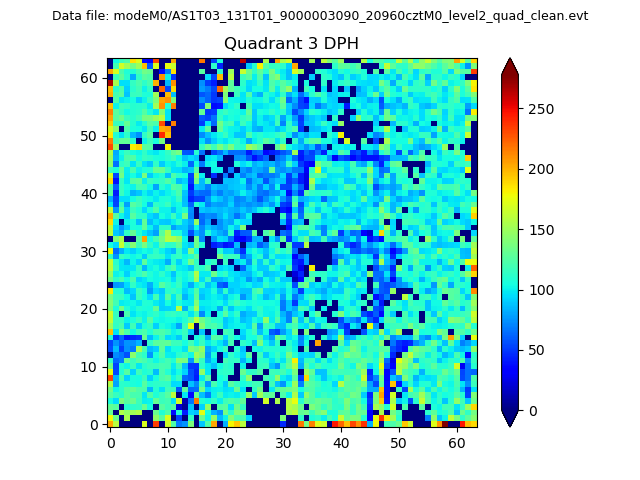 |
 |
Quadrant C |
| Plot type | Count rate plots | Images |
|---|---|---|
| Comparison with Poisson distribution Blue bars denote a histogram of data divided into 1 sec bins. Red curve is a Poisson curve with rate = median count rate of data. |
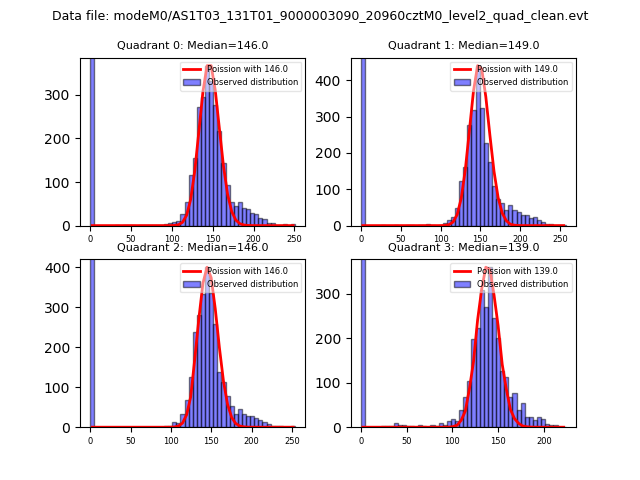 |
 |
| Quadrant-wise count rates Data is divided into 100 sec bins |
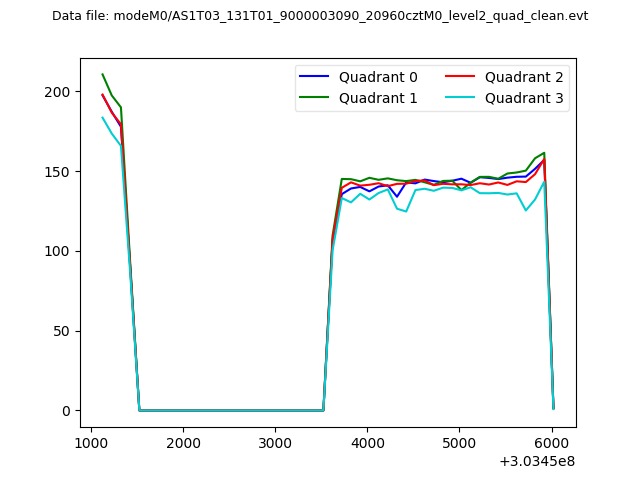 |
|
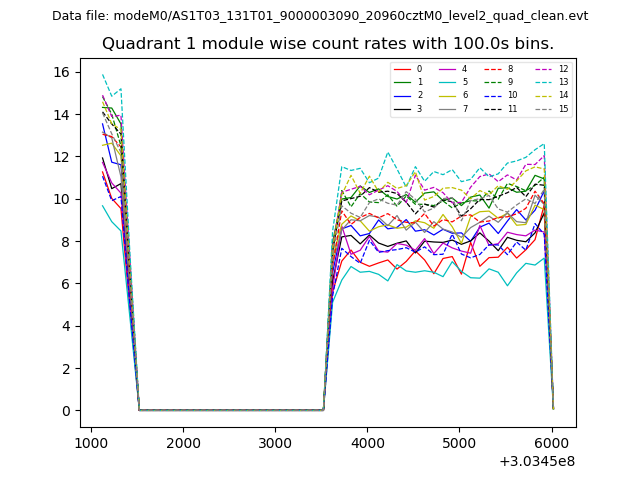
| Module-wise count rates for Quadrant A Data is divided into 100 sec bins |
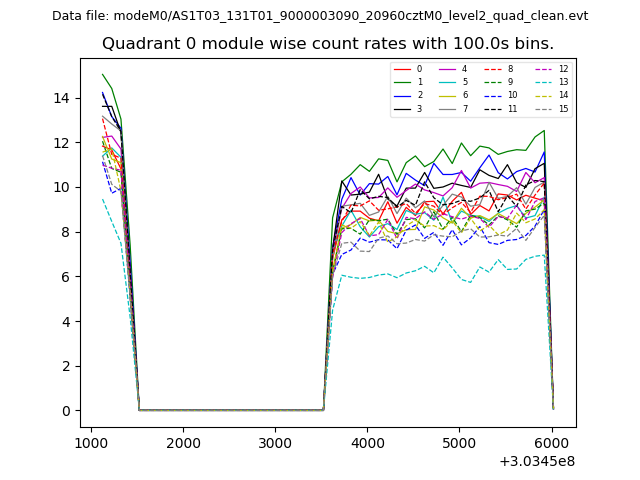 |
 |
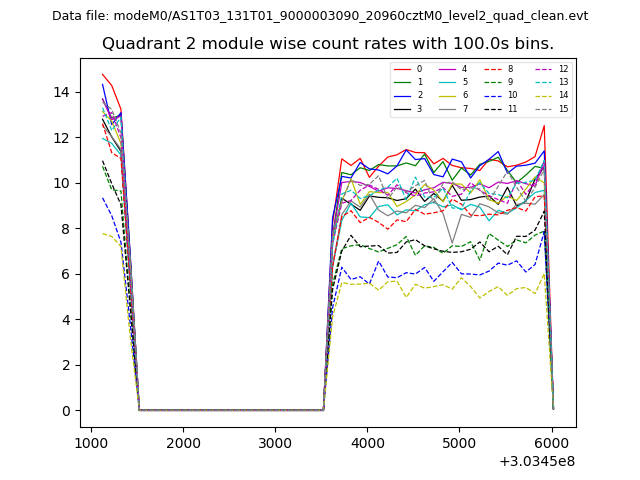
| Module-wise count rates for Quadrant B Data is divided into 100 sec bins |
 |
 |
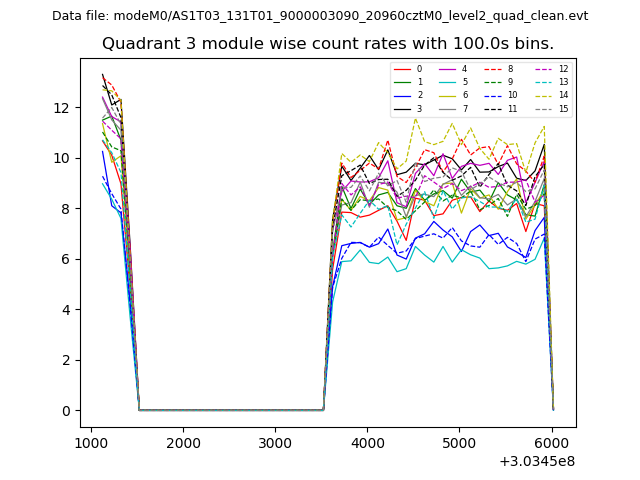
| Module-wise count rates for Quadrant C Data is divided into 100 sec bins |
 |
 |
| Module-wise count rates for Quadrant D Data is divided into 100 sec bins |
 |
 |
| Parameter | Plot |
|---|---|
| CZT HV Monitor | 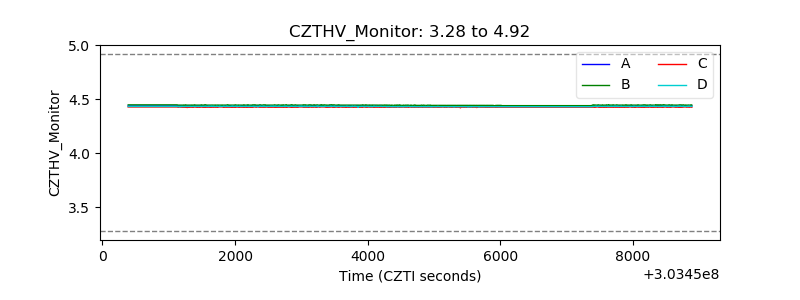 |
| D_VDD | 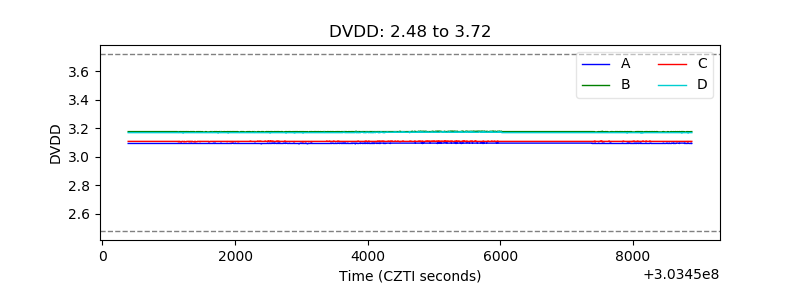 |
| Temperature 1 | 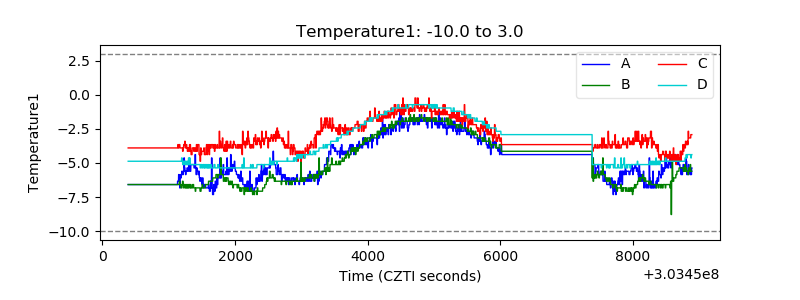 |
| Veto HV Monitor | 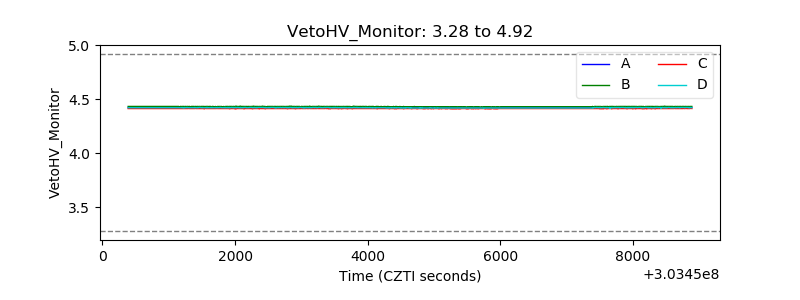 |
| Veto LLD | 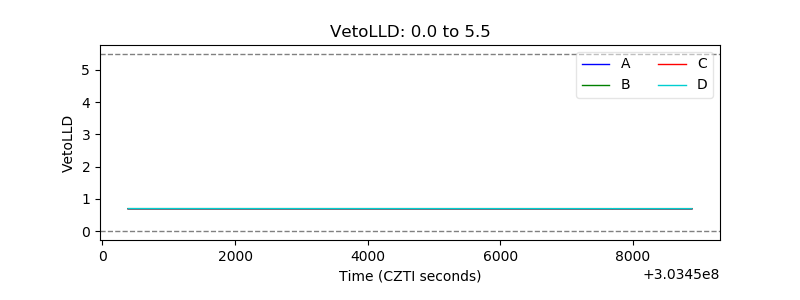 |
| Alpha Counter | 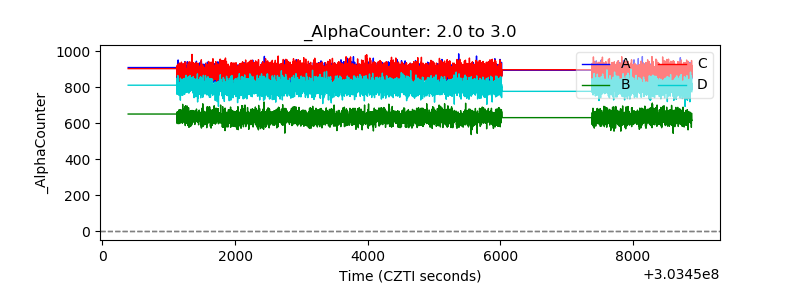 |
| _CPM_Rate | 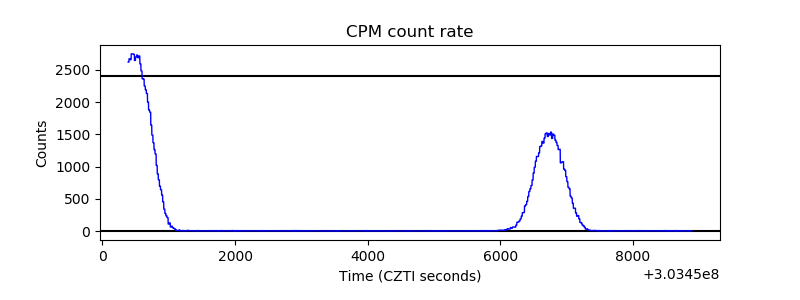 |
| CZT Counter | 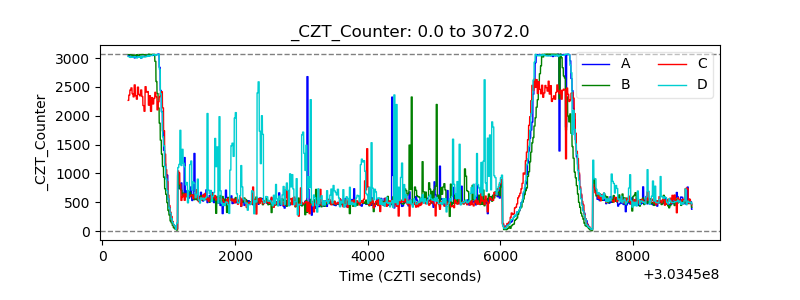 |
| +2.5 Volts monitor | 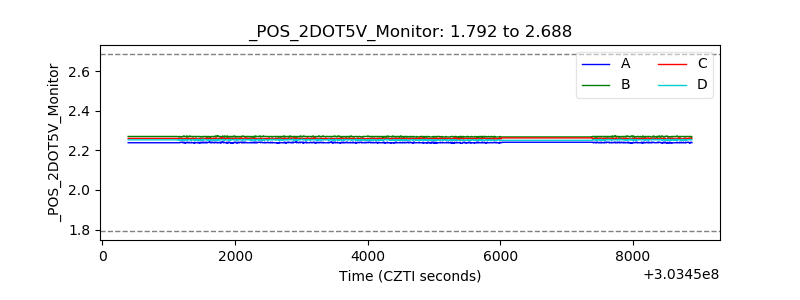 |
| +5 Volts monitor |  |
| _ROLL_ROT | 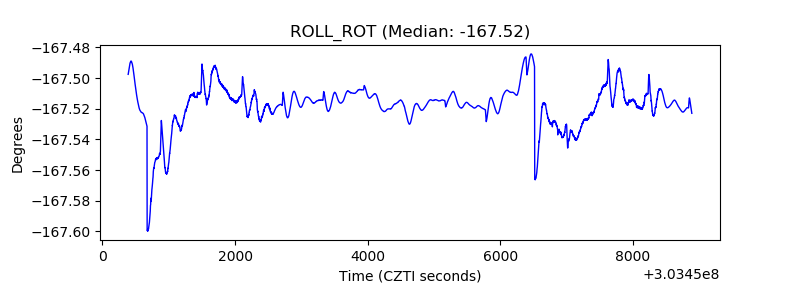 |
| _Roll_DEC | 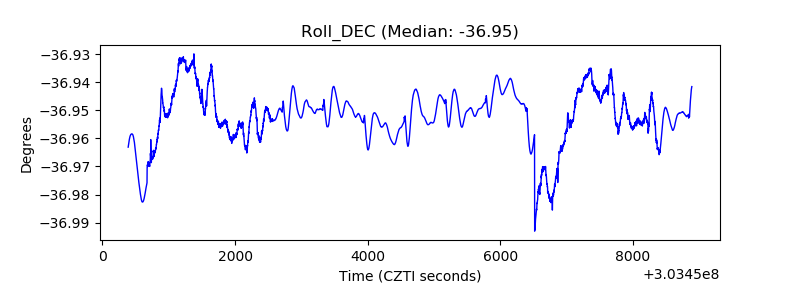 |
| _Roll_RA | 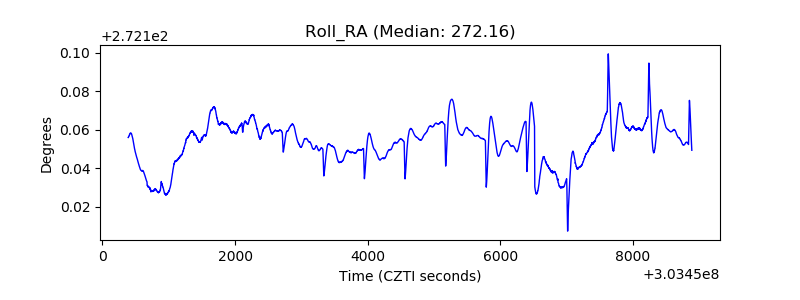 |
| Veto Counter | 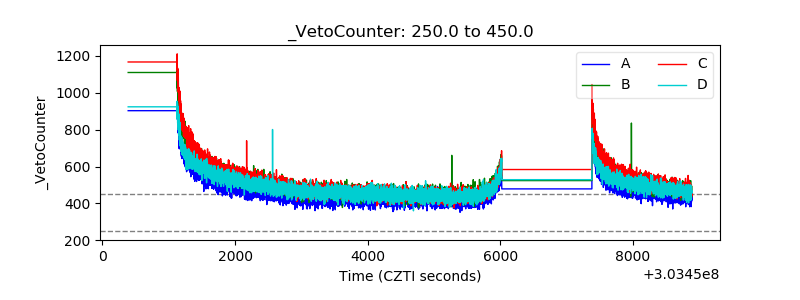 |