| Param | Original file | Final file |
|---|---|---|
| Filename | modeM0/AS1T03_131T01_9000003090_20961cztM0_level2.evt | modeM0/AS1T03_131T01_9000003090_20961cztM0_level2_quad_clean.evt |
| Size (bytes) | 504,956,160 | 69,410,880 |
| Size | 481.6 MB | 66.2 MB |
| Events in quadrant A | 3,277,697 | 419,451 |
| Events in quadrant B | 3,559,840 | 423,343 |
| Events in quadrant C | 3,313,206 | 416,283 |
| Events in quadrant D | 4,705,603 | 393,822 |
| Mode SS | |||
|---|---|---|---|
| Quadrant | BADHDUFLAG | Total packets | Discarded packets |
| A | 0 | 132 | 0 |
| B | 0 | 132 | 0 |
| C | 0 | 132 | 0 |
| D | 0 | 132 | 0 |
| Mode M9 | |||
|---|---|---|---|
| Quadrant | BADHDUFLAG | Total packets | Discarded packets |
| A | 0 | 18 | 0 |
| B | 0 | 19 | 0 |
| C | 0 | 19 | 0 |
| D | 0 | 19 | 0 |
| Mode M0 | |||
|---|---|---|---|
| Quadrant | BADHDUFLAG | Total packets | Discarded packets |
| A | 0 | 13496 | 2 |
| B | 0 | 14325 | 2 |
| C | 0 | 13435 | 2 |
| D | 0 | 18191 | 3 |
| Quadrant | Total seconds | Saturated seconds | Saturation percentage |
|---|---|---|---|
| A | 6426 | 67 | 1.042639% |
| B | 6426 | 148 | 2.303143% |
| C | 6426 | 121 | 1.882975% |
| D | 6425 | 240 | 3.735409% |
Noise dominated data is calculated using 1-second bins in cleaned event files. If a bin has >2000 counts, and if more than 50% of those come from <1% of pixels, then it is considered to be noise-dominated and hence unusable.
| Quadrant | # 1 sec bins | Bins with >0 counts | Bins with >2000 counts | High rate bins dominated by noise | Noise dominated (total time) | Noise dominated (detector-on time) | Marked lightcurve |
|---|---|---|---|---|---|---|---|
| A | 7546 | 6427 | 2 | 2 | 0.03% | 0.03% | 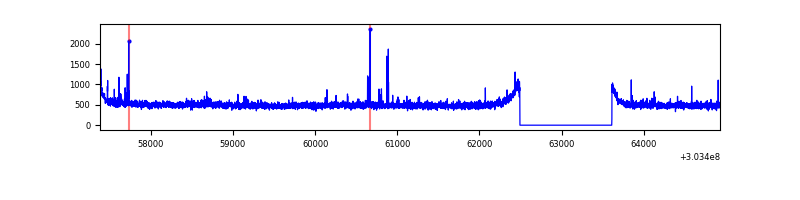 |
| B | 7546 | 6427 | 41 | 41 | 0.54% | 0.64% | 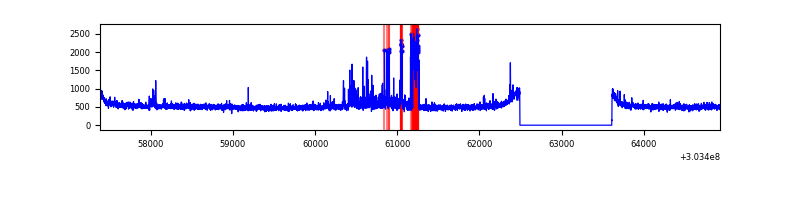 |
| C | 7546 | 6427 | 0 | 0 | 0.00% | 0.00% | 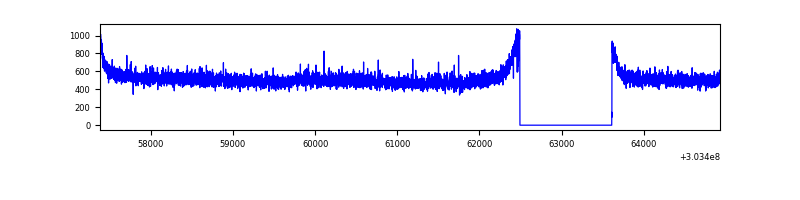 |
| D | 7545 | 6426 | 175 | 175 | 2.32% | 2.72% | 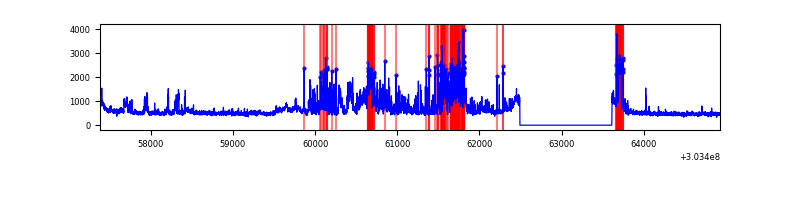 |
Top three noisy pixels from each quadrant. If the there are fewer than three noisy pixels in the level2.evt file, extra rows are filled as -1
| Pixel properties | Quadrant properties | ||||||
|---|---|---|---|---|---|---|---|
| Quadrant | DetID | PixID | Counts | Sigma | Mean | Median | Sigma |
| A | 5 | 16 | 43465 | 253.34 | 837 | 823 | 168.3 |
| A | 6 | 16 | 20154 | 114.85 | 837 | 823 | 168.3 |
| A | 0 | 226 | 7332 | 38.67 | 837 | 823 | 168.3 |
| B | 7 | 220 | 238872 | 1507.67 | 837 | 816 | 157.9 |
| B | 0 | 245 | 19416 | 117.8 | 837 | 816 | 157.9 |
| B | 0 | 230 | 18432 | 111.57 | 837 | 816 | 157.9 |
| C | 14 | 238 | 128057 | 678.25 | 810 | 818 | 187.6 |
| C | 0 | 79 | 21691 | 111.26 | 810 | 818 | 187.6 |
| C | 7 | 247 | 5949 | 27.35 | 810 | 818 | 187.6 |
| D | 1 | 52 | 991622 | 5069.39 | 809 | 787 | 195.5 |
| D | 1 | 239 | 487157 | 2488.4 | 809 | 787 | 195.5 |
| D | 7 | 223 | 115751 | 588.19 | 809 | 787 | 195.5 |
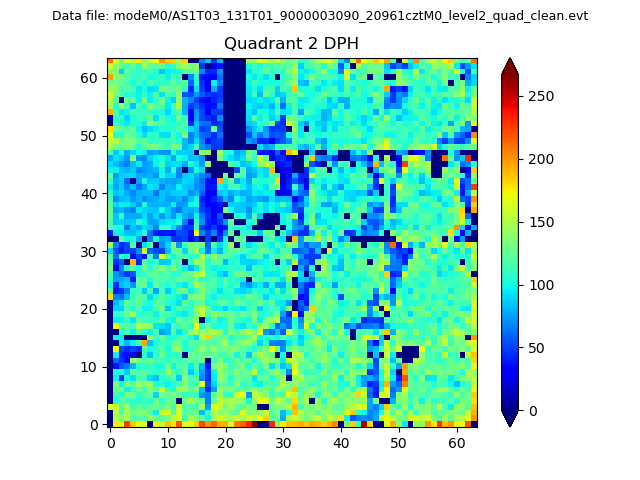
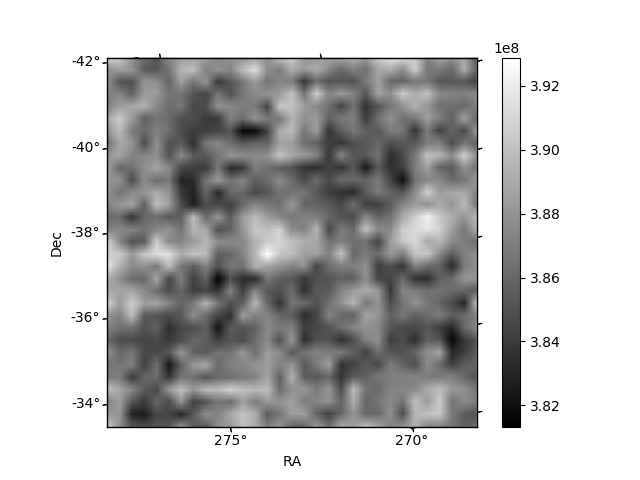
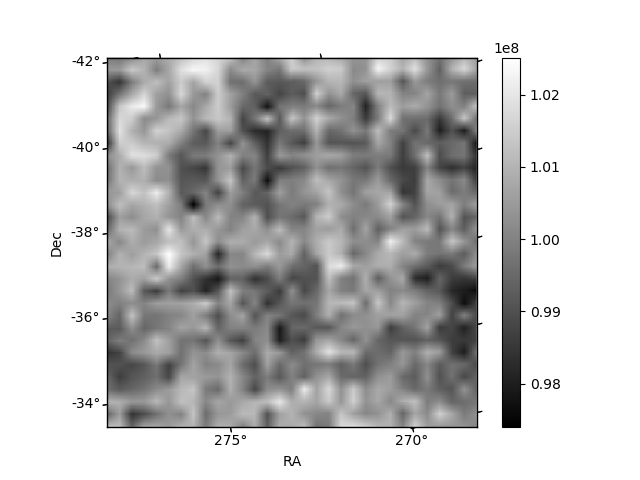
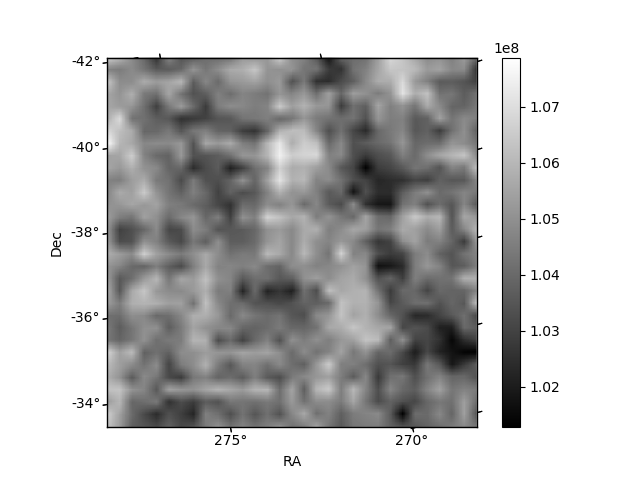
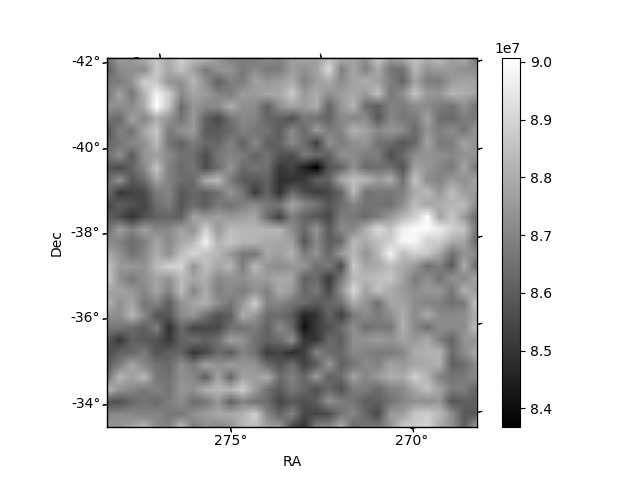
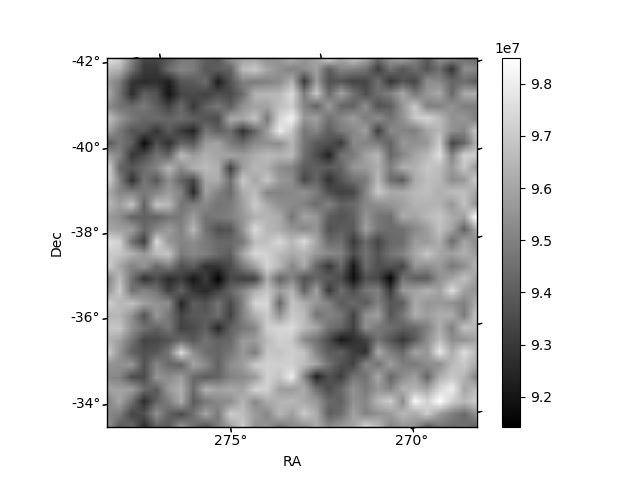
Histogram calculated using DETX and DETY for each event in the final _common_clean file
| Quadrant A | 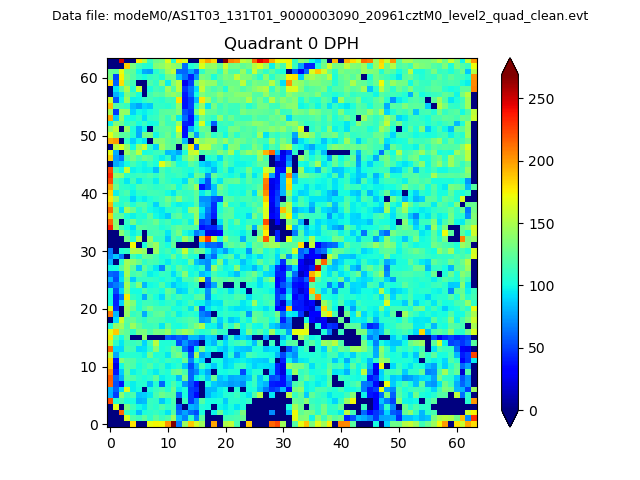 |
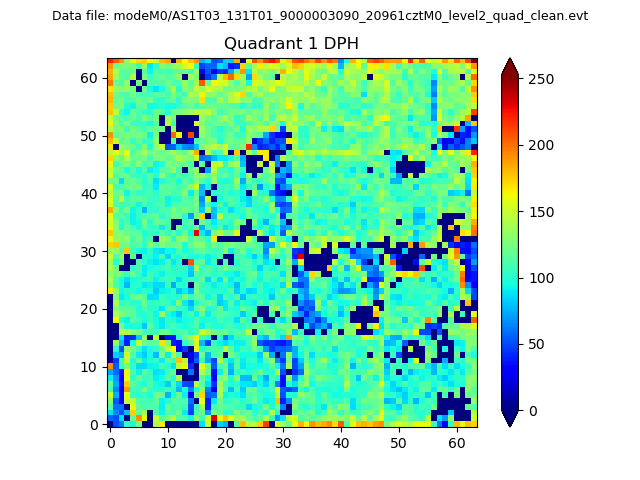 |
Quadrant B |
|---|---|---|---|
| Quadrant D | 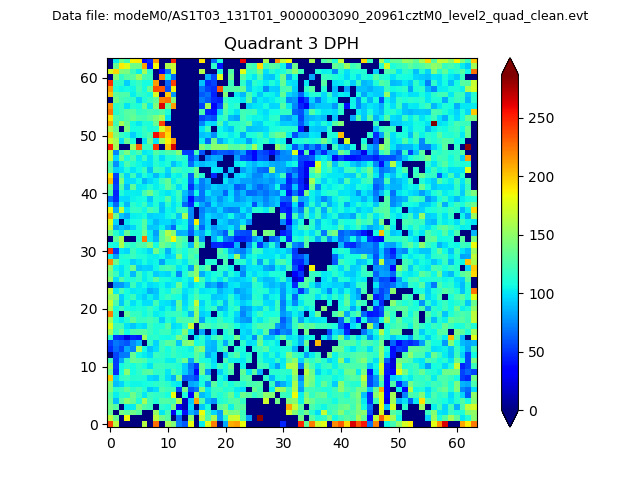 |
 |
Quadrant C |
| Plot type | Count rate plots | Images |
|---|---|---|
| Comparison with Poisson distribution Blue bars denote a histogram of data divided into 1 sec bins. Red curve is a Poisson curve with rate = median count rate of data. |
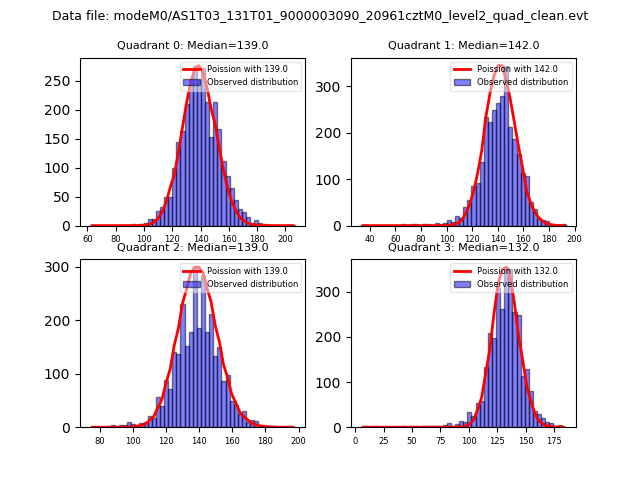 |
 |
| Quadrant-wise count rates Data is divided into 100 sec bins |
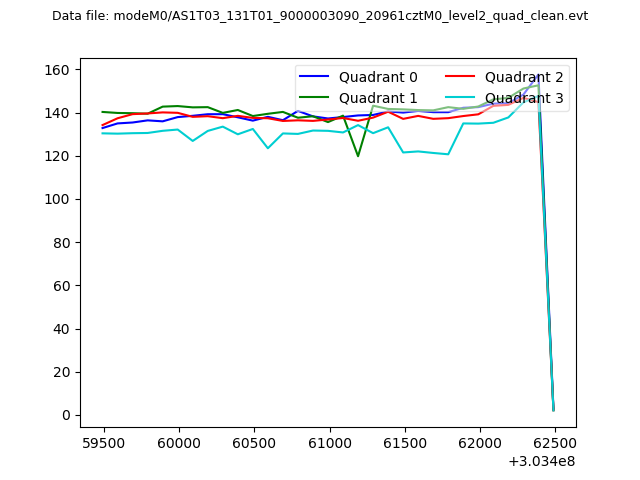 |
|
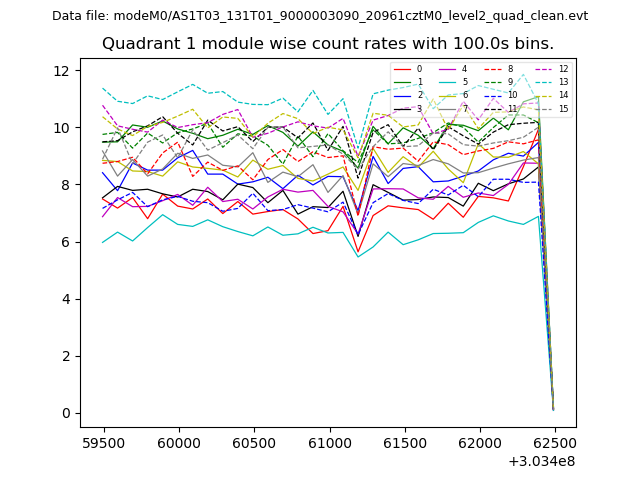
| Module-wise count rates for Quadrant A Data is divided into 100 sec bins |
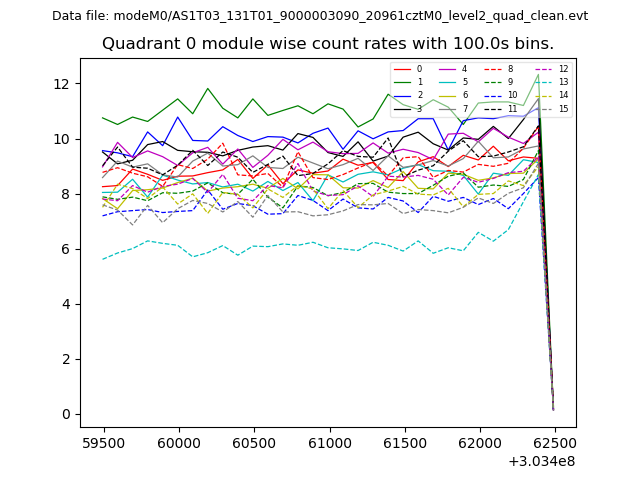 |
 |
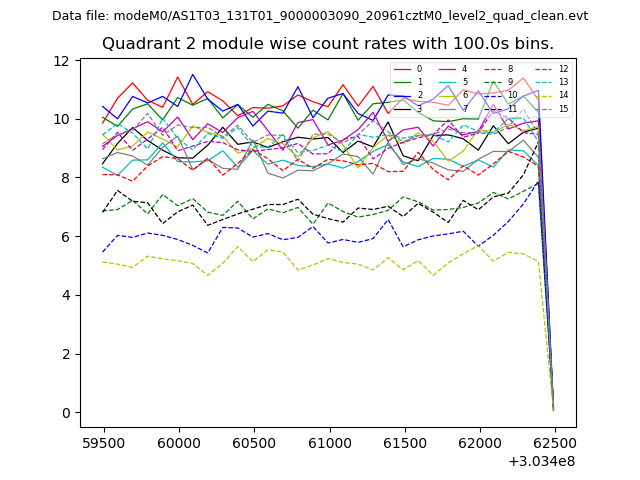
| Module-wise count rates for Quadrant B Data is divided into 100 sec bins |
 |
 |
| Module-wise count rates for Quadrant C Data is divided into 100 sec bins |
 |
 |
| Module-wise count rates for Quadrant D Data is divided into 100 sec bins |
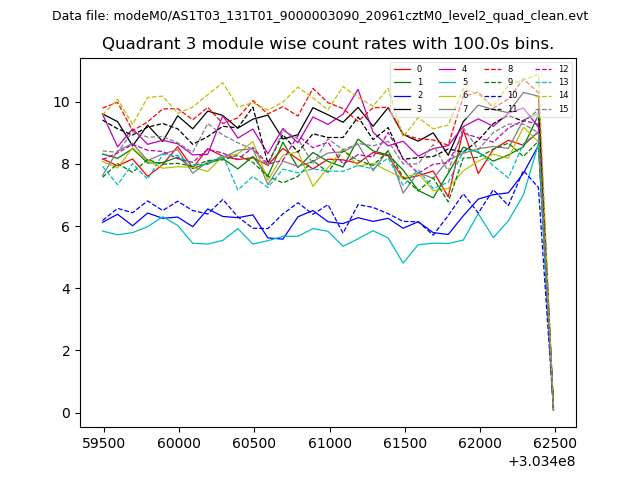 |
 |
| Parameter | Plot |
|---|---|
| CZT HV Monitor | 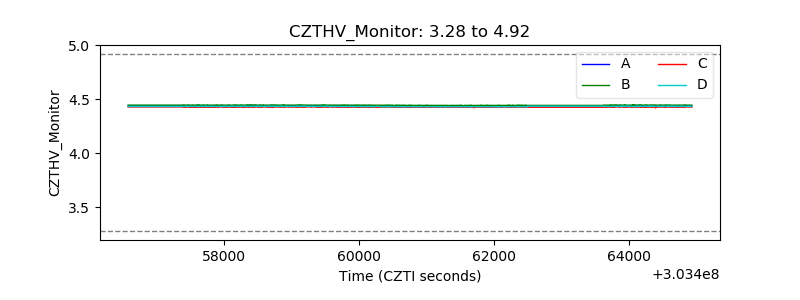 |
| D_VDD | 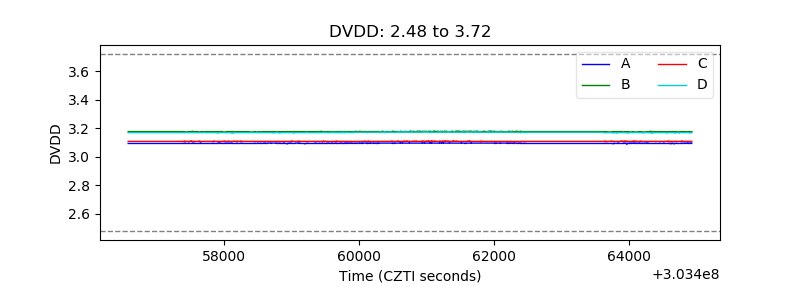 |
| Temperature 1 | 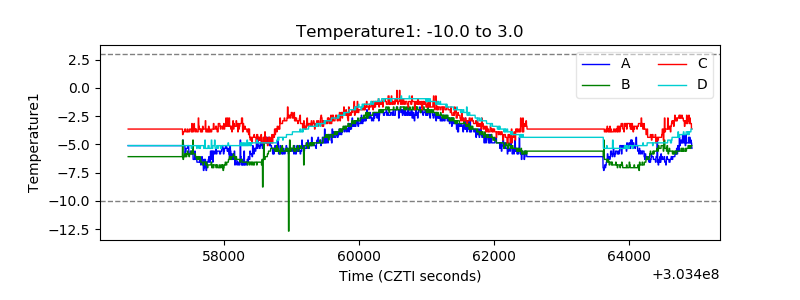 |
| Veto HV Monitor | 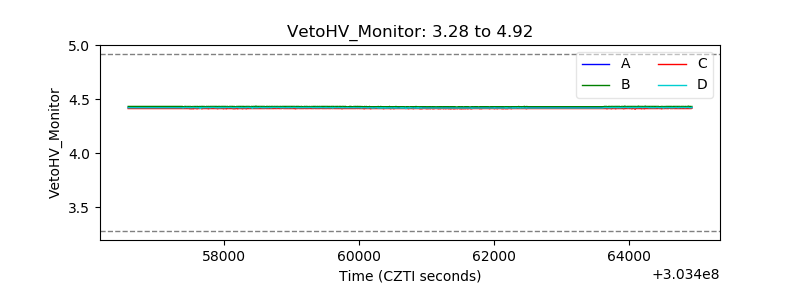 |
| Veto LLD | 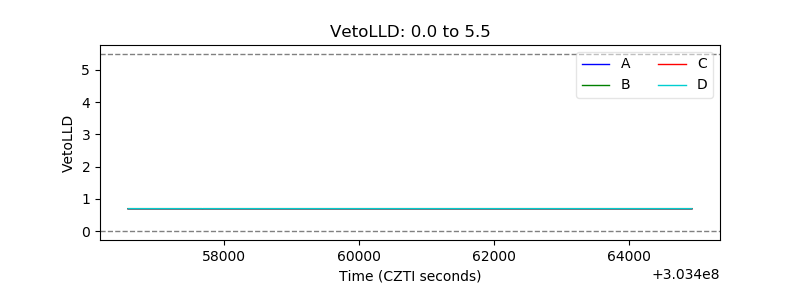 |
| Alpha Counter | 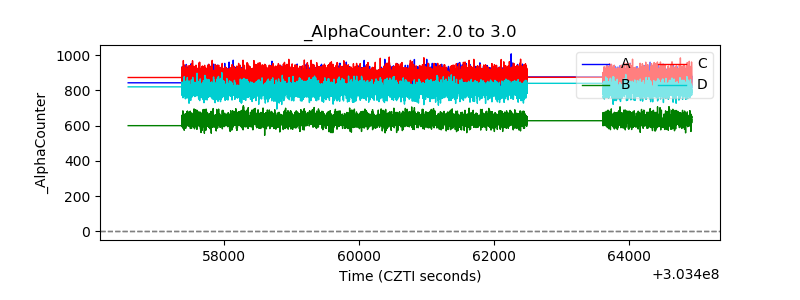 |
| _CPM_Rate | 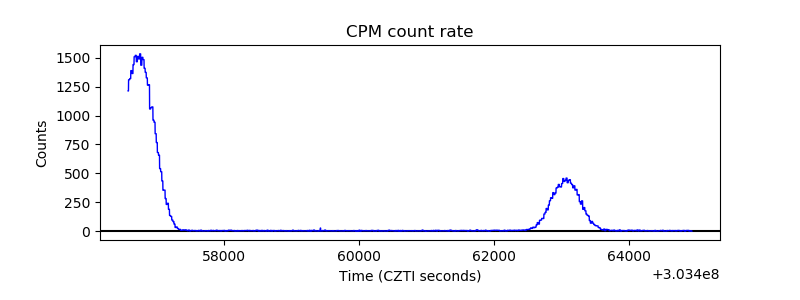 |
| CZT Counter | 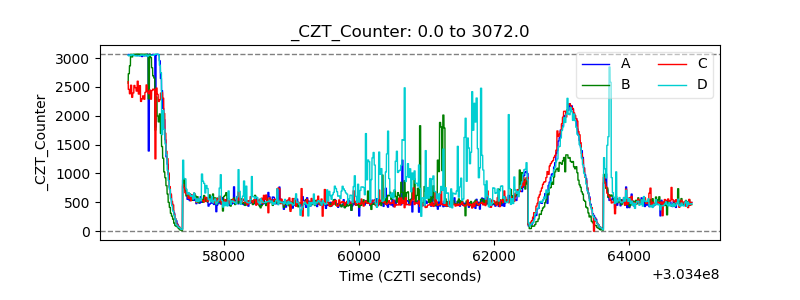 |
| +2.5 Volts monitor |  |
| +5 Volts monitor | 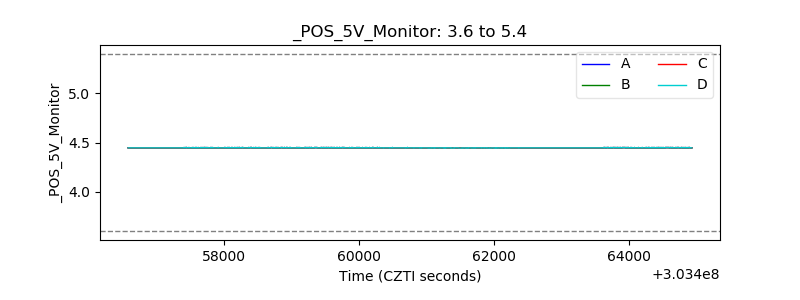 |
| _ROLL_ROT | 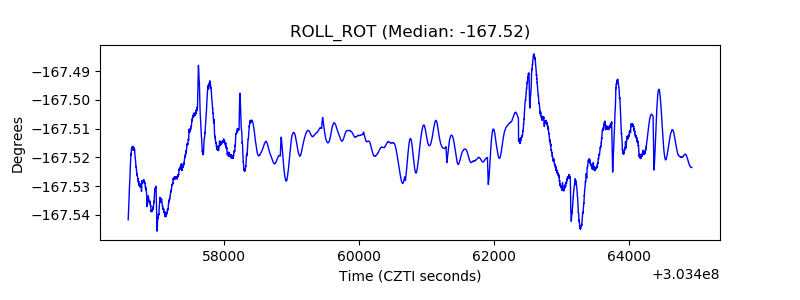 |
| _Roll_DEC | 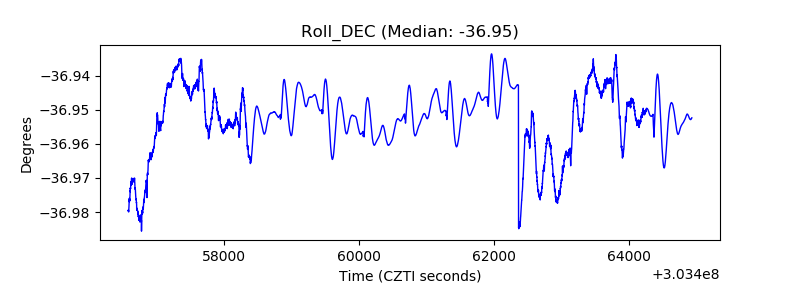 |
| _Roll_RA | 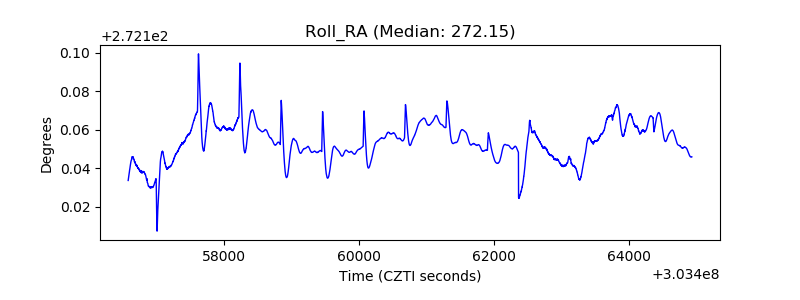 |
| Veto Counter | 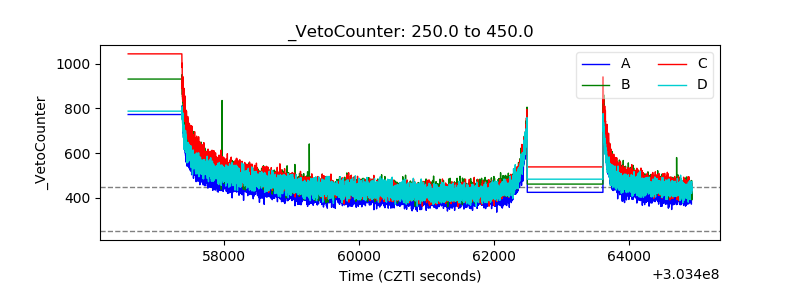 |