| Param | Original file | Final file |
|---|---|---|
| Filename | modeM0/AS1T03_131T01_9000003090_20962cztM0_level2.evt | modeM0/AS1T03_131T01_9000003090_20962cztM0_level2_quad_clean.evt |
| Size (bytes) | 510,330,240 | 81,051,840 |
| Size | 486.7 MB | 77.3 MB |
| Events in quadrant A | 3,772,230 | 492,522 |
| Events in quadrant B | 3,504,226 | 507,048 |
| Events in quadrant C | 3,397,967 | 495,720 |
| Events in quadrant D | 4,313,473 | 479,455 |
| Mode SS | |||
|---|---|---|---|
| Quadrant | BADHDUFLAG | Total packets | Discarded packets |
| A | 0 | 138 | 0 |
| B | 0 | 138 | 0 |
| C | 0 | 138 | 0 |
| D | 0 | 138 | 0 |
| Mode M9 | |||
|---|---|---|---|
| Quadrant | BADHDUFLAG | Total packets | Discarded packets |
| A | 0 | 14 | 0 |
| B | 0 | 15 | 0 |
| C | 0 | 15 | 0 |
| D | 0 | 15 | 0 |
| Mode M0 | |||
|---|---|---|---|
| Quadrant | BADHDUFLAG | Total packets | Discarded packets |
| A | 0 | 15482 | 2 |
| B | 0 | 14532 | 2 |
| C | 0 | 14230 | 2 |
| D | 0 | 17322 | 2 |
| Quadrant | Total seconds | Saturated seconds | Saturation percentage |
|---|---|---|---|
| A | 6890 | 211 | 3.062409% |
| B | 6890 | 128 | 1.857765% |
| C | 6889 | 152 | 2.206416% |
| D | 6889 | 291 | 4.224125% |
Noise dominated data is calculated using 1-second bins in cleaned event files. If a bin has >2000 counts, and if more than 50% of those come from <1% of pixels, then it is considered to be noise-dominated and hence unusable.
| Quadrant | # 1 sec bins | Bins with >0 counts | Bins with >2000 counts | High rate bins dominated by noise | Noise dominated (total time) | Noise dominated (detector-on time) | Marked lightcurve |
|---|---|---|---|---|---|---|---|
| A | 7645 | 6891 | 85 | 85 | 1.11% | 1.23% | 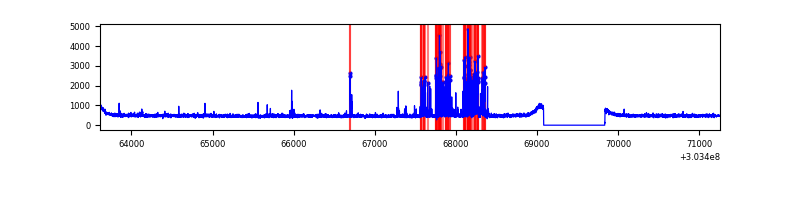 |
| B | 7645 | 6891 | 3 | 3 | 0.04% | 0.04% | 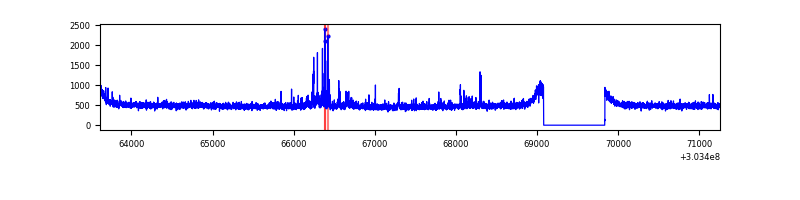 |
| C | 7644 | 6890 | 0 | 0 | 0.00% | 0.00% |  |
| D | 7644 | 6890 | 154 | 154 | 2.01% | 2.24% | 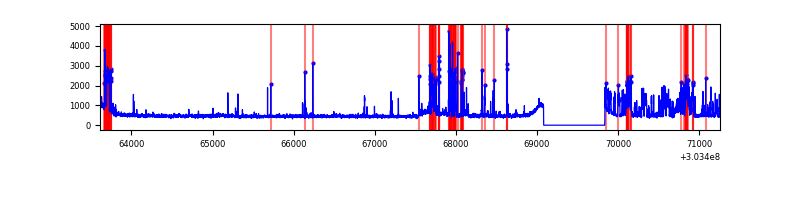 |
Top three noisy pixels from each quadrant. If the there are fewer than three noisy pixels in the level2.evt file, extra rows are filled as -1
| Pixel properties | Quadrant properties | ||||||
|---|---|---|---|---|---|---|---|
| Quadrant | DetID | PixID | Counts | Sigma | Mean | Median | Sigma |
| A | 5 | 16 | 458814 | 2619.51 | 862 | 843 | 174.8 |
| A | 0 | 226 | 7356 | 37.25 | 862 | 843 | 174.8 |
| A | 3 | 137 | 6879 | 34.52 | 862 | 843 | 174.8 |
| B | 7 | 220 | 49025 | 291.75 | 866 | 844 | 165.1 |
| B | 12 | 111 | 19786 | 114.7 | 866 | 844 | 165.1 |
| B | 11 | 111 | 17484 | 100.76 | 866 | 844 | 165.1 |
| C | 14 | 238 | 131198 | 667.28 | 835 | 838 | 195.4 |
| C | 7 | 247 | 11252 | 53.31 | 835 | 838 | 195.4 |
| C | 13 | 61 | 5914 | 25.98 | 835 | 838 | 195.4 |
| D | 7 | 238 | 499523 | 2461.59 | 836 | 812 | 202.6 |
| D | 1 | 52 | 296390 | 1458.94 | 836 | 812 | 202.6 |
| D | 5 | 222 | 233283 | 1147.45 | 836 | 812 | 202.6 |
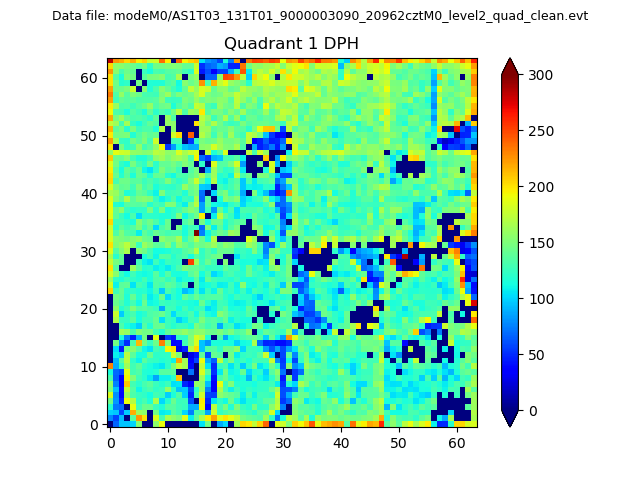
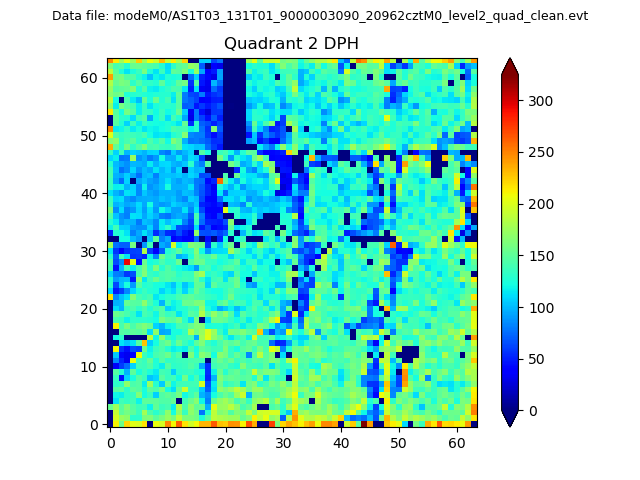
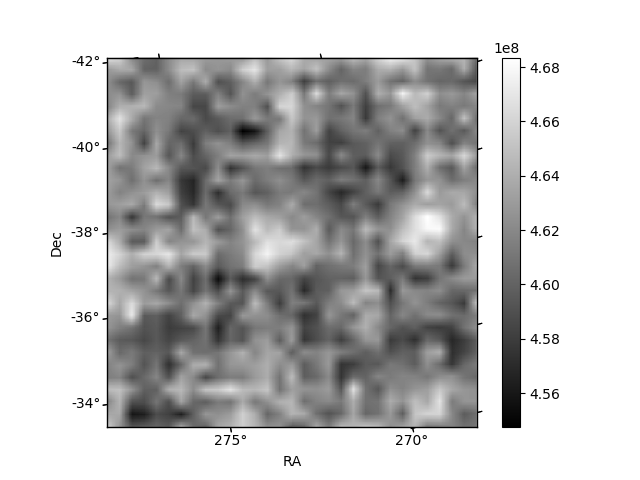
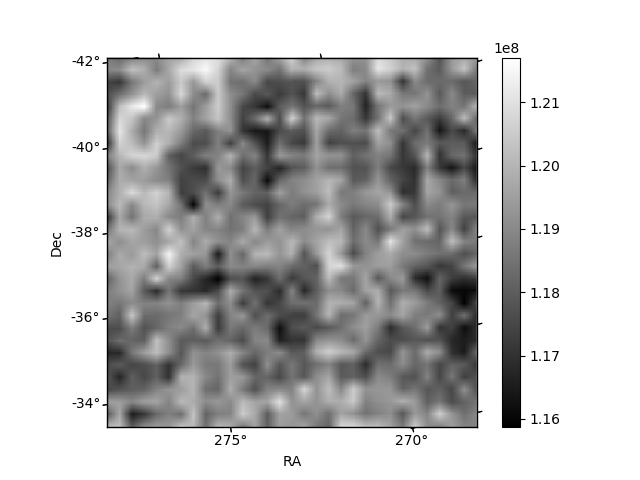
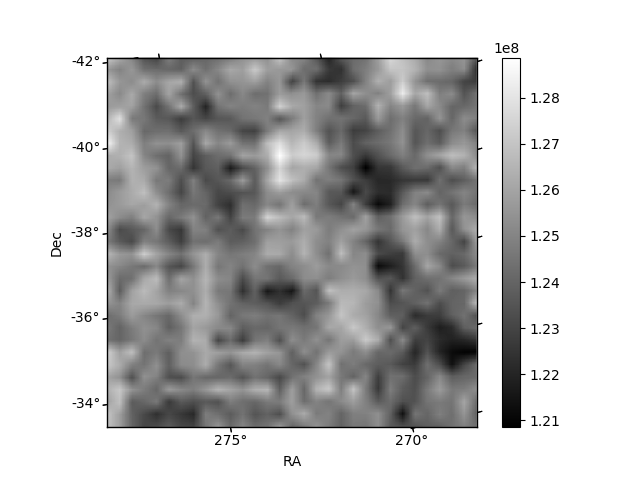
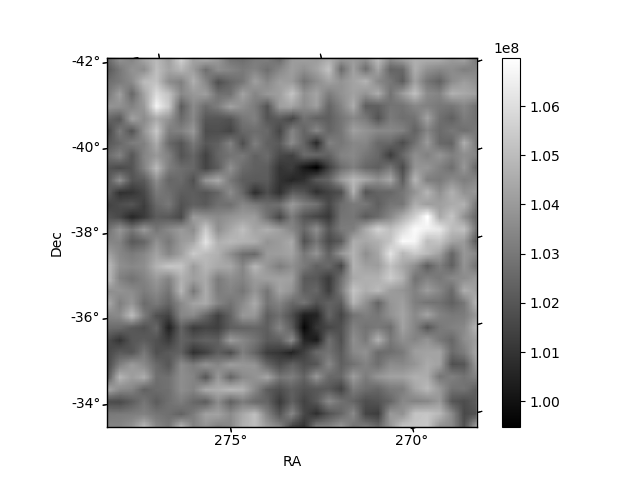
Histogram calculated using DETX and DETY for each event in the final _common_clean file
| Quadrant A | 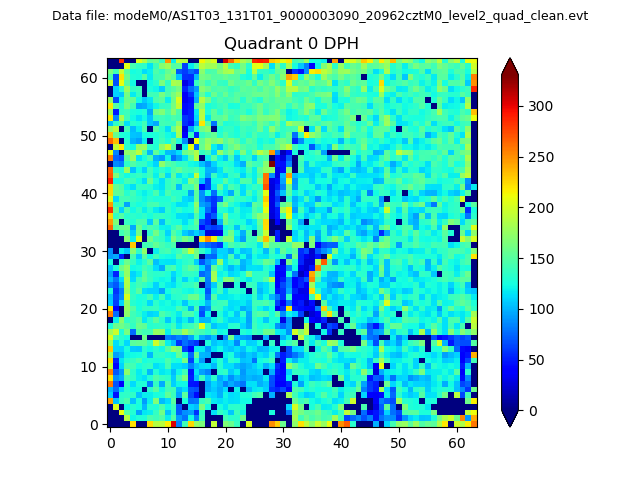 |
 |
Quadrant B |
|---|---|---|---|
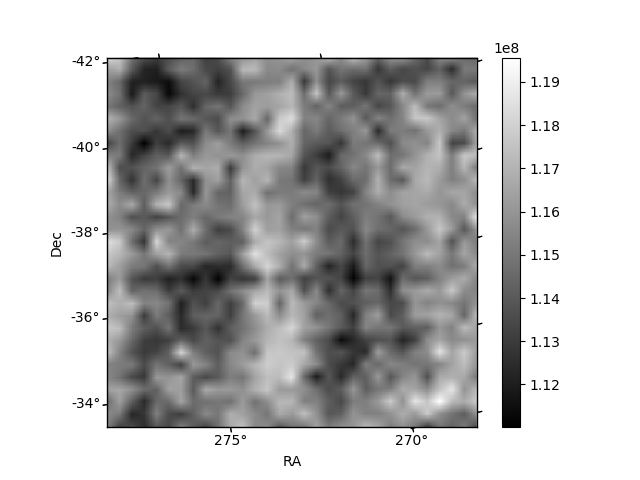
| Quadrant D | 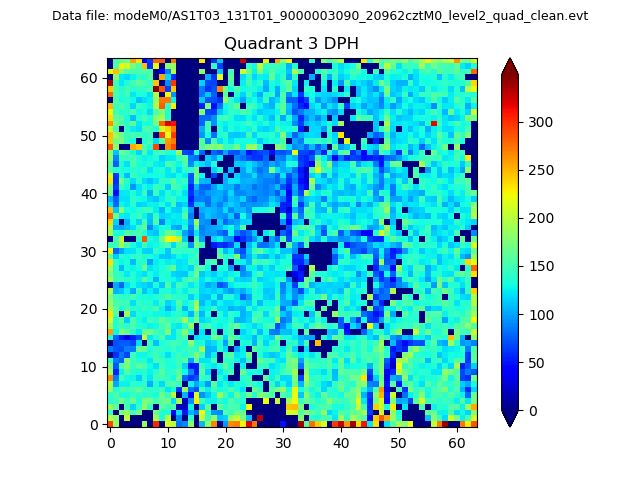 |
 |
Quadrant C |
| Plot type | Count rate plots | Images |
|---|---|---|
| Comparison with Poisson distribution Blue bars denote a histogram of data divided into 1 sec bins. Red curve is a Poisson curve with rate = median count rate of data. |
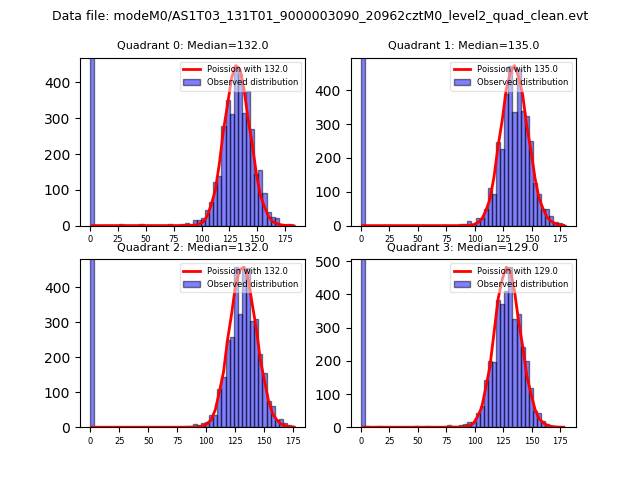 |
 |
| Quadrant-wise count rates Data is divided into 100 sec bins |
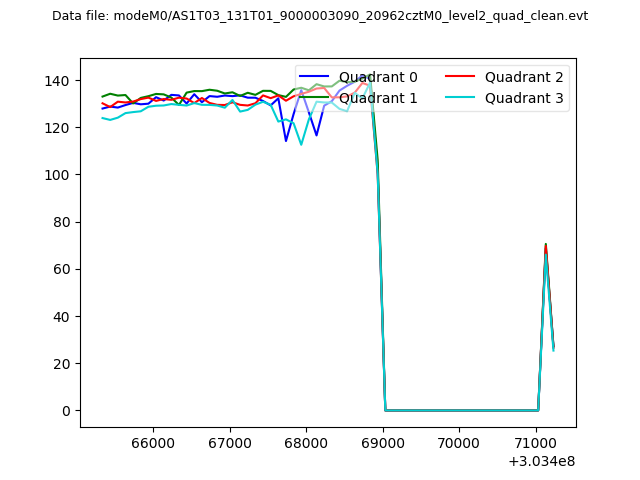 |
|
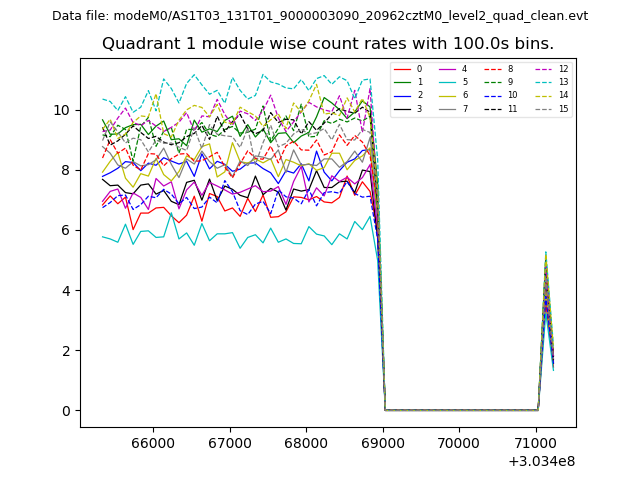
| Module-wise count rates for Quadrant A Data is divided into 100 sec bins |
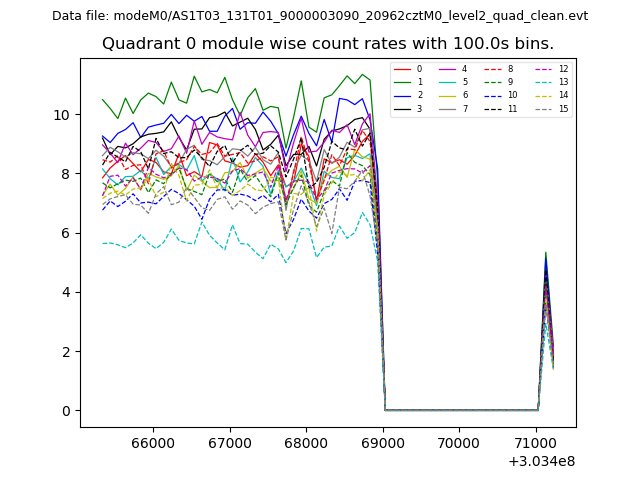 |
 |
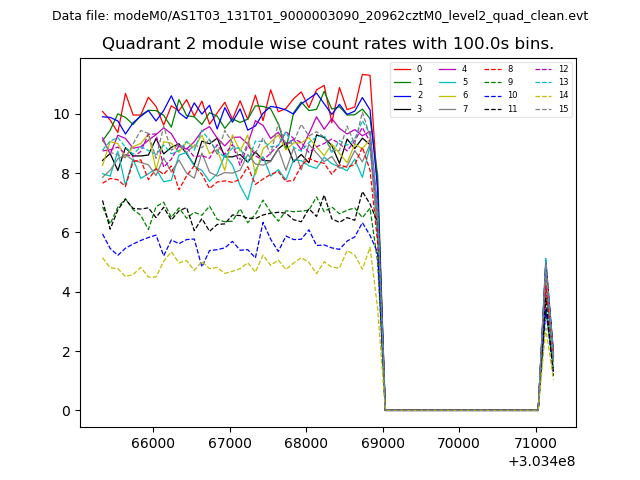
| Module-wise count rates for Quadrant B Data is divided into 100 sec bins |
 |
 |
| Module-wise count rates for Quadrant C Data is divided into 100 sec bins |
 |
 |
| Module-wise count rates for Quadrant D Data is divided into 100 sec bins |
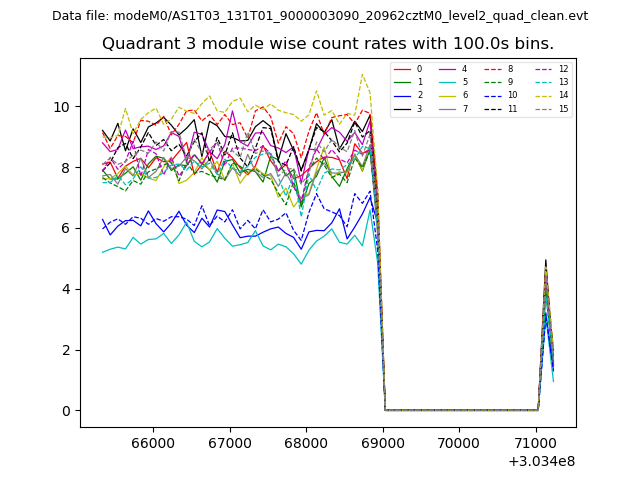 |
 |
| Parameter | Plot |
|---|---|
| CZT HV Monitor | 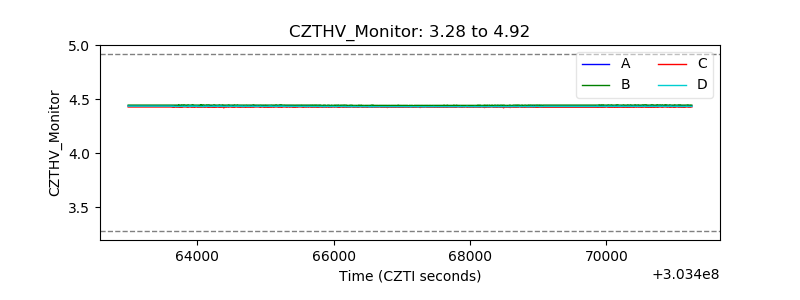 |
| D_VDD | 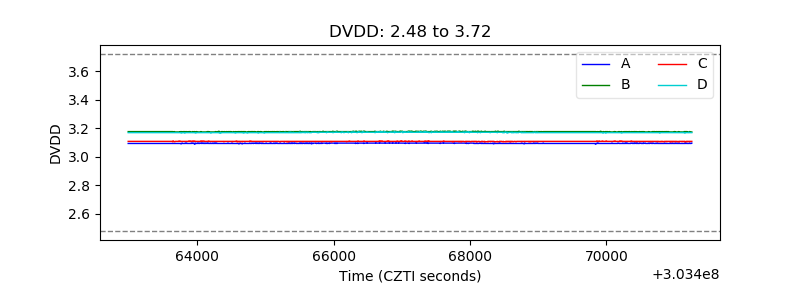 |
| Temperature 1 |  |
| Veto HV Monitor | 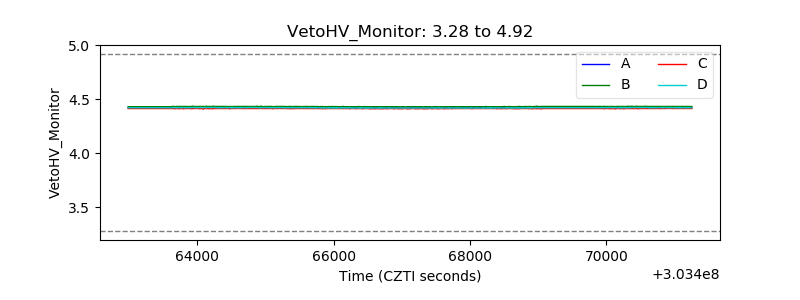 |
| Veto LLD | 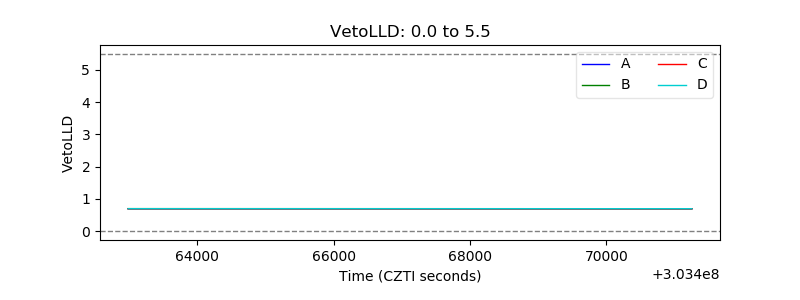 |
| Alpha Counter | 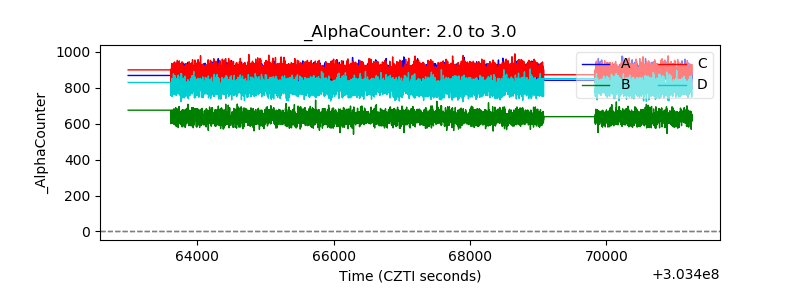 |
| _CPM_Rate | 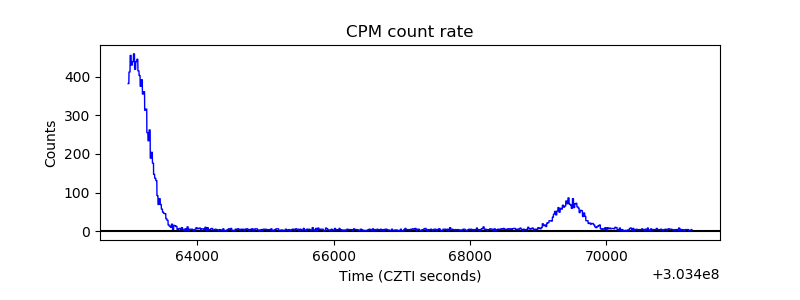 |
| CZT Counter | 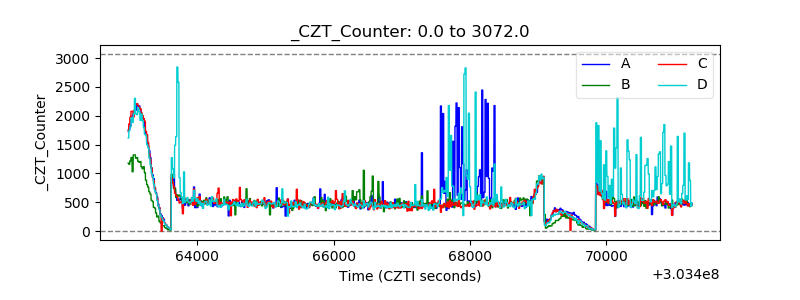 |
| +2.5 Volts monitor |  |
| +5 Volts monitor | 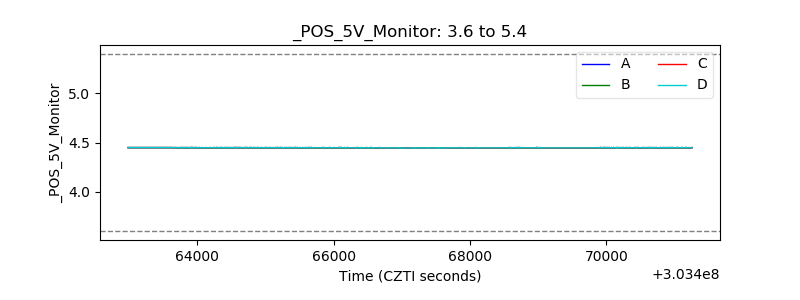 |
| _ROLL_ROT | 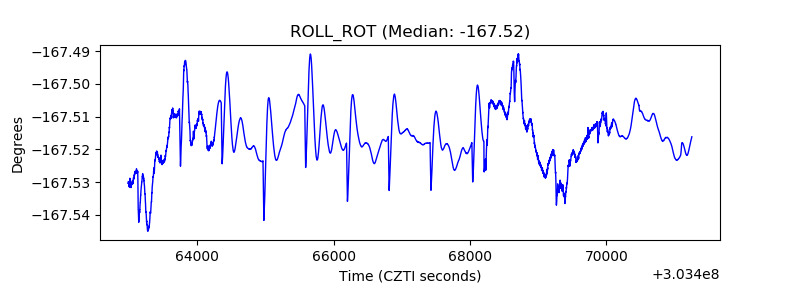 |
| _Roll_DEC | 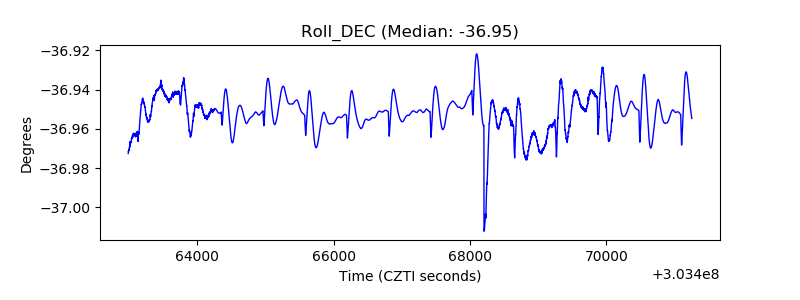 |
| _Roll_RA | 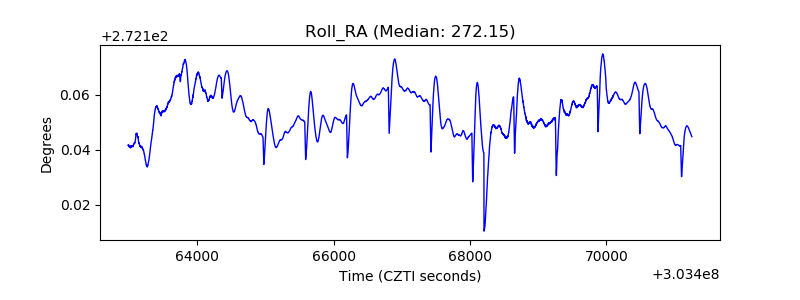 |
| Veto Counter | 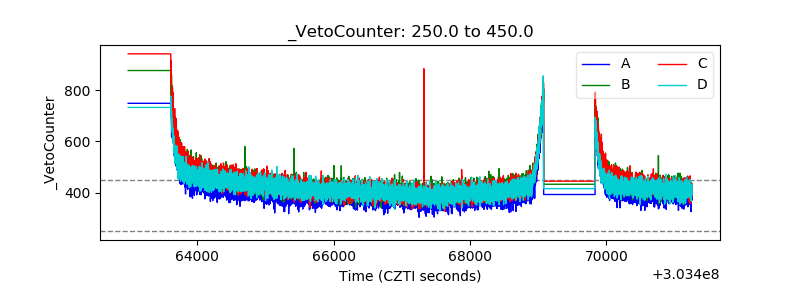 |