| Param | Original file | Final file |
|---|---|---|
| Filename | modeM0/AS1T03_131T01_9000003090_20963cztM0_level2.evt | modeM0/AS1T03_131T01_9000003090_20963cztM0_level2_quad_clean.evt |
| Size (bytes) | 558,483,840 | 87,756,480 |
| Size | 532.6 MB | 83.7 MB |
| Events in quadrant A | 3,924,391 | 535,427 |
| Events in quadrant B | 3,838,347 | 549,681 |
| Events in quadrant C | 3,658,918 | 536,694 |
| Events in quadrant D | 4,985,679 | 516,358 |
| Mode SS | |||
|---|---|---|---|
| Quadrant | BADHDUFLAG | Total packets | Discarded packets |
| A | 0 | 150 | 0 |
| B | 0 | 150 | 0 |
| C | 0 | 150 | 0 |
| D | 0 | 150 | 0 |
| Mode M9 | |||
|---|---|---|---|
| Quadrant | BADHDUFLAG | Total packets | Discarded packets |
| A | 0 | 7 | 0 |
| B | 0 | 8 | 0 |
| C | 0 | 8 | 0 |
| D | 0 | 8 | 0 |
| Mode M0 | |||
|---|---|---|---|
| Quadrant | BADHDUFLAG | Total packets | Discarded packets |
| A | 0 | 16399 | 2 |
| B | 0 | 16036 | 2 |
| C | 0 | 15528 | 2 |
| D | 0 | 19742 | 2 |
| Quadrant | Total seconds | Saturated seconds | Saturation percentage |
|---|---|---|---|
| A | 7466 | 284 | 3.803911% |
| B | 7466 | 271 | 3.629788% |
| C | 7466 | 272 | 3.643182% |
| D | 7466 | 413 | 5.531744% |
Noise dominated data is calculated using 1-second bins in cleaned event files. If a bin has >2000 counts, and if more than 50% of those come from <1% of pixels, then it is considered to be noise-dominated and hence unusable.
| Quadrant | # 1 sec bins | Bins with >0 counts | Bins with >2000 counts | High rate bins dominated by noise | Noise dominated (total time) | Noise dominated (detector-on time) | Marked lightcurve |
|---|---|---|---|---|---|---|---|
| A | 7746 | 7467 | 48 | 48 | 0.62% | 0.64% | 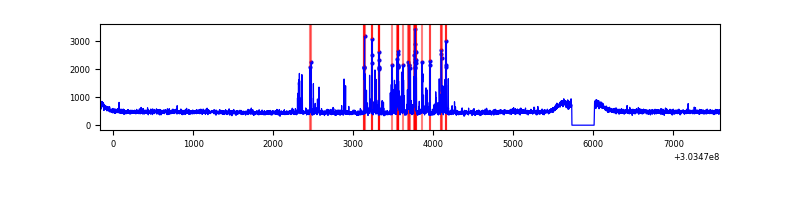 |
| B | 7746 | 7467 | 8 | 8 | 0.10% | 0.11% | 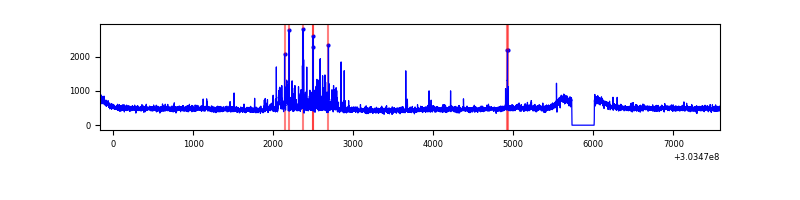 |
| C | 7746 | 7467 | 1 | 1 | 0.01% | 0.01% | 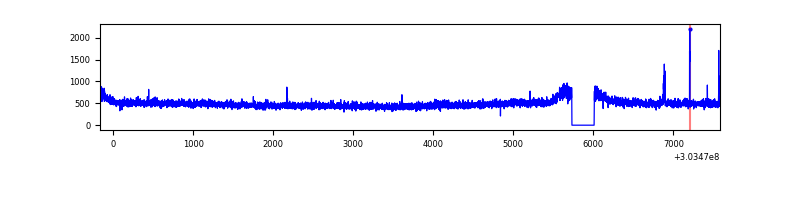 |
| D | 7746 | 7467 | 146 | 146 | 1.88% | 1.96% | 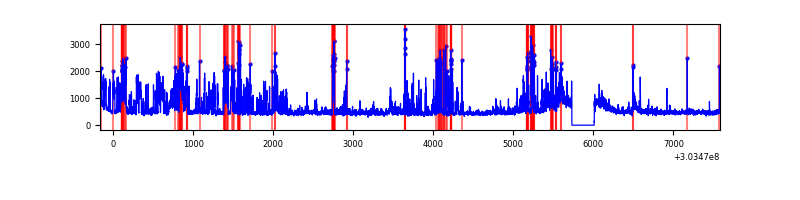 |
Top three noisy pixels from each quadrant. If the there are fewer than three noisy pixels in the level2.evt file, extra rows are filled as -1
| Pixel properties | Quadrant properties | ||||||
|---|---|---|---|---|---|---|---|
| Quadrant | DetID | PixID | Counts | Sigma | Mean | Median | Sigma |
| A | 5 | 16 | 369231 | 1962.07 | 925 | 905 | 187.7 |
| A | 0 | 226 | 7923 | 37.38 | 925 | 905 | 187.7 |
| A | 3 | 137 | 7735 | 36.38 | 925 | 905 | 187.7 |
| B | 7 | 220 | 135371 | 752.91 | 926 | 898 | 178.6 |
| B | 3 | 64 | 28246 | 153.12 | 926 | 898 | 178.6 |
| B | 7 | 219 | 21911 | 117.65 | 926 | 898 | 178.6 |
| C | 14 | 238 | 139332 | 664.16 | 893 | 897 | 208.4 |
| C | 9 | 54 | 23632 | 109.07 | 893 | 897 | 208.4 |
| C | 7 | 247 | 11216 | 49.51 | 893 | 897 | 208.4 |
| D | 7 | 238 | 640470 | 2954.25 | 895 | 868 | 216.5 |
| D | 7 | 223 | 438675 | 2022.18 | 895 | 868 | 216.5 |
| D | 5 | 222 | 360125 | 1659.37 | 895 | 868 | 216.5 |
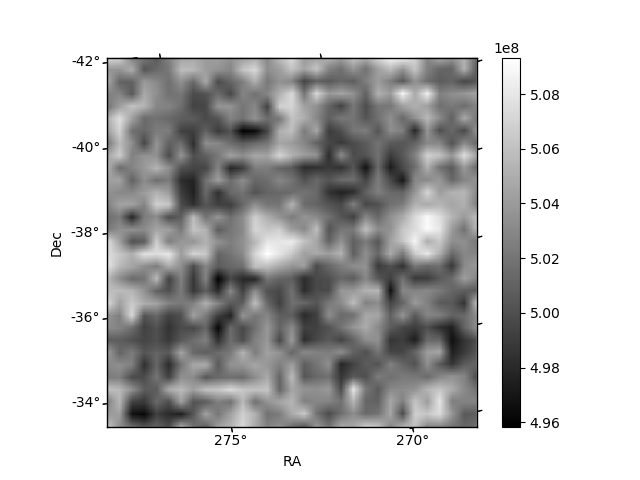
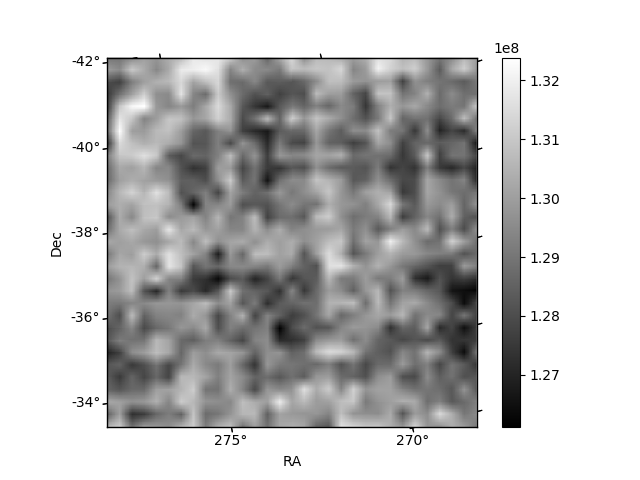
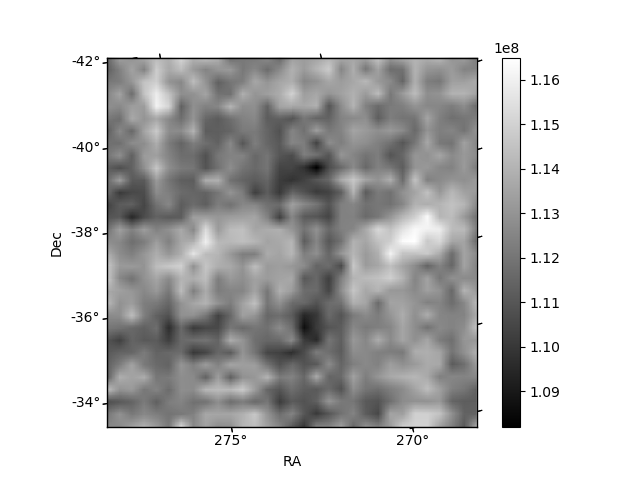
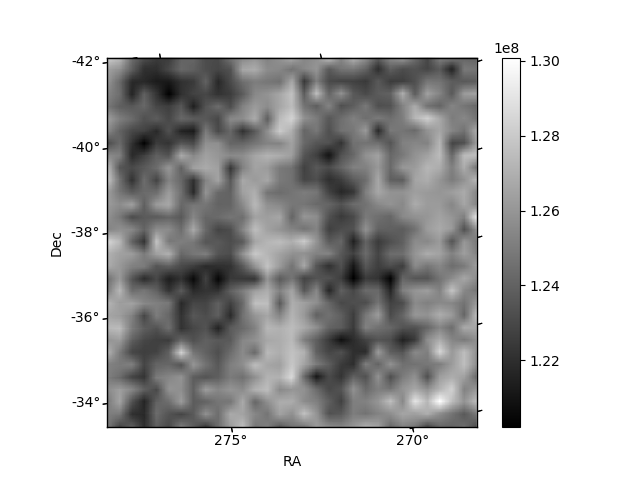
Histogram calculated using DETX and DETY for each event in the final _common_clean file
| Quadrant A | 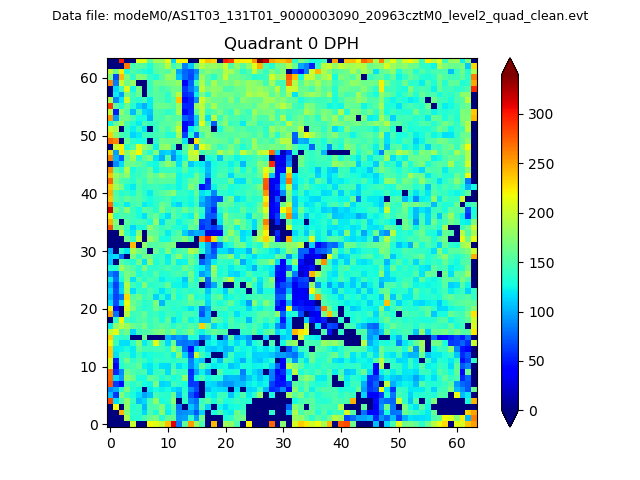 |
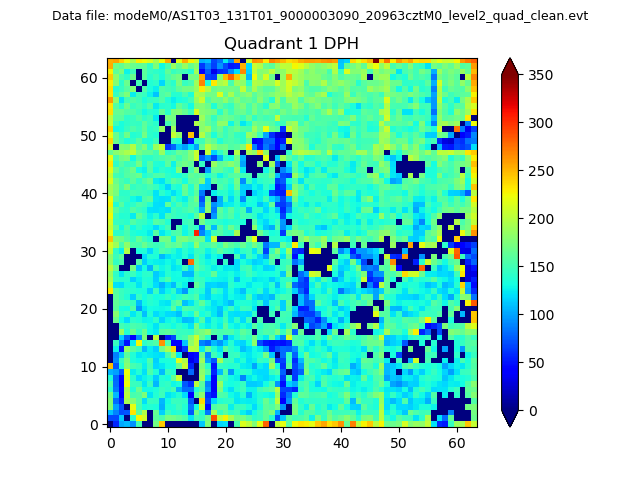 |
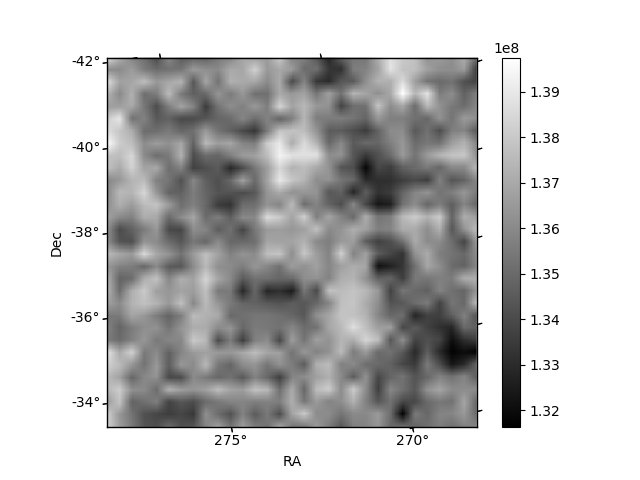
Quadrant B |
|---|---|---|---|
| Quadrant D | 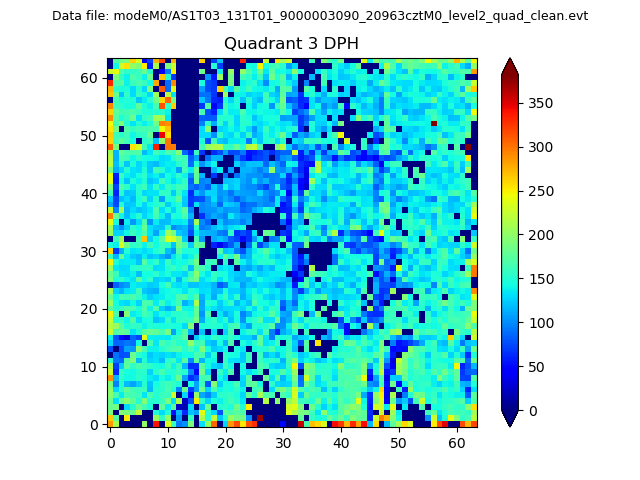 |
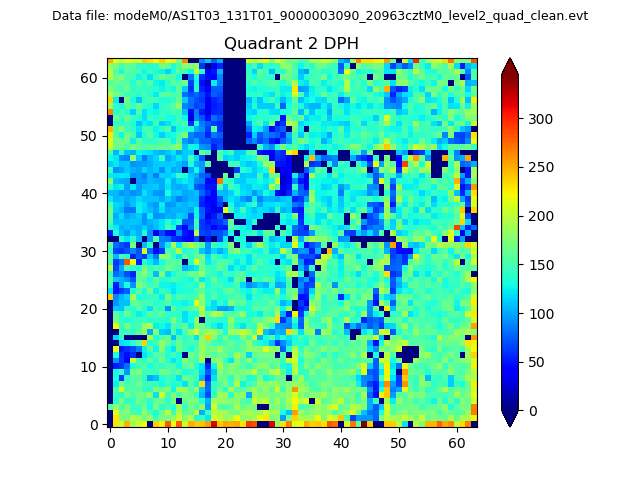 |
Quadrant C |
| Plot type | Count rate plots | Images |
|---|---|---|
| Comparison with Poisson distribution Blue bars denote a histogram of data divided into 1 sec bins. Red curve is a Poisson curve with rate = median count rate of data. |
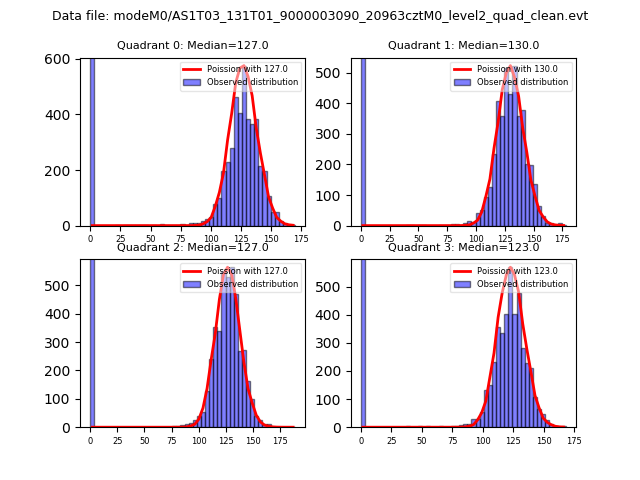 |
 |
| Quadrant-wise count rates Data is divided into 100 sec bins |
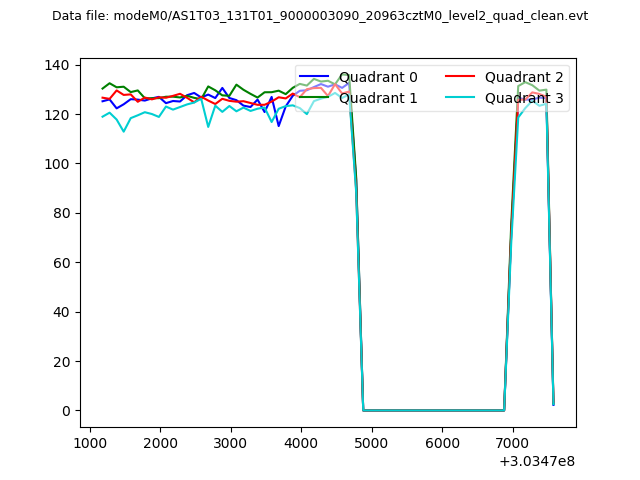 |
|
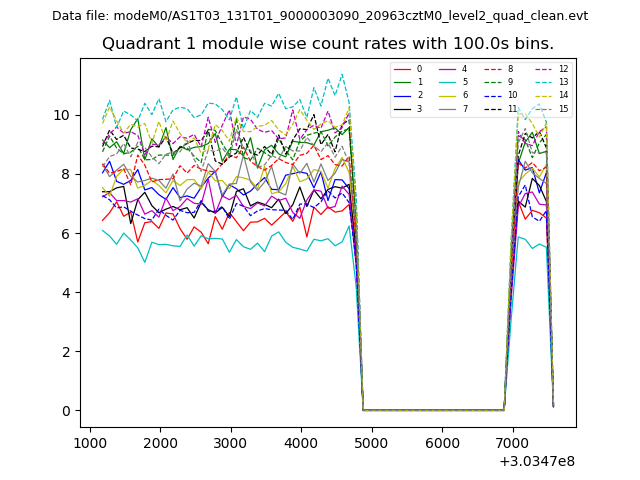
| Module-wise count rates for Quadrant A Data is divided into 100 sec bins |
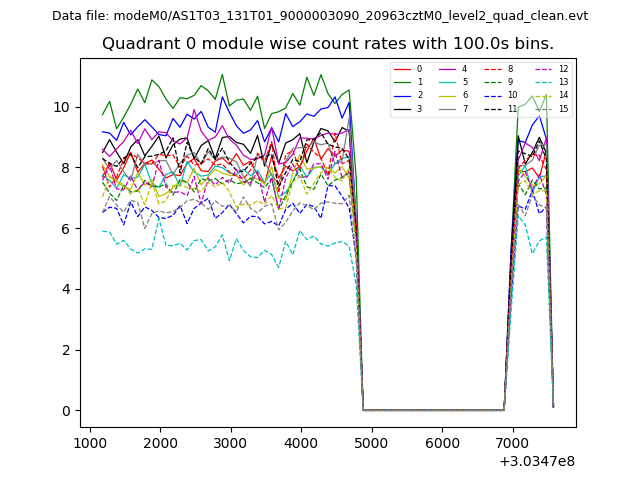 |
 |
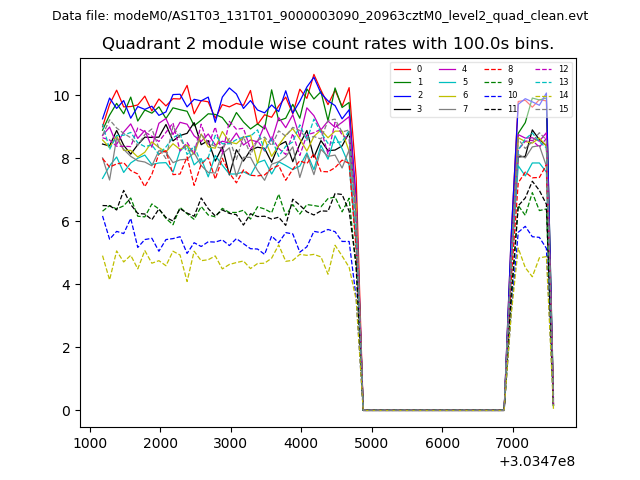
| Module-wise count rates for Quadrant B Data is divided into 100 sec bins |
 |
 |
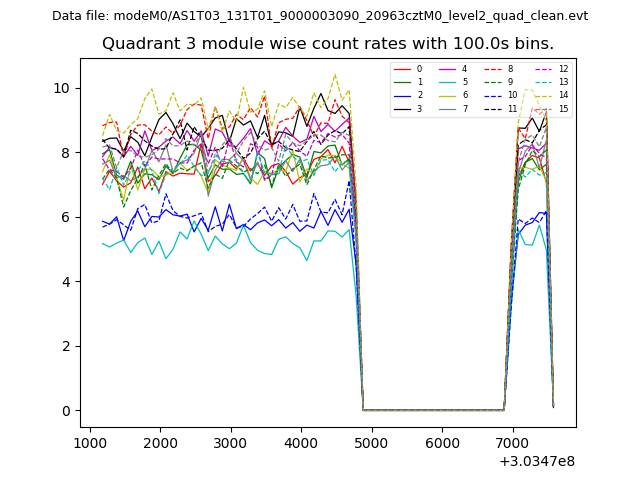
| Module-wise count rates for Quadrant C Data is divided into 100 sec bins |
 |
 |
| Module-wise count rates for Quadrant D Data is divided into 100 sec bins |
 |
 |
| Parameter | Plot |
|---|---|
| CZT HV Monitor | 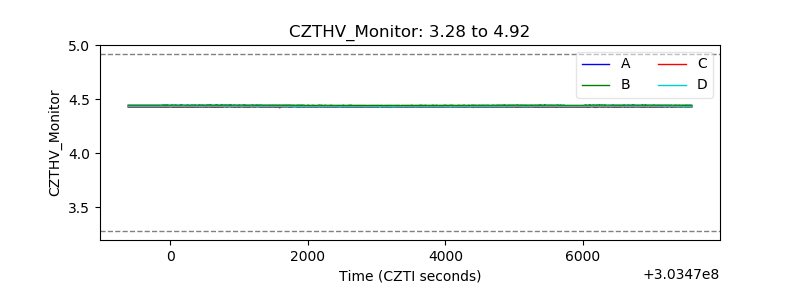 |
| D_VDD | 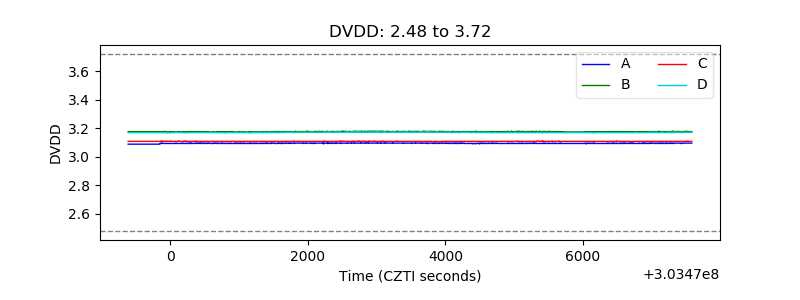 |
| Temperature 1 | 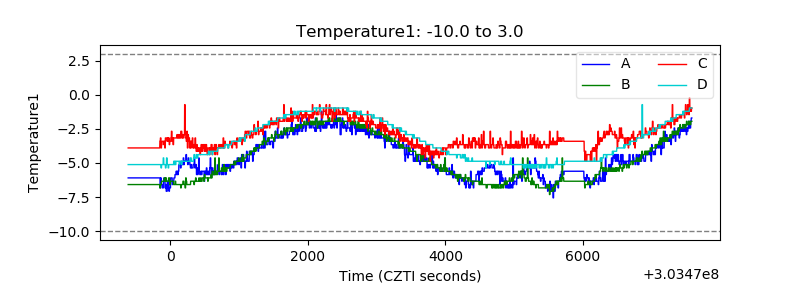 |
| Veto HV Monitor | 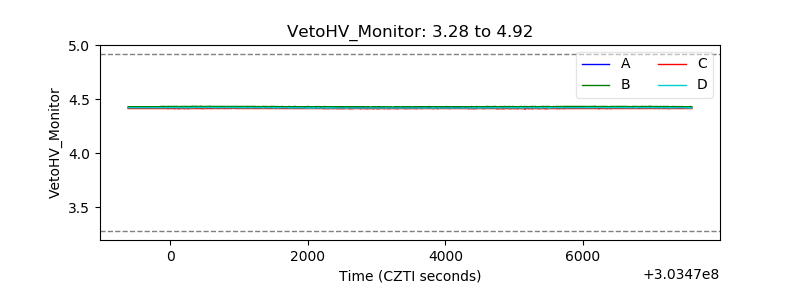 |
| Veto LLD | 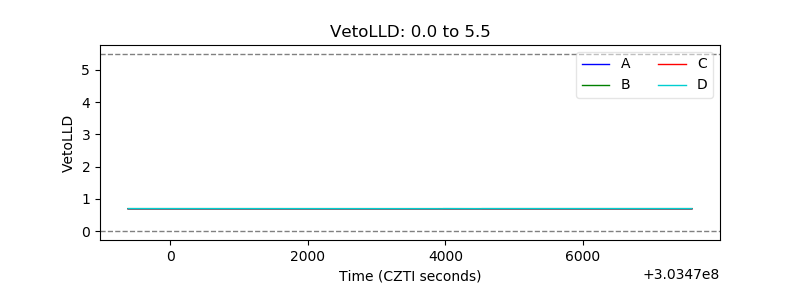 |
| Alpha Counter | 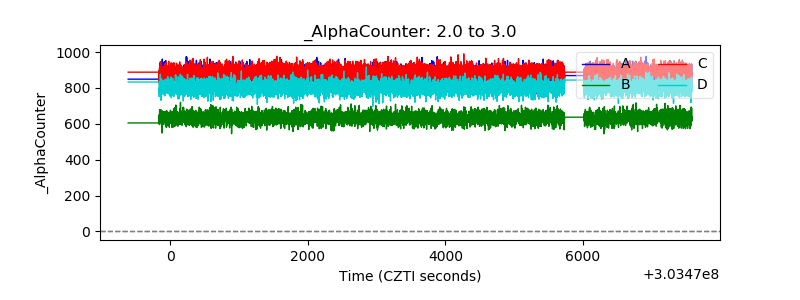 |
| _CPM_Rate | 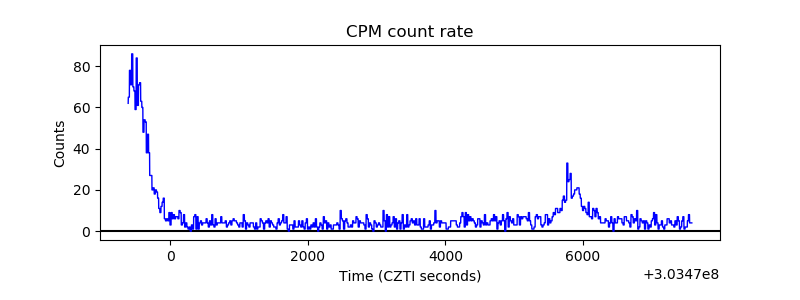 |
| CZT Counter | 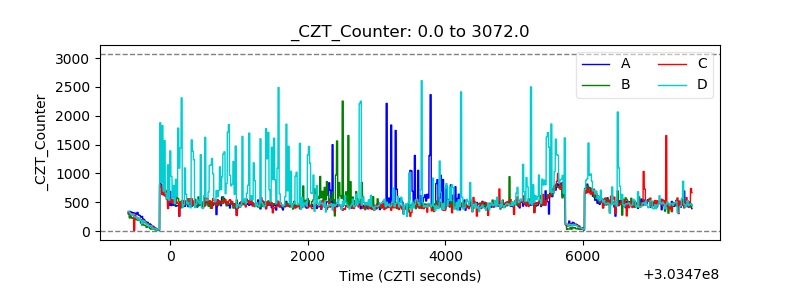 |
| +2.5 Volts monitor |  |
| +5 Volts monitor |  |
| _ROLL_ROT | 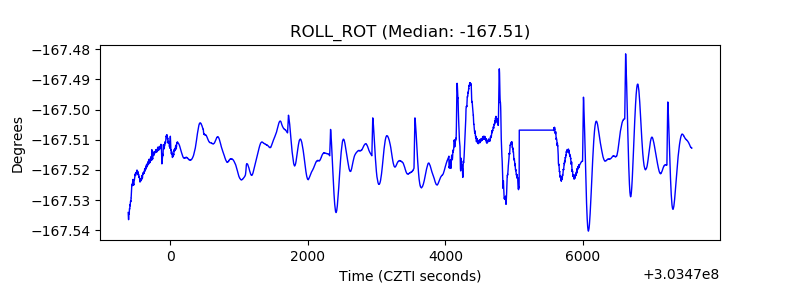 |
| _Roll_DEC | 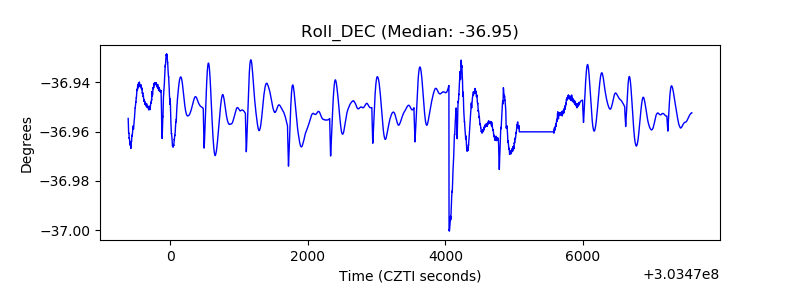 |
| _Roll_RA | 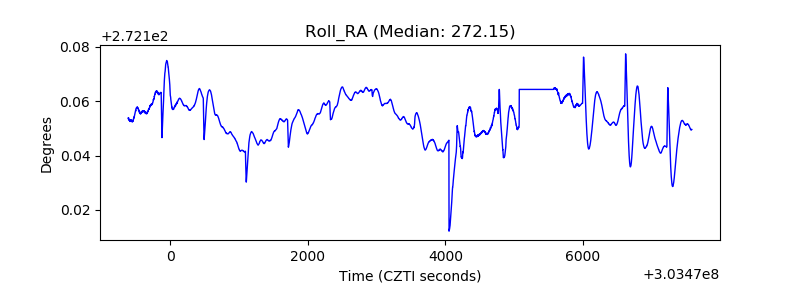 |
| Veto Counter | 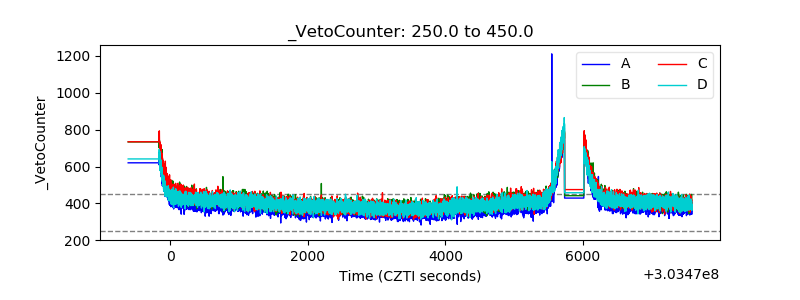 |