| Param | Original file | Final file |
|---|---|---|
| Filename | modeM0/AS1T03_131T01_9000003090_20964cztM0_level2.evt | modeM0/AS1T03_131T01_9000003090_20964cztM0_level2_quad_clean.evt |
| Size (bytes) | 529,804,800 | 94,806,720 |
| Size | 505.3 MB | 90.4 MB |
| Events in quadrant A | 3,837,316 | 585,015 |
| Events in quadrant B | 3,976,559 | 595,849 |
| Events in quadrant C | 3,818,059 | 583,821 |
| Events in quadrant D | 3,886,874 | 567,894 |
| Mode SS | |||
|---|---|---|---|
| Quadrant | BADHDUFLAG | Total packets | Discarded packets |
| A | 0 | 158 | 0 |
| B | 0 | 158 | 0 |
| C | 0 | 158 | 0 |
| D | 0 | 158 | 0 |
| Mode M9 | |||
|---|---|---|---|
| Quadrant | BADHDUFLAG | Total packets | Discarded packets |
| A | 0 | 6 | 0 |
| B | 0 | 6 | 0 |
| C | 0 | 6 | 0 |
| D | 0 | 6 | 0 |
| Mode M0 | |||
|---|---|---|---|
| Quadrant | BADHDUFLAG | Total packets | Discarded packets |
| A | 0 | 16439 | 2 |
| B | 0 | 16633 | 2 |
| C | 0 | 16256 | 2 |
| D | 0 | 16711 | 2 |
| Quadrant | Total seconds | Saturated seconds | Saturation percentage |
|---|---|---|---|
| A | 7746 | 340 | 4.389362% |
| B | 7746 | 355 | 4.583011% |
| C | 7746 | 380 | 4.905758% |
| D | 7745 | 310 | 4.002582% |
Noise dominated data is calculated using 1-second bins in cleaned event files. If a bin has >2000 counts, and if more than 50% of those come from <1% of pixels, then it is considered to be noise-dominated and hence unusable.
| Quadrant | # 1 sec bins | Bins with >0 counts | Bins with >2000 counts | High rate bins dominated by noise | Noise dominated (total time) | Noise dominated (detector-on time) | Marked lightcurve |
|---|---|---|---|---|---|---|---|
| A | 8291 | 7748 | 18 | 18 | 0.22% | 0.23% | 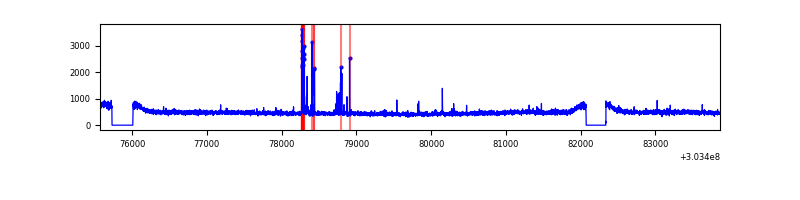 |
| B | 8291 | 7748 | 9 | 9 | 0.11% | 0.12% | 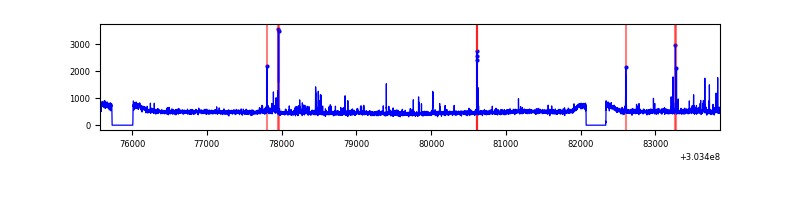 |
| C | 8291 | 7748 | 1 | 1 | 0.01% | 0.01% | 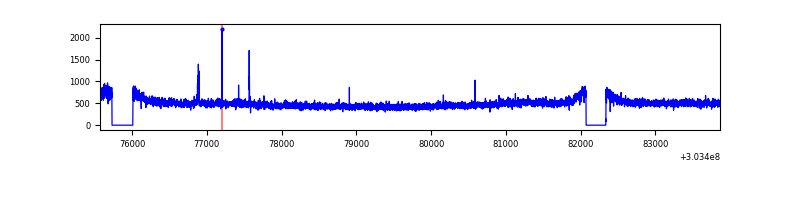 |
| D | 8290 | 7747 | 21 | 21 | 0.25% | 0.27% | 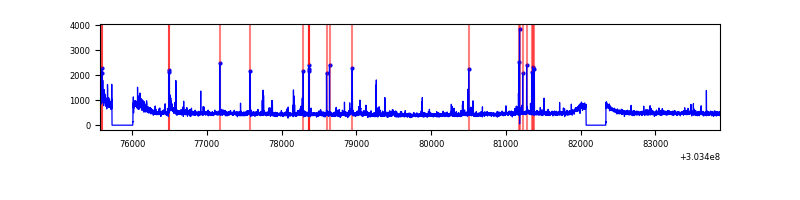 |
Top three noisy pixels from each quadrant. If the there are fewer than three noisy pixels in the level2.evt file, extra rows are filled as -1
| Pixel properties | Quadrant properties | ||||||
|---|---|---|---|---|---|---|---|
| Quadrant | DetID | PixID | Counts | Sigma | Mean | Median | Sigma |
| A | 5 | 16 | 119983 | 607.61 | 966 | 944 | 195.9 |
| A | 0 | 226 | 8441 | 38.27 | 966 | 944 | 195.9 |
| A | 3 | 137 | 8095 | 36.5 | 966 | 944 | 195.9 |
| B | 3 | 64 | 83251 | 447.2 | 964 | 937 | 184.1 |
| B | 0 | 245 | 27704 | 145.42 | 964 | 937 | 184.1 |
| B | 4 | 216 | 24582 | 128.46 | 964 | 937 | 184.1 |
| C | 14 | 238 | 145888 | 662.88 | 932 | 936 | 218.7 |
| C | 9 | 54 | 26424 | 116.56 | 932 | 936 | 218.7 |
| C | 10 | 91 | 10682 | 44.57 | 932 | 936 | 218.7 |
| D | 7 | 223 | 79082 | 337.05 | 945 | 915 | 231.9 |
| D | 5 | 222 | 60140 | 255.37 | 945 | 915 | 231.9 |
| D | 1 | 52 | 43524 | 183.73 | 945 | 915 | 231.9 |
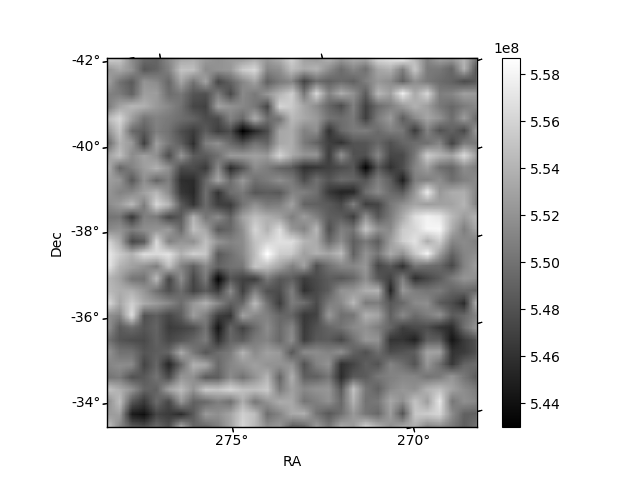
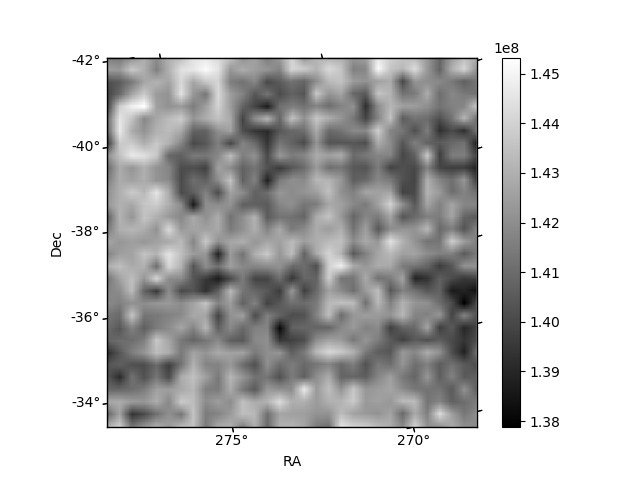
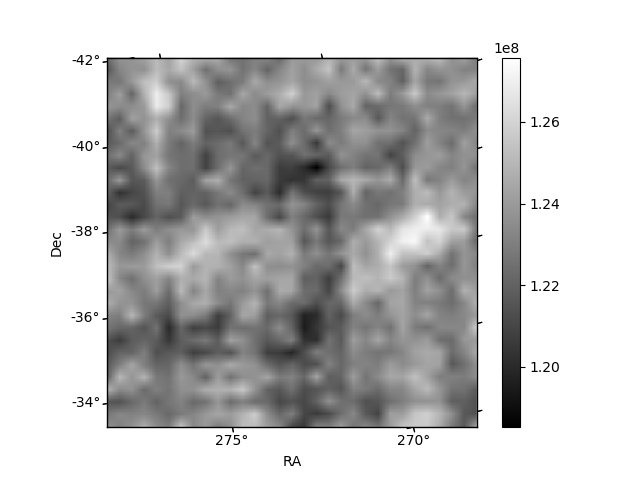
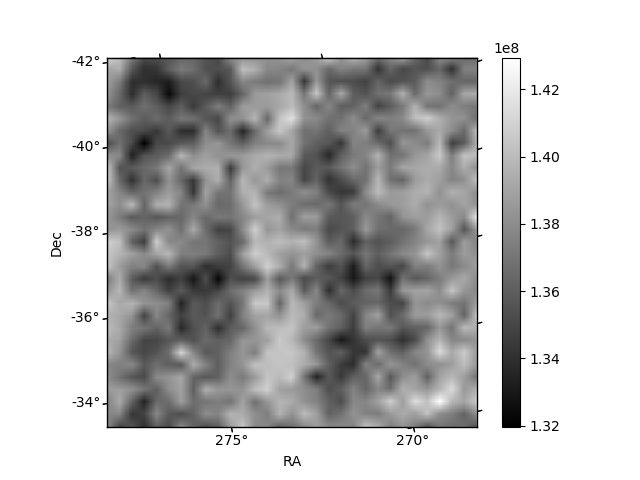
Histogram calculated using DETX and DETY for each event in the final _common_clean file
| Quadrant A | 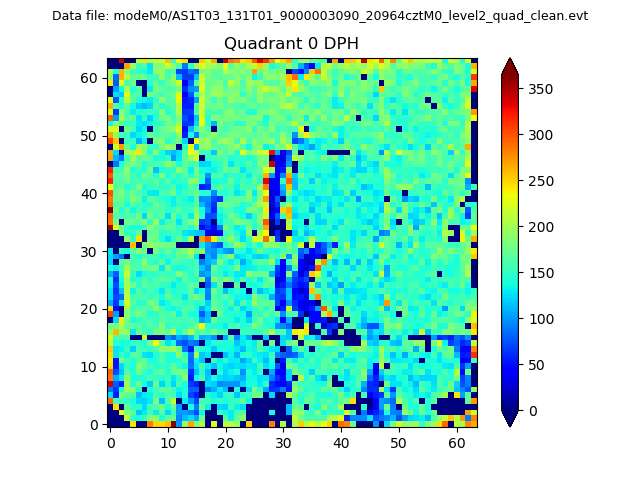 |
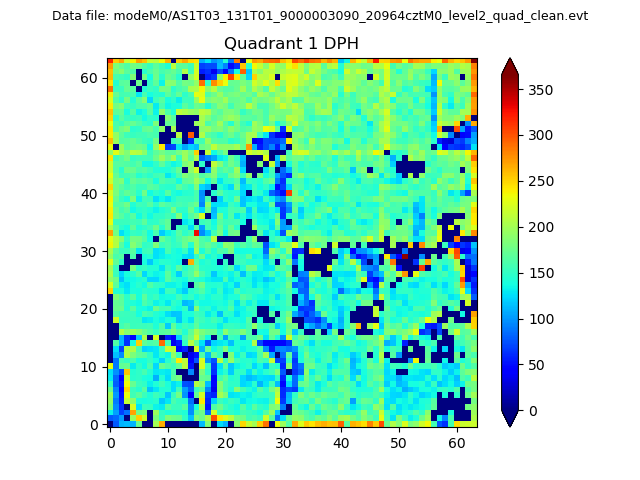 |
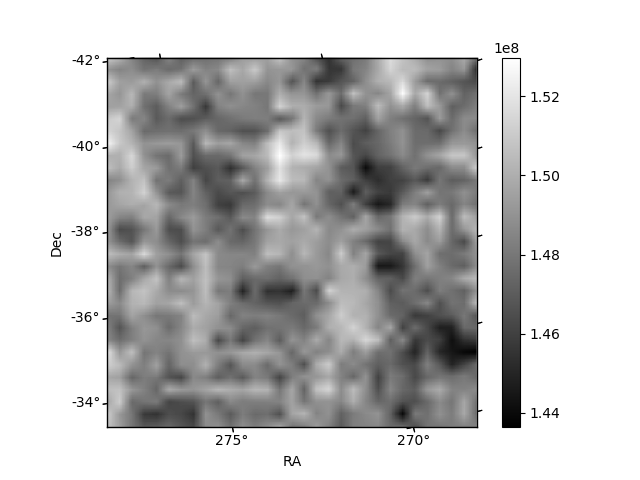
Quadrant B |
|---|---|---|---|
| Quadrant D | 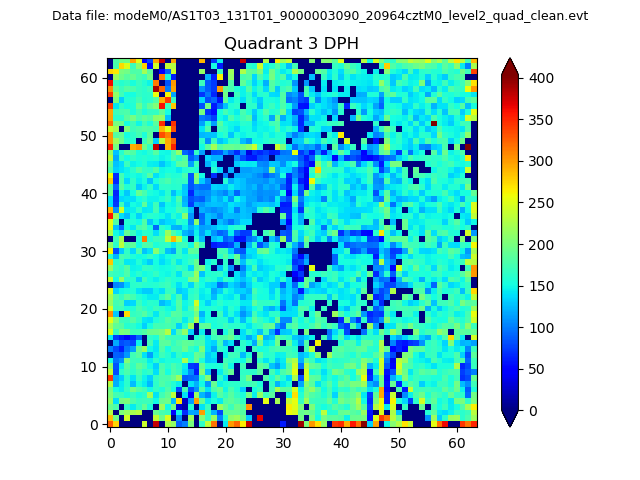 |
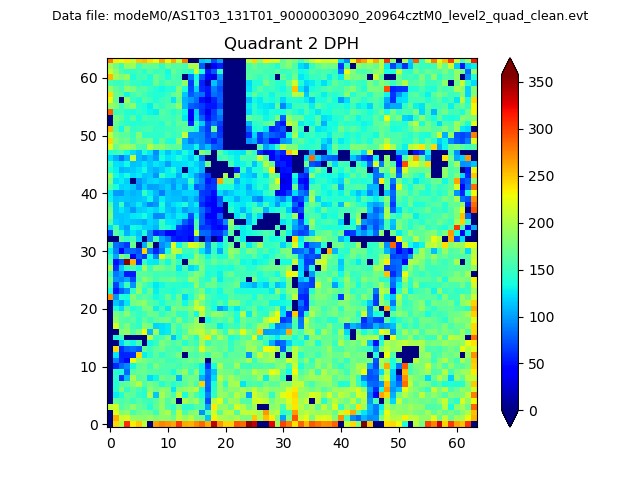 |
Quadrant C |
| Plot type | Count rate plots | Images |
|---|---|---|
| Comparison with Poisson distribution Blue bars denote a histogram of data divided into 1 sec bins. Red curve is a Poisson curve with rate = median count rate of data. |
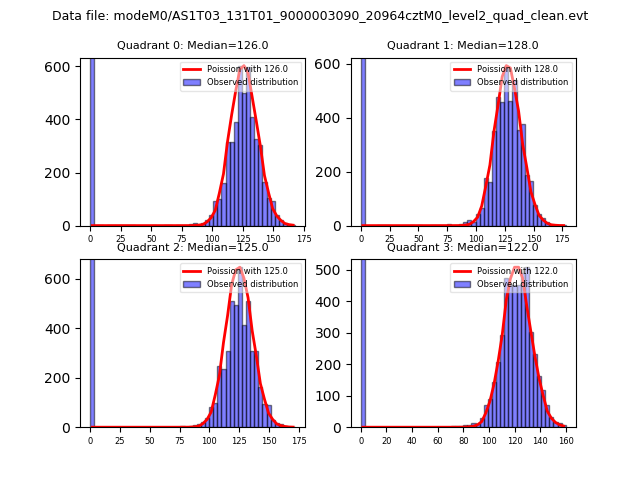 |
 |
| Quadrant-wise count rates Data is divided into 100 sec bins |
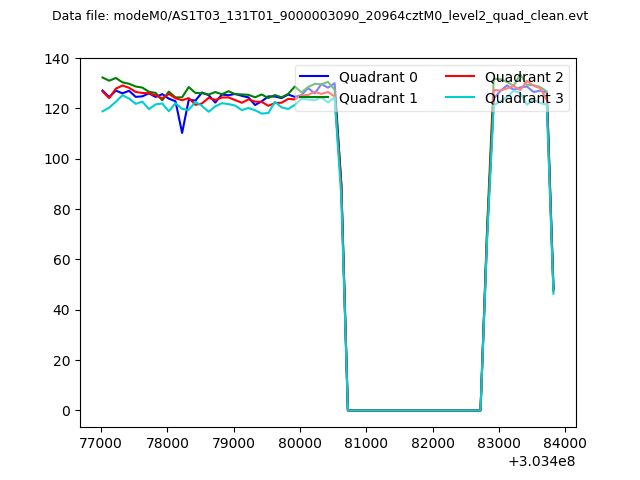 |
|
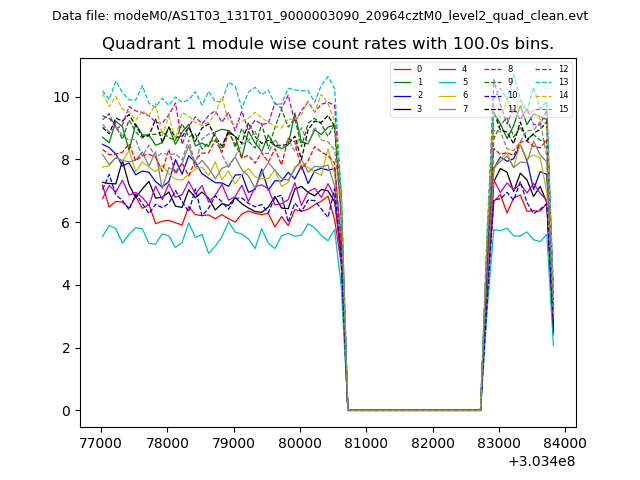
| Module-wise count rates for Quadrant A Data is divided into 100 sec bins |
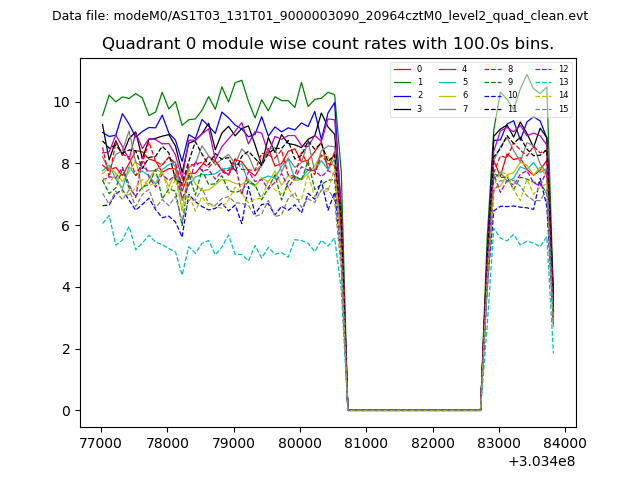 |
 |
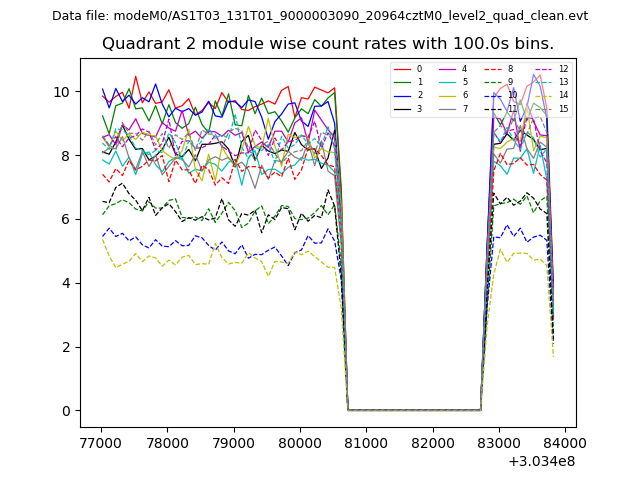
| Module-wise count rates for Quadrant B Data is divided into 100 sec bins |
 |
 |
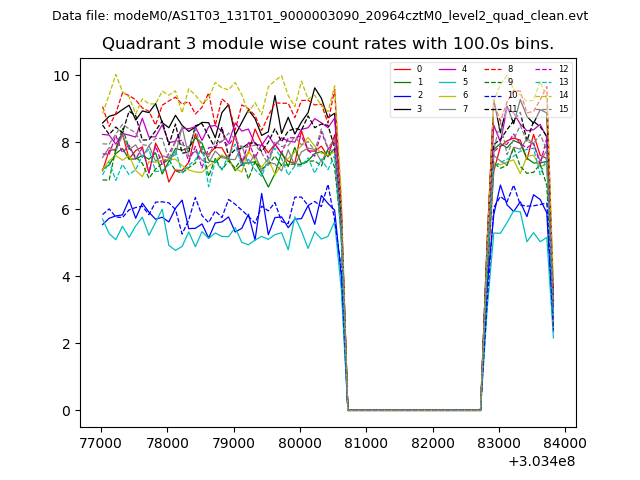
| Module-wise count rates for Quadrant C Data is divided into 100 sec bins |
 |
 |
| Module-wise count rates for Quadrant D Data is divided into 100 sec bins |
 |
 |
| Parameter | Plot |
|---|---|
| CZT HV Monitor | 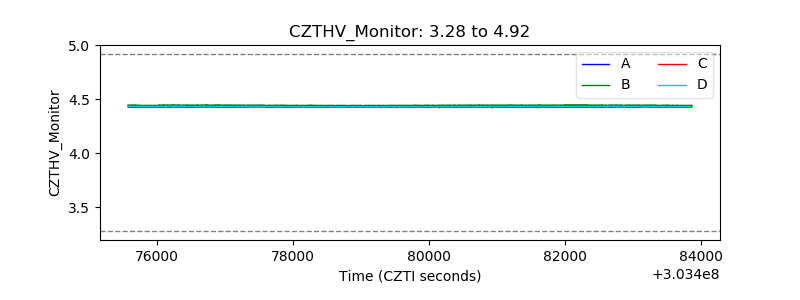 |
| D_VDD | 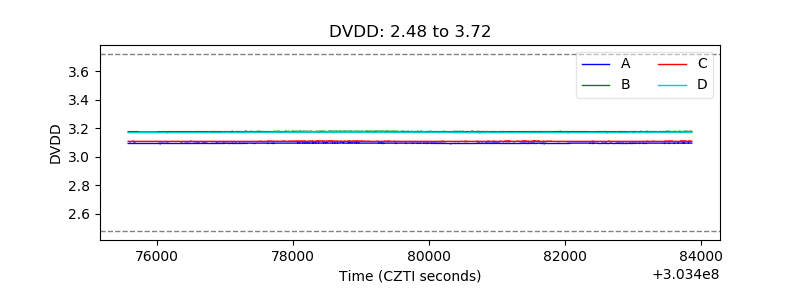 |
| Temperature 1 | 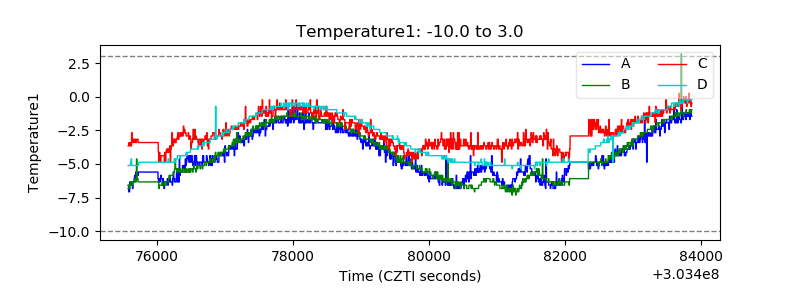 |
| Veto HV Monitor | 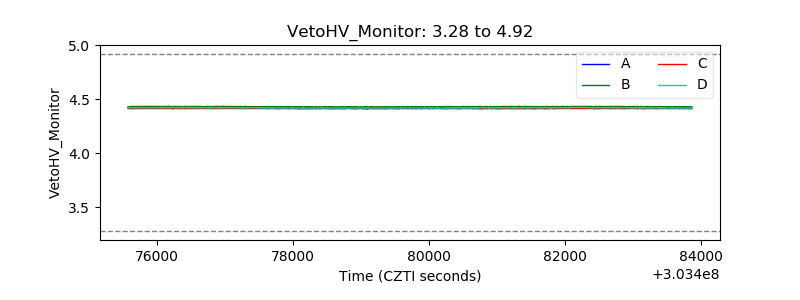 |
| Veto LLD | 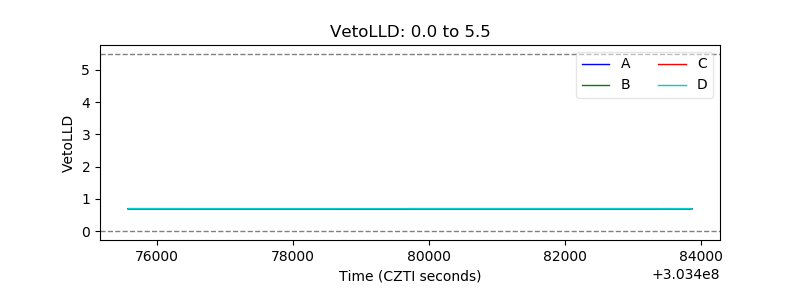 |
| Alpha Counter |  |
| _CPM_Rate | 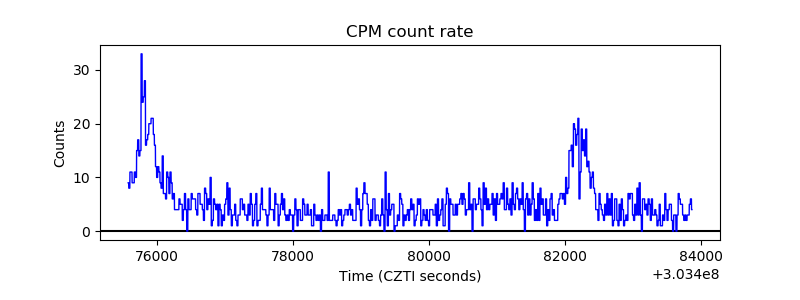 |
| CZT Counter | 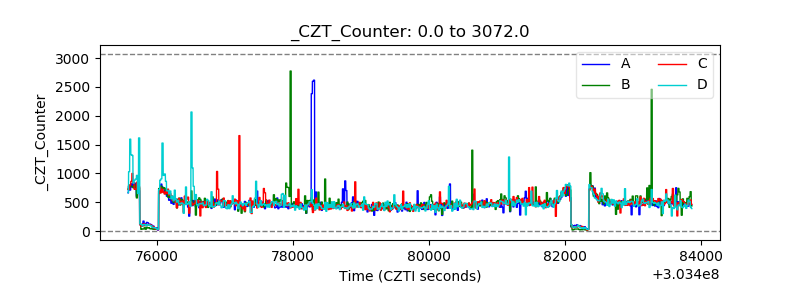 |
| +2.5 Volts monitor | 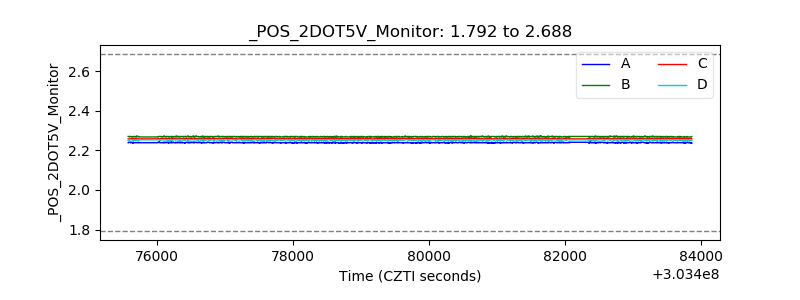 |
| +5 Volts monitor | 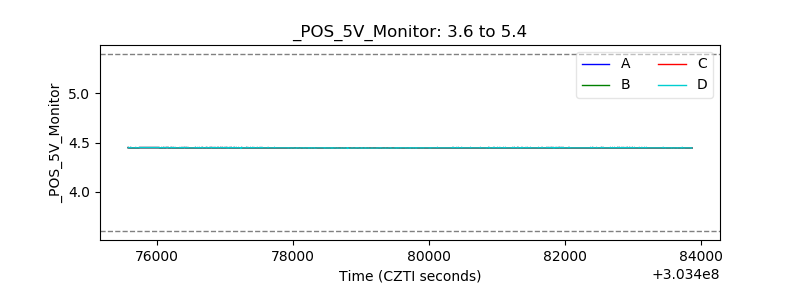 |
| _ROLL_ROT | 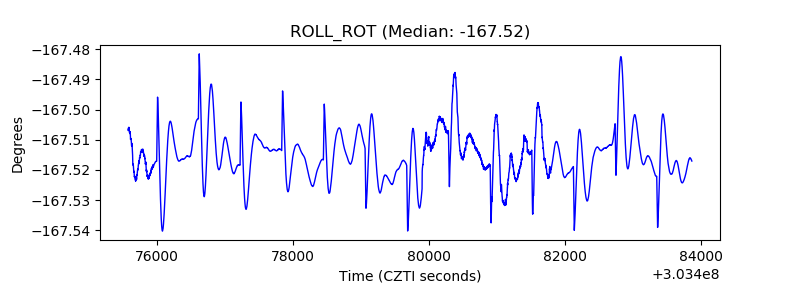 |
| _Roll_DEC | 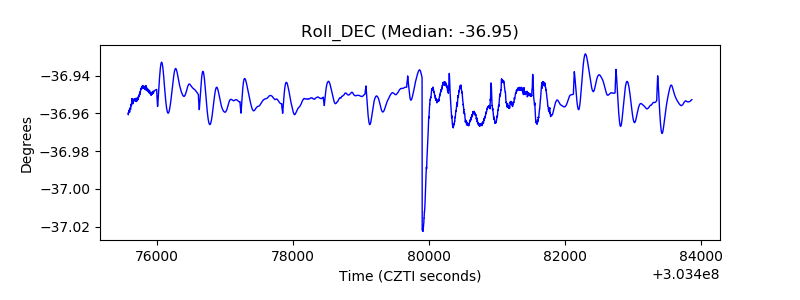 |
| _Roll_RA | 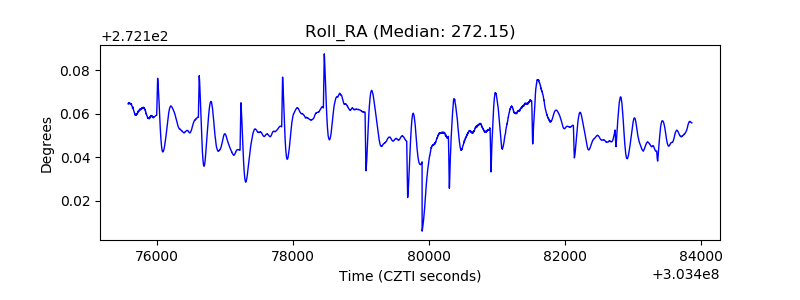 |
| Veto Counter | 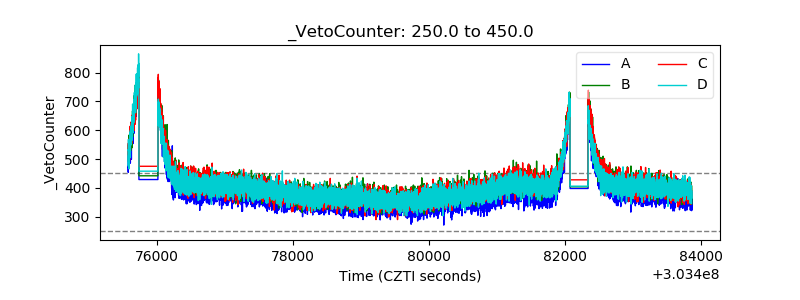 |