| Param | Original file | Final file |
|---|---|---|
| Filename | modeM0/AS1T03_131T01_9000003090_20965cztM0_level2.evt | modeM0/AS1T03_131T01_9000003090_20965cztM0_level2_quad_clean.evt |
| Size (bytes) | 514,500,480 | 101,675,520 |
| Size | 490.7 MB | 97.0 MB |
| Events in quadrant A | 3,520,652 | 647,009 |
| Events in quadrant B | 3,897,704 | 654,761 |
| Events in quadrant C | 3,650,316 | 640,602 |
| Events in quadrant D | 4,008,309 | 619,622 |
| Mode SS | |||
|---|---|---|---|
| Quadrant | BADHDUFLAG | Total packets | Discarded packets |
| A | 0 | 150 | 0 |
| B | 0 | 150 | 0 |
| C | 0 | 150 | 0 |
| D | 0 | 150 | 0 |
| Mode M9 | |||
|---|---|---|---|
| Quadrant | BADHDUFLAG | Total packets | Discarded packets |
| A | 0 | 4 | 0 |
| B | 0 | 4 | 0 |
| C | 0 | 4 | 0 |
| D | 0 | 4 | 0 |
| Mode M0 | |||
|---|---|---|---|
| Quadrant | BADHDUFLAG | Total packets | Discarded packets |
| A | 0 | 15257 | 2 |
| B | 0 | 16150 | 2 |
| C | 0 | 15462 | 2 |
| D | 0 | 16763 | 2 |
| Quadrant | Total seconds | Saturated seconds | Saturation percentage |
|---|---|---|---|
| A | 7434 | 98 | 1.318267% |
| B | 7435 | 129 | 1.735037% |
| C | 7435 | 132 | 1.775387% |
| D | 7435 | 105 | 1.412239% |
Noise dominated data is calculated using 1-second bins in cleaned event files. If a bin has >2000 counts, and if more than 50% of those come from <1% of pixels, then it is considered to be noise-dominated and hence unusable.
| Quadrant | # 1 sec bins | Bins with >0 counts | Bins with >2000 counts | High rate bins dominated by noise | Noise dominated (total time) | Noise dominated (detector-on time) | Marked lightcurve |
|---|---|---|---|---|---|---|---|
| A | 7844 | 7435 | 0 | 0 | 0.00% | 0.00% |  |
| B | 7845 | 7436 | 10 | 10 | 0.13% | 0.13% |  |
| C | 7845 | 7436 | 0 | 0 | 0.00% | 0.00% | 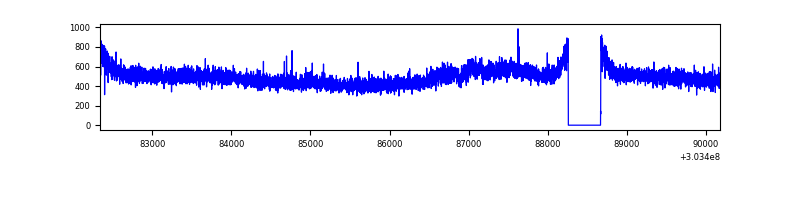 |
| D | 7845 | 7436 | 51 | 51 | 0.65% | 0.69% | 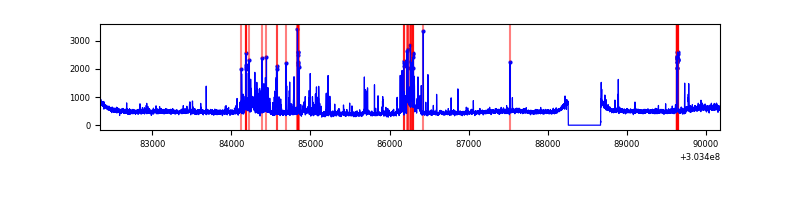 |
Top three noisy pixels from each quadrant. If the there are fewer than three noisy pixels in the level2.evt file, extra rows are filled as -1
| Pixel properties | Quadrant properties | ||||||
|---|---|---|---|---|---|---|---|
| Quadrant | DetID | PixID | Counts | Sigma | Mean | Median | Sigma |
| A | 0 | 226 | 7966 | 38.14 | 915 | 892 | 185.5 |
| A | 3 | 137 | 7461 | 35.41 | 915 | 892 | 185.5 |
| A | 12 | 194 | 6595 | 30.74 | 915 | 892 | 185.5 |
| B | 0 | 189 | 92362 | 525.63 | 911 | 885 | 174.0 |
| B | 7 | 220 | 80261 | 456.1 | 911 | 885 | 174.0 |
| B | 0 | 190 | 51238 | 289.33 | 911 | 885 | 174.0 |
| C | 14 | 238 | 136036 | 655.92 | 877 | 884 | 206.0 |
| C | 10 | 91 | 75981 | 364.46 | 877 | 884 | 206.0 |
| C | 3 | 233 | 14251 | 64.87 | 877 | 884 | 206.0 |
| D | 1 | 239 | 265944 | 1222.26 | 889 | 865 | 216.9 |
| D | 1 | 52 | 160973 | 738.25 | 889 | 865 | 216.9 |
| D | 13 | 174 | 97022 | 443.37 | 889 | 865 | 216.9 |
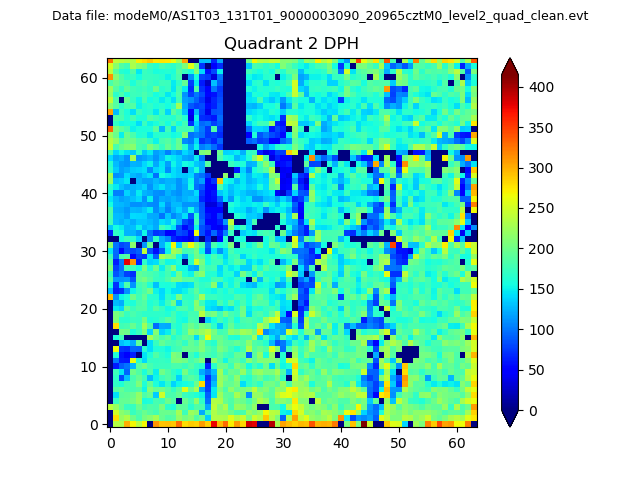
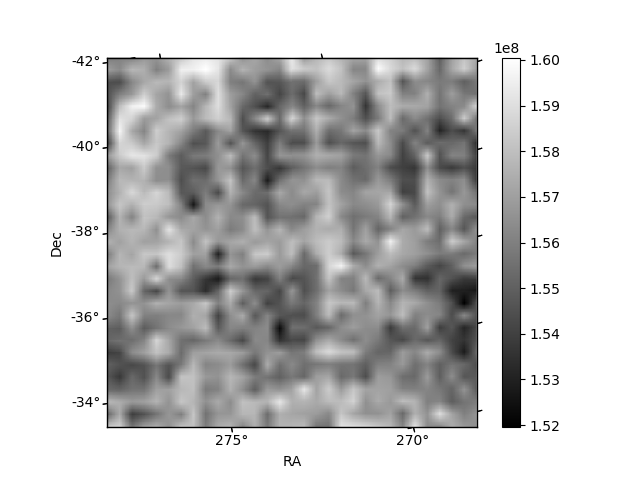
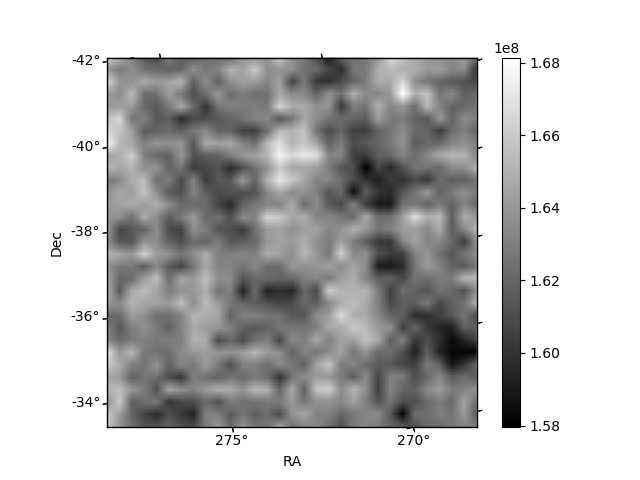
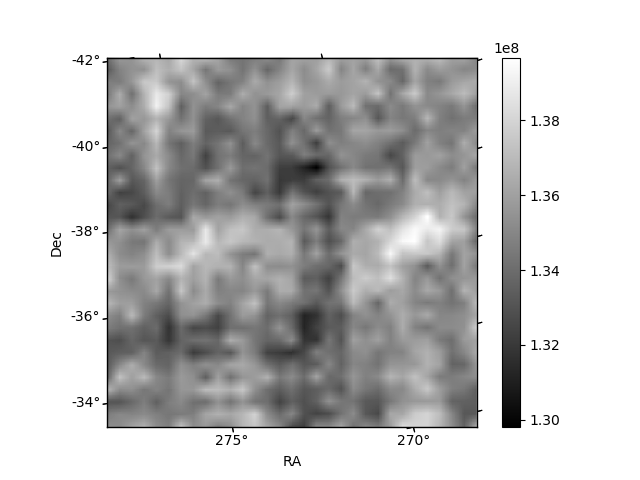
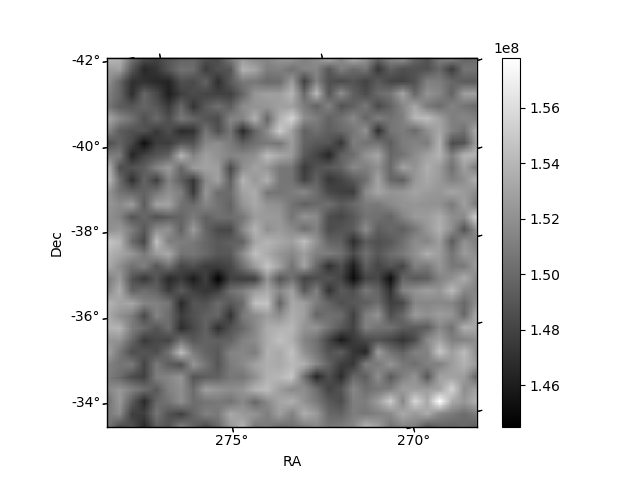
Histogram calculated using DETX and DETY for each event in the final _common_clean file
| Quadrant A | 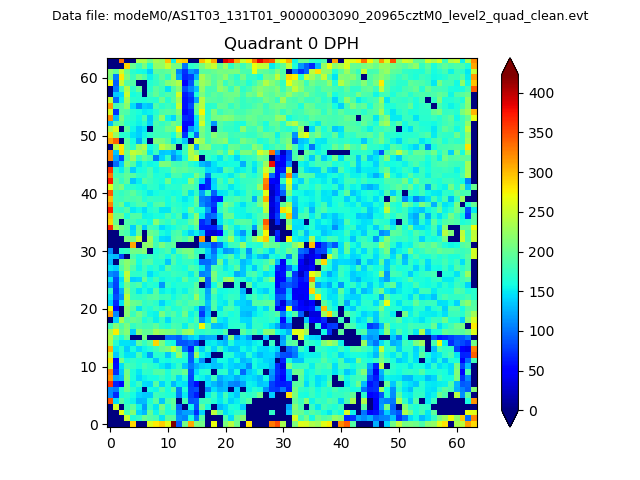 |
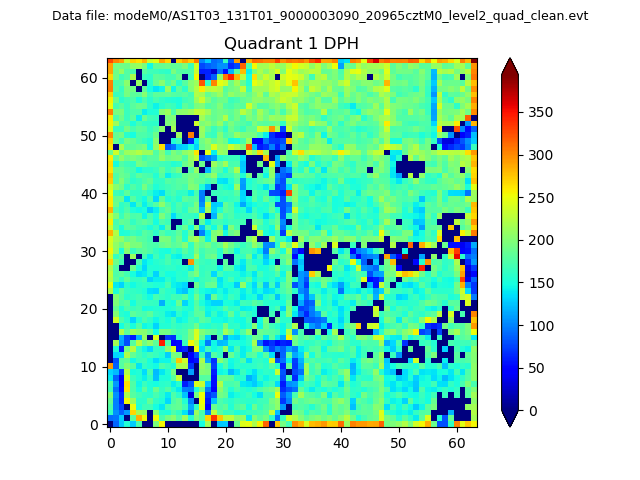 |
Quadrant B |
|---|---|---|---|
| Quadrant D | 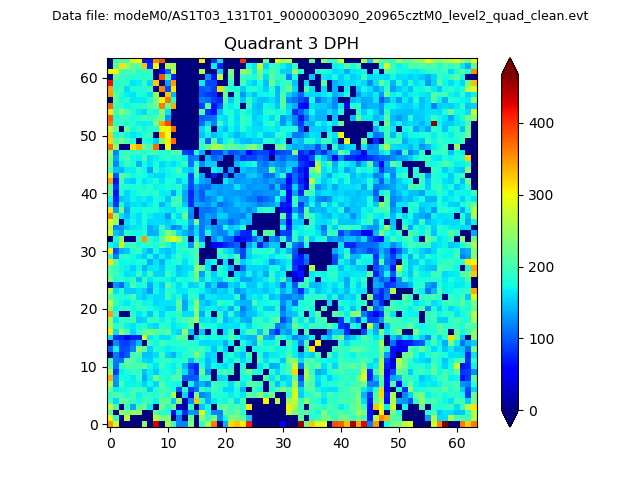 |
 |
Quadrant C |
| Plot type | Count rate plots | Images |
|---|---|---|
| Comparison with Poisson distribution Blue bars denote a histogram of data divided into 1 sec bins. Red curve is a Poisson curve with rate = median count rate of data. |
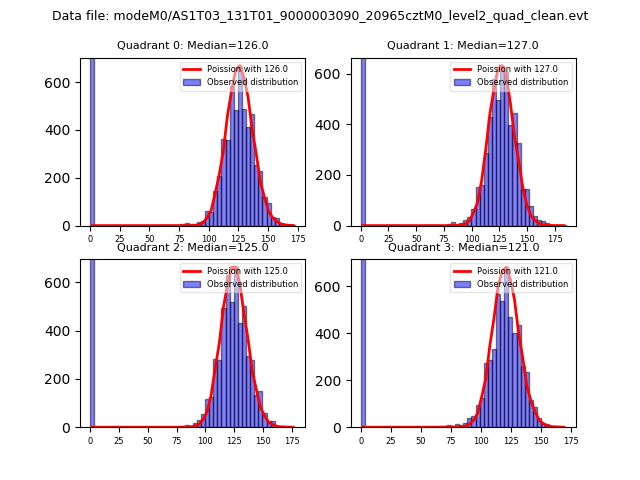 |
 |
| Quadrant-wise count rates Data is divided into 100 sec bins |
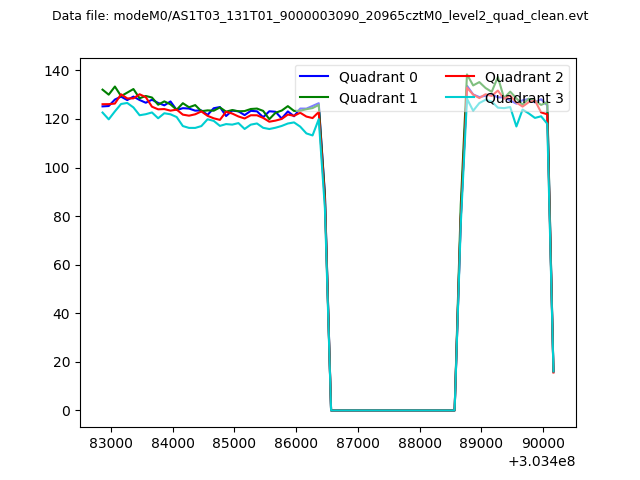 |
|
| Module-wise count rates for Quadrant A Data is divided into 100 sec bins |
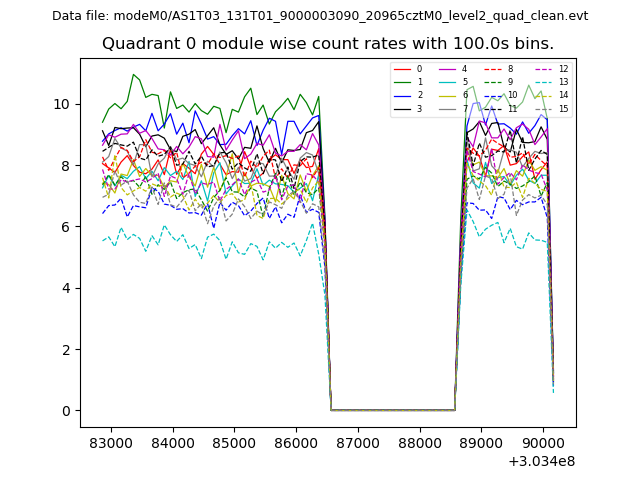 |
 |
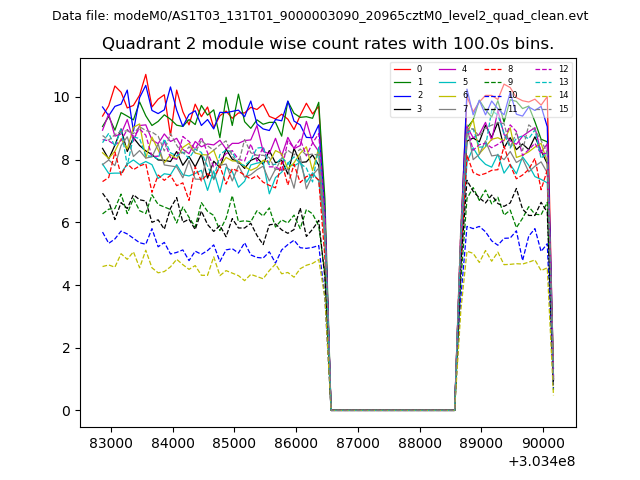
| Module-wise count rates for Quadrant B Data is divided into 100 sec bins |
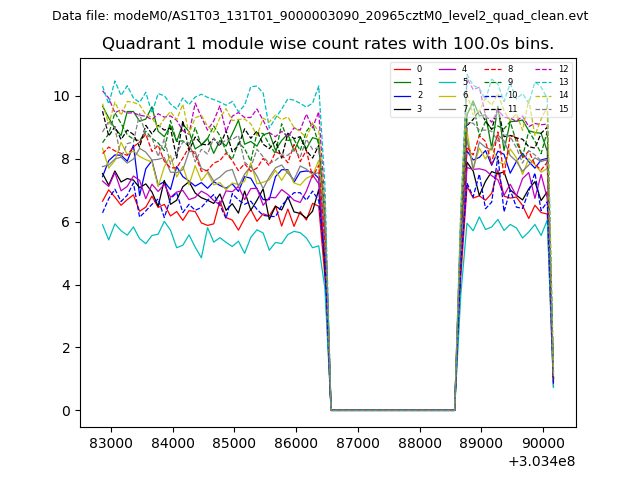 |
 |
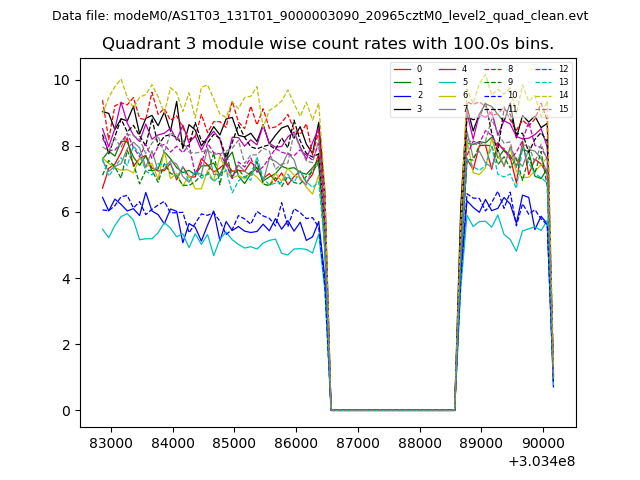
| Module-wise count rates for Quadrant C Data is divided into 100 sec bins |
 |
 |
| Module-wise count rates for Quadrant D Data is divided into 100 sec bins |
 |
 |
| Parameter | Plot |
|---|---|
| CZT HV Monitor | 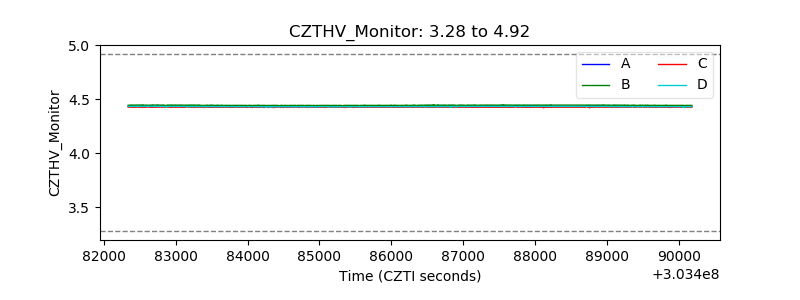 |
| D_VDD |  |
| Temperature 1 | 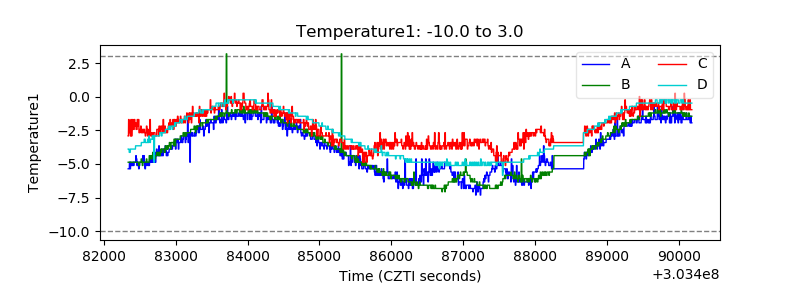 |
| Veto HV Monitor |  |
| Veto LLD | 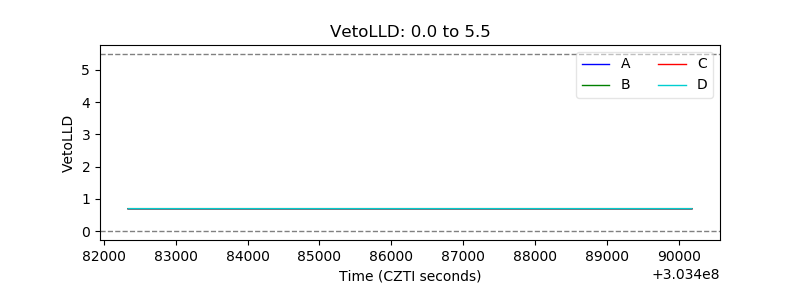 |
| Alpha Counter | 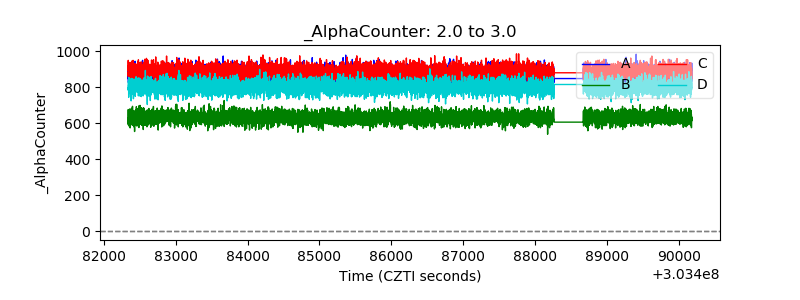 |
| _CPM_Rate | 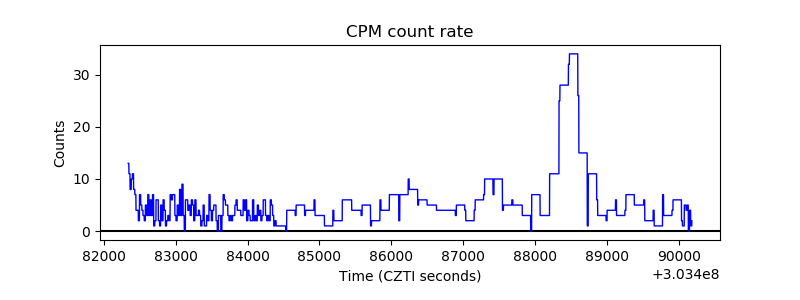 |
| CZT Counter | 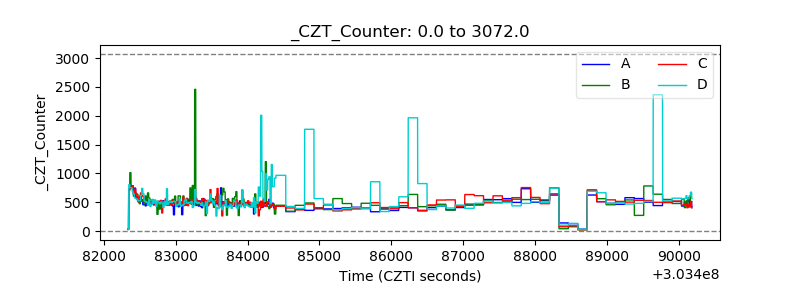 |
| +2.5 Volts monitor |  |
| +5 Volts monitor |  |
| _ROLL_ROT | 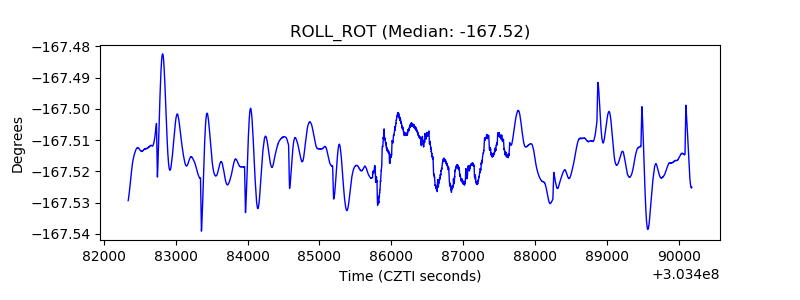 |
| _Roll_DEC | 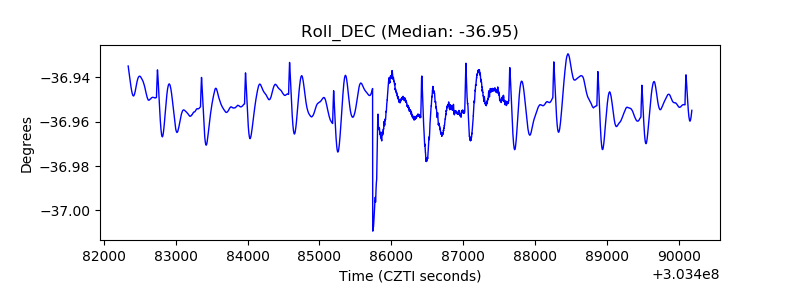 |
| _Roll_RA | 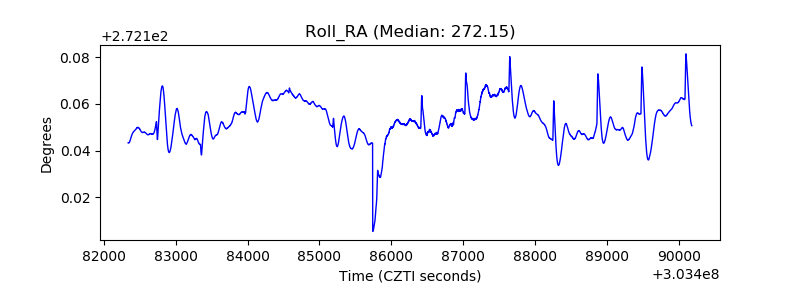 |
| Veto Counter | 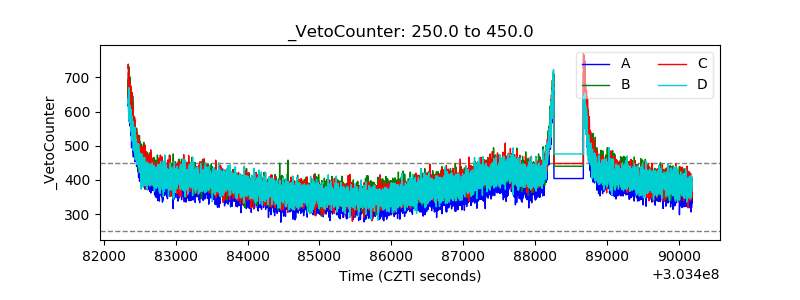 |