| Param | Original file | Final file |
|---|---|---|
| Filename | modeM0/AS1T03_131T01_9000003090_20968cztM0_level2.evt | modeM0/AS1T03_131T01_9000003090_20968cztM0_level2_quad_clean.evt |
| Size (bytes) | 503,582,400 | 91,416,960 |
| Size | 480.3 MB | 87.2 MB |
| Events in quadrant A | 3,137,719 | 587,890 |
| Events in quadrant B | 3,987,501 | 582,184 |
| Events in quadrant C | 3,223,107 | 576,877 |
| Events in quadrant D | 4,446,824 | 553,193 |
| Mode SS | |||
|---|---|---|---|
| Quadrant | BADHDUFLAG | Total packets | Discarded packets |
| A | 0 | 134 | 0 |
| B | 0 | 134 | 0 |
| C | 0 | 134 | 0 |
| D | 0 | 134 | 0 |
| Mode M9 | |||
|---|---|---|---|
| Quadrant | BADHDUFLAG | Total packets | Discarded packets |
| A | 0 | 12 | 0 |
| B | 0 | 13 | 0 |
| C | 0 | 13 | 0 |
| D | 0 | 13 | 0 |
| Mode M0 | |||
|---|---|---|---|
| Quadrant | BADHDUFLAG | Total packets | Discarded packets |
| A | 0 | 13749 | 2 |
| B | 0 | 16204 | 2 |
| C | 0 | 13886 | 2 |
| D | 0 | 17659 | 2 |
| Quadrant | Total seconds | Saturated seconds | Saturation percentage |
|---|---|---|---|
| A | 6723 | 18 | 0.267738% |
| B | 6723 | 272 | 4.045813% |
| C | 6723 | 38 | 0.565224% |
| D | 6722 | 168 | 2.499256% |
Noise dominated data is calculated using 1-second bins in cleaned event files. If a bin has >2000 counts, and if more than 50% of those come from <1% of pixels, then it is considered to be noise-dominated and hence unusable.
| Quadrant | # 1 sec bins | Bins with >0 counts | Bins with >2000 counts | High rate bins dominated by noise | Noise dominated (total time) | Noise dominated (detector-on time) | Marked lightcurve |
|---|---|---|---|---|---|---|---|
| A | 7638 | 6724 | 1 | 1 | 0.01% | 0.01% | 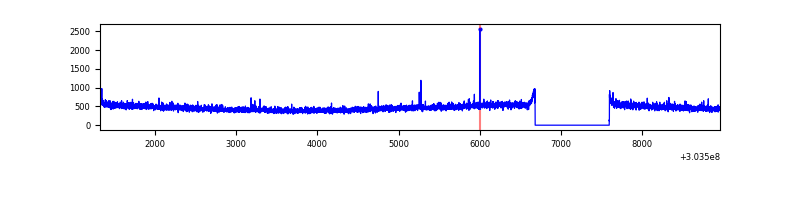 |
| B | 7638 | 6724 | 164 | 164 | 2.15% | 2.44% | 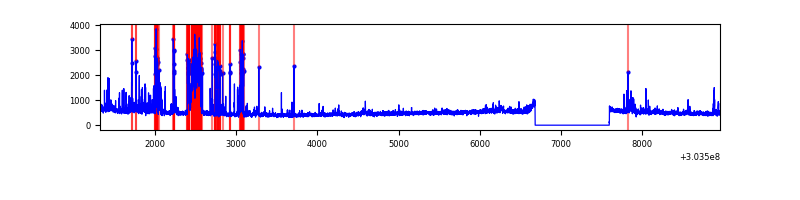 |
| C | 7638 | 6724 | 0 | 0 | 0.00% | 0.00% | 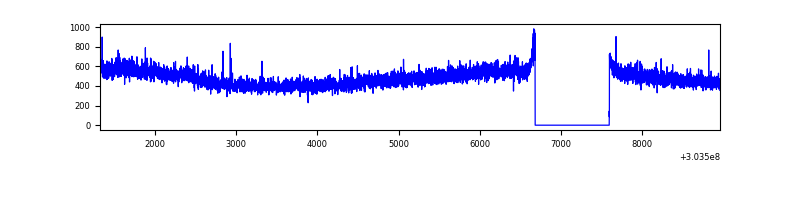 |
| D | 7637 | 6723 | 172 | 172 | 2.25% | 2.56% | 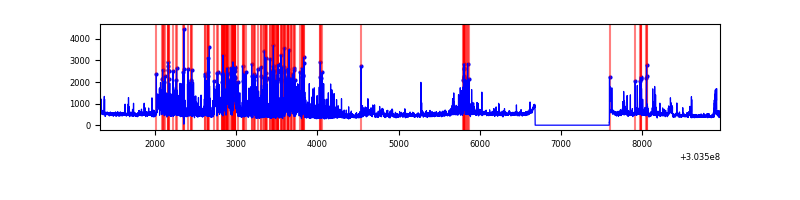 |
Top three noisy pixels from each quadrant. If the there are fewer than three noisy pixels in the level2.evt file, extra rows are filled as -1
| Pixel properties | Quadrant properties | ||||||
|---|---|---|---|---|---|---|---|
| Quadrant | DetID | PixID | Counts | Sigma | Mean | Median | Sigma |
| A | 2 | 79 | 8583 | 46.97 | 812 | 793 | 165.8 |
| A | 0 | 226 | 6993 | 37.39 | 812 | 793 | 165.8 |
| A | 3 | 137 | 6591 | 34.96 | 812 | 793 | 165.8 |
| B | 7 | 220 | 638387 | 4118.03 | 801 | 781 | 154.8 |
| B | 0 | 189 | 98856 | 633.43 | 801 | 781 | 154.8 |
| B | 3 | 64 | 54900 | 349.53 | 801 | 781 | 154.8 |
| C | 14 | 238 | 119222 | 649.22 | 772 | 778 | 182.4 |
| C | 10 | 91 | 68394 | 370.62 | 772 | 778 | 182.4 |
| C | 8 | 128 | 10802 | 54.94 | 772 | 778 | 182.4 |
| D | 7 | 238 | 594294 | 3118.17 | 777 | 755 | 190.3 |
| D | 1 | 52 | 448901 | 2354.34 | 777 | 755 | 190.3 |
| D | 7 | 223 | 233717 | 1223.87 | 777 | 755 | 190.3 |
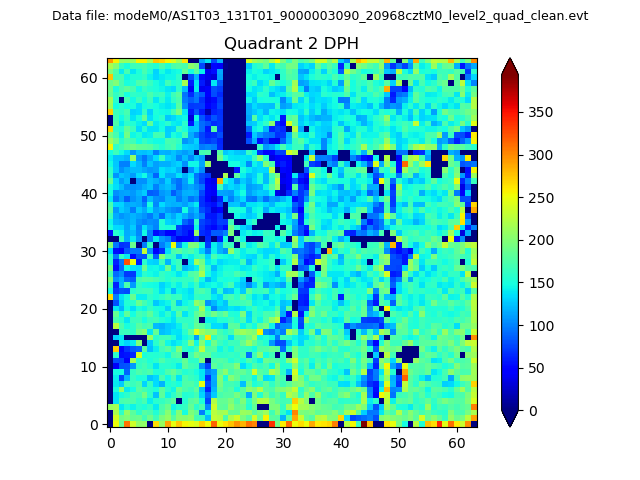
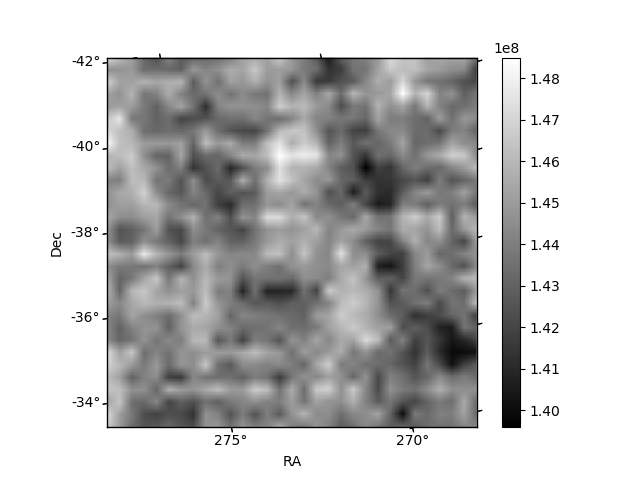
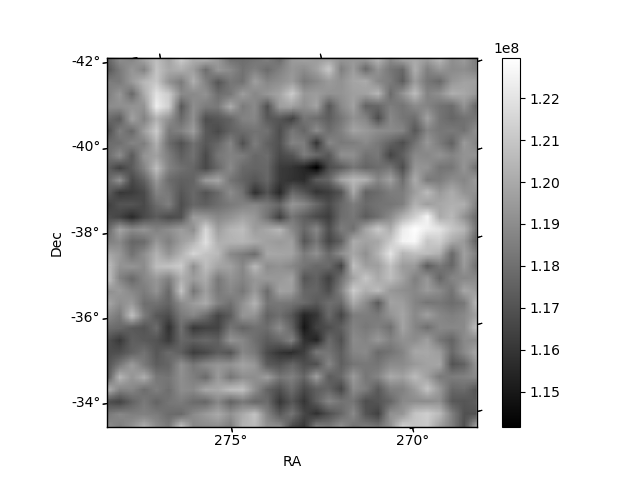
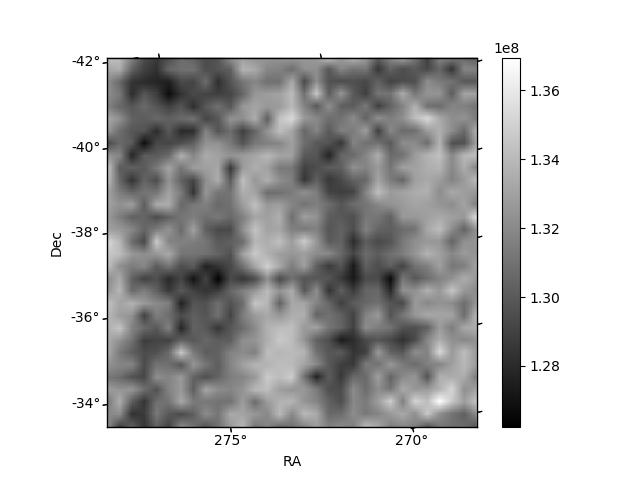
Histogram calculated using DETX and DETY for each event in the final _common_clean file
| Quadrant A | 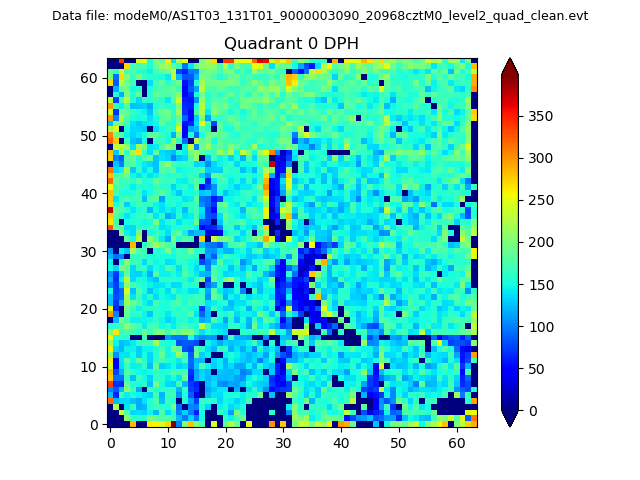 |
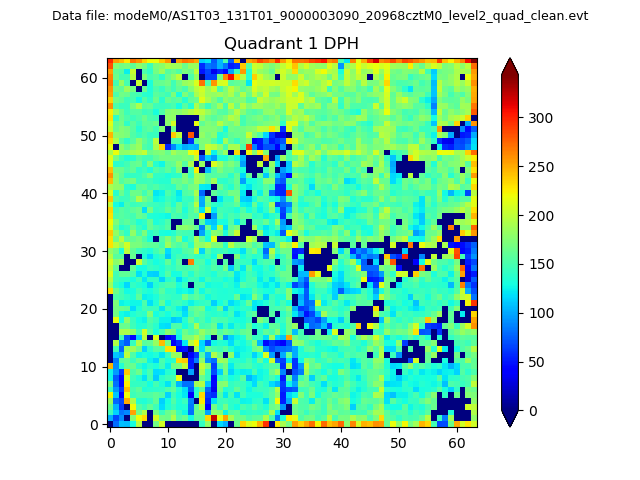 |
Quadrant B |
|---|---|---|---|
| Quadrant D | 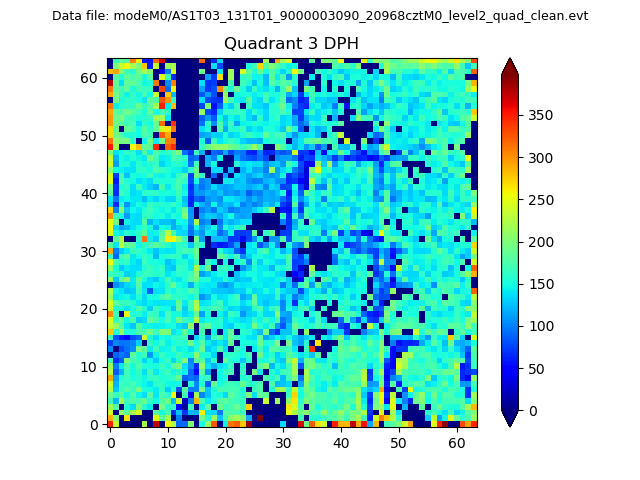 |
 |
Quadrant C |
| Plot type | Count rate plots | Images |
|---|---|---|
| Comparison with Poisson distribution Blue bars denote a histogram of data divided into 1 sec bins. Red curve is a Poisson curve with rate = median count rate of data. |
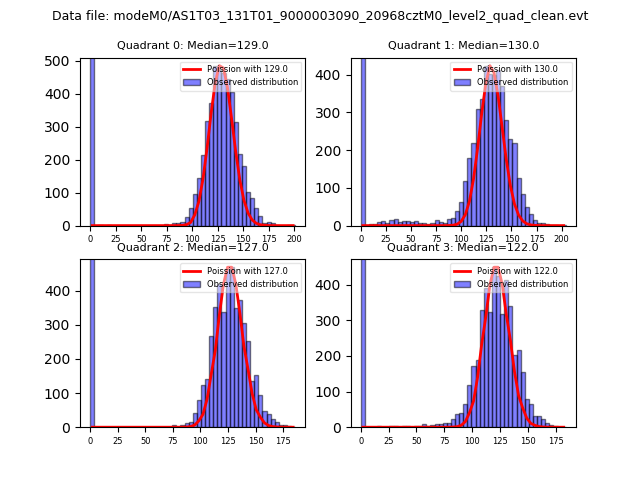 |
 |
| Quadrant-wise count rates Data is divided into 100 sec bins |
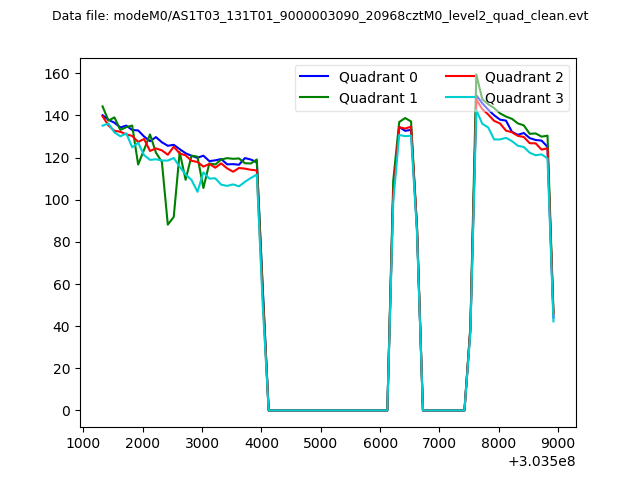 |
|
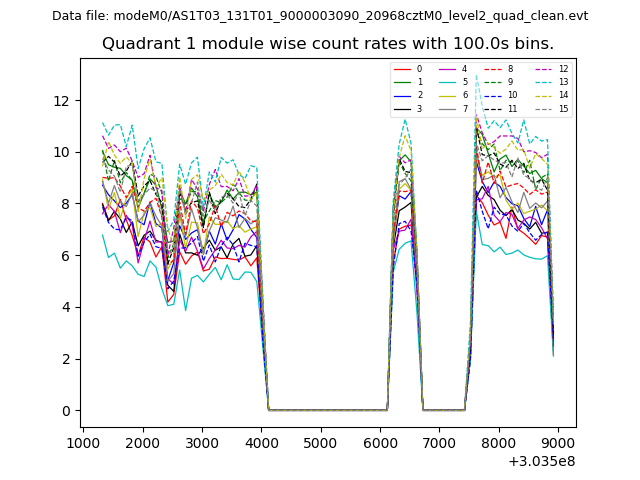
| Module-wise count rates for Quadrant A Data is divided into 100 sec bins |
 |
 |
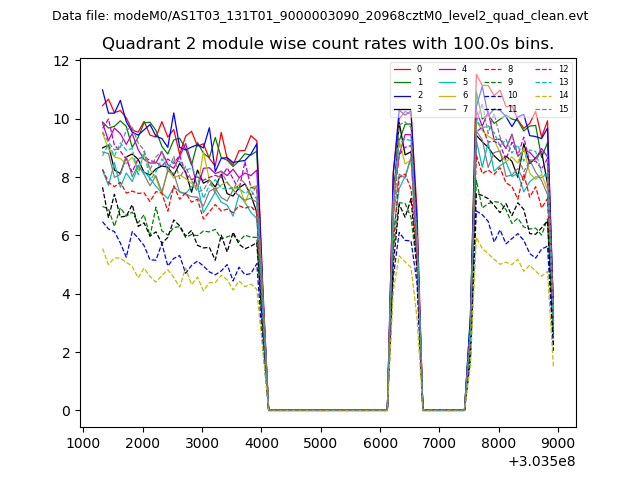
| Module-wise count rates for Quadrant B Data is divided into 100 sec bins |
 |
 |
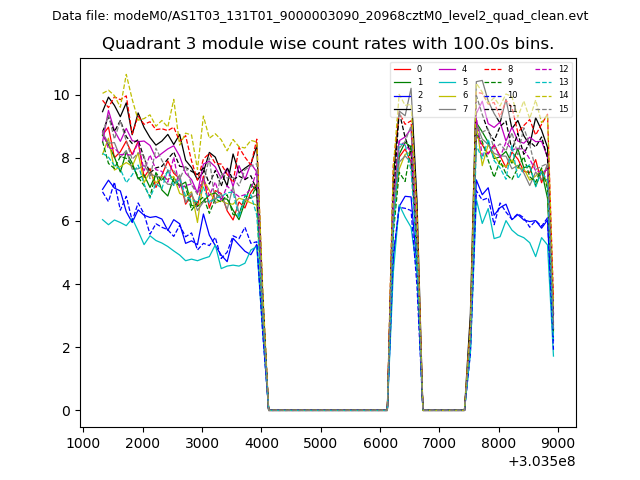
| Module-wise count rates for Quadrant C Data is divided into 100 sec bins |
 |
 |
| Module-wise count rates for Quadrant D Data is divided into 100 sec bins |
 |
 |
| Parameter | Plot |
|---|---|
| CZT HV Monitor | 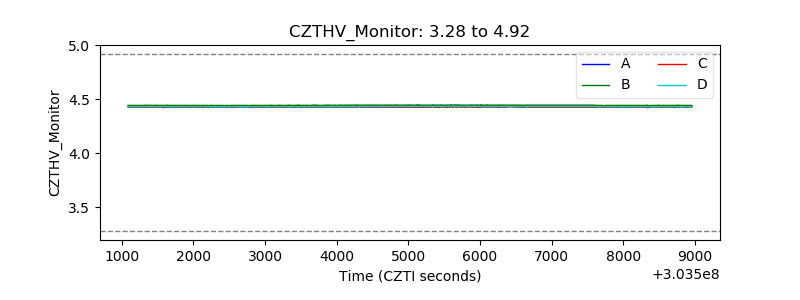 |
| D_VDD |  |
| Temperature 1 | 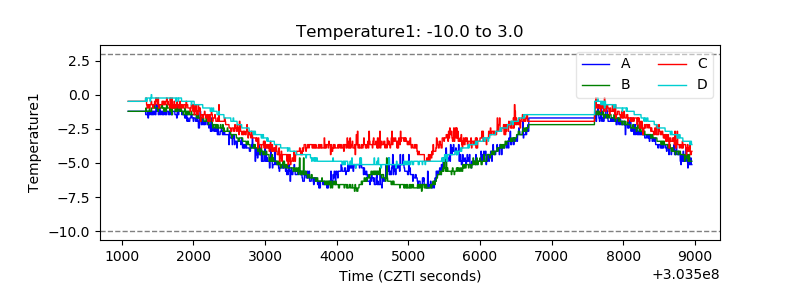 |
| Veto HV Monitor |  |
| Veto LLD | 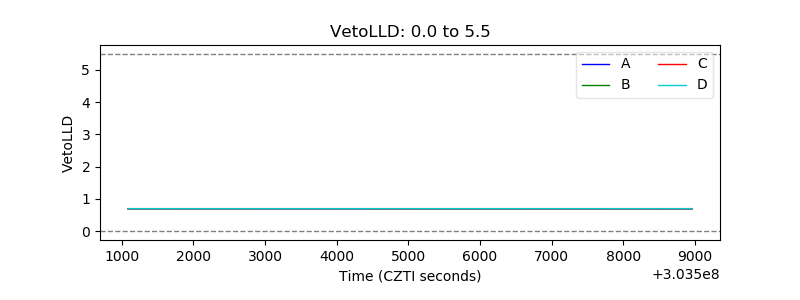 |
| Alpha Counter | 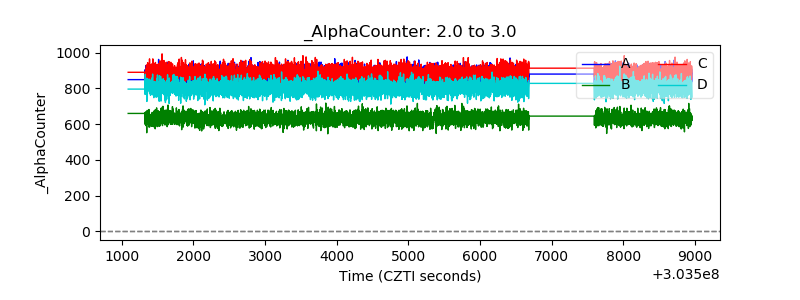 |
| _CPM_Rate | 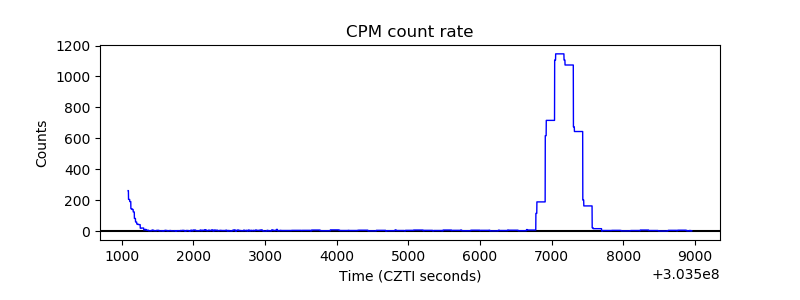 |
| CZT Counter | 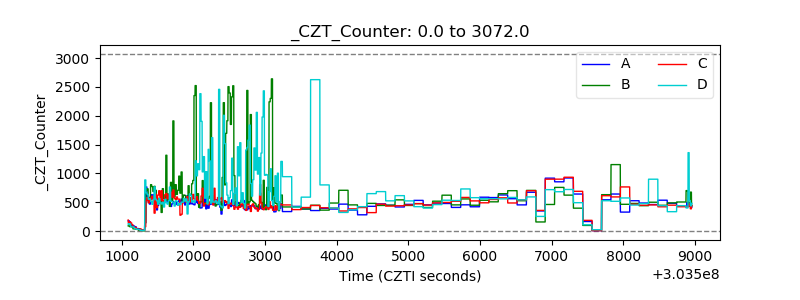 |
| +2.5 Volts monitor | 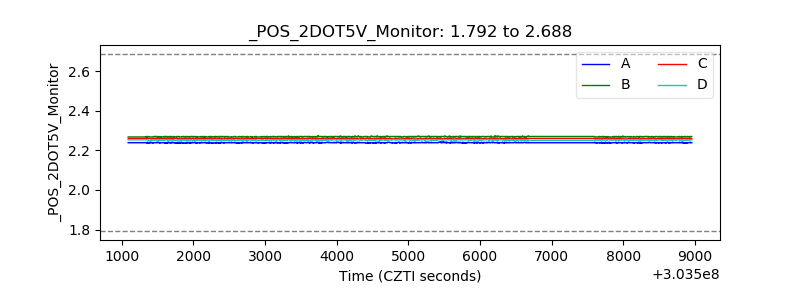 |
| +5 Volts monitor |  |
| _ROLL_ROT | 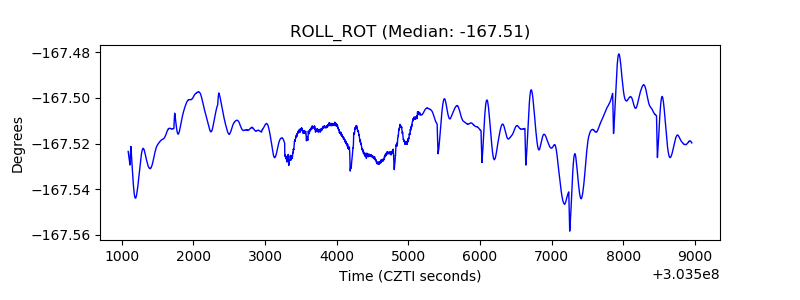 |
| _Roll_DEC | 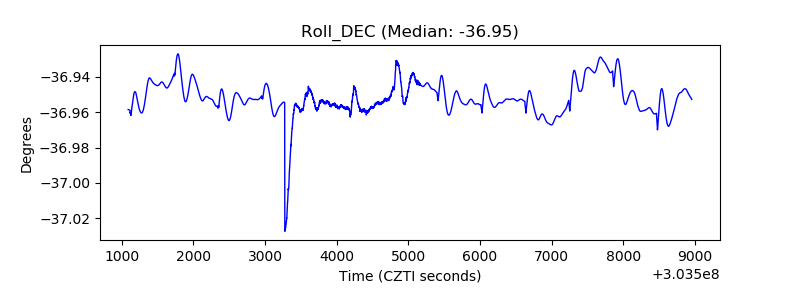 |
| _Roll_RA | 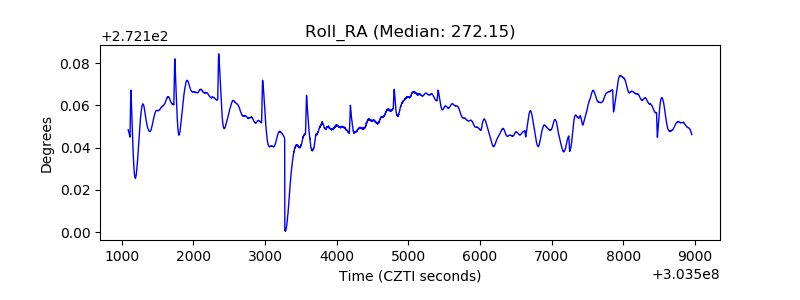 |
| Veto Counter | 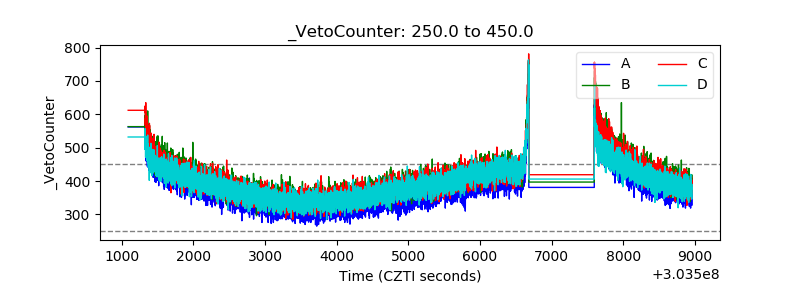 |