| Param | Original file | Final file |
|---|---|---|
| Filename | modeM0/AS1T03_131T01_9000003090_20969cztM0_level2.evt | modeM0/AS1T03_131T01_9000003090_20969cztM0_level2_quad_clean.evt |
| Size (bytes) | 447,390,720 | 89,965,440 |
| Size | 426.7 MB | 85.8 MB |
| Events in quadrant A | 3,027,084 | 577,228 |
| Events in quadrant B | 3,242,618 | 591,407 |
| Events in quadrant C | 3,058,555 | 568,566 |
| Events in quadrant D | 3,782,771 | 537,376 |
| Mode SS | |||
|---|---|---|---|
| Quadrant | BADHDUFLAG | Total packets | Discarded packets |
| A | 0 | 130 | 0 |
| B | 0 | 130 | 0 |
| C | 0 | 130 | 0 |
| D | 0 | 130 | 0 |
| Mode M9 | |||
|---|---|---|---|
| Quadrant | BADHDUFLAG | Total packets | Discarded packets |
| A | 0 | 13 | 0 |
| B | 0 | 13 | 0 |
| C | 0 | 14 | 0 |
| D | 0 | 14 | 0 |
| Mode M0 | |||
|---|---|---|---|
| Quadrant | BADHDUFLAG | Total packets | Discarded packets |
| A | 0 | 13225 | 2 |
| B | 0 | 13693 | 2 |
| C | 0 | 13216 | 2 |
| D | 0 | 15759 | 2 |
| Quadrant | Total seconds | Saturated seconds | Saturation percentage |
|---|---|---|---|
| A | 6451 | 26 | 0.403038% |
| B | 6451 | 34 | 0.527050% |
| C | 6451 | 40 | 0.620059% |
| D | 6450 | 177 | 2.744186% |
Noise dominated data is calculated using 1-second bins in cleaned event files. If a bin has >2000 counts, and if more than 50% of those come from <1% of pixels, then it is considered to be noise-dominated and hence unusable.
| Quadrant | # 1 sec bins | Bins with >0 counts | Bins with >2000 counts | High rate bins dominated by noise | Noise dominated (total time) | Noise dominated (detector-on time) | Marked lightcurve |
|---|---|---|---|---|---|---|---|
| A | 7521 | 6452 | 0 | 0 | 0.00% | 0.00% | 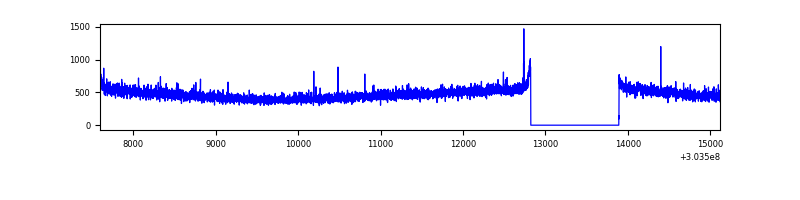 |
| B | 7521 | 6452 | 2 | 2 | 0.03% | 0.03% | 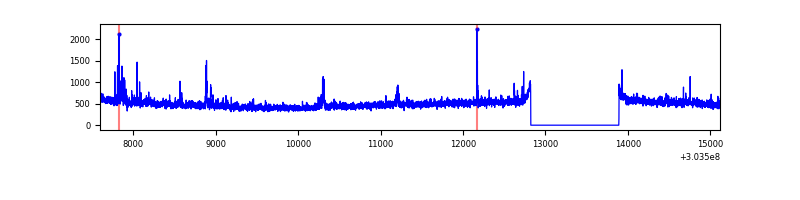 |
| C | 7521 | 6452 | 0 | 0 | 0.00% | 0.00% | 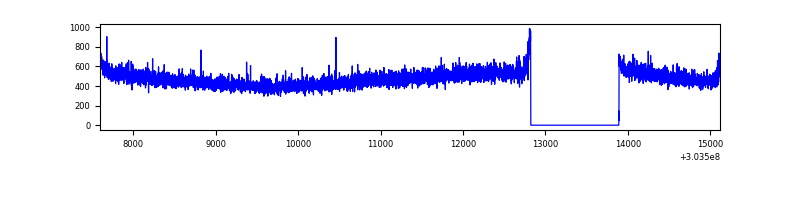 |
| D | 7520 | 6451 | 131 | 131 | 1.74% | 2.03% | 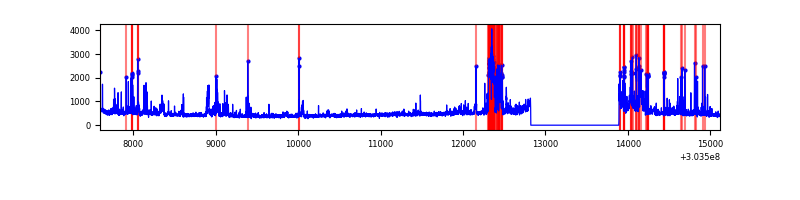 |
Top three noisy pixels from each quadrant. If the there are fewer than three noisy pixels in the level2.evt file, extra rows are filled as -1
| Pixel properties | Quadrant properties | ||||||
|---|---|---|---|---|---|---|---|
| Quadrant | DetID | PixID | Counts | Sigma | Mean | Median | Sigma |
| A | 0 | 226 | 6901 | 38.4 | 785 | 769 | 159.7 |
| A | 3 | 137 | 6483 | 35.78 | 785 | 769 | 159.7 |
| A | 12 | 194 | 5625 | 30.41 | 785 | 769 | 159.7 |
| B | 0 | 189 | 58490 | 376.99 | 789 | 770 | 153.1 |
| B | 0 | 190 | 36007 | 230.15 | 789 | 770 | 153.1 |
| B | 3 | 64 | 29936 | 190.5 | 789 | 770 | 153.1 |
| C | 14 | 238 | 118698 | 668.79 | 751 | 755 | 176.4 |
| C | 7 | 247 | 11303 | 59.81 | 751 | 755 | 176.4 |
| C | 13 | 61 | 5231 | 25.38 | 751 | 755 | 176.4 |
| D | 9 | 1 | 433336 | 2371.94 | 747 | 724 | 182.4 |
| D | 1 | 52 | 385001 | 2106.93 | 747 | 724 | 182.4 |
| D | 7 | 223 | 31821 | 170.5 | 747 | 724 | 182.4 |
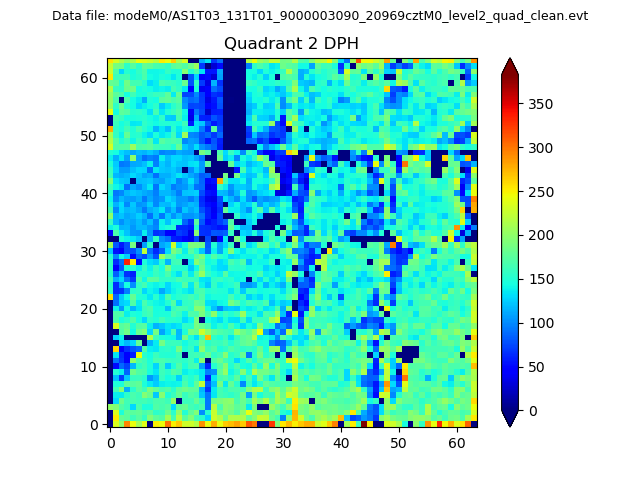
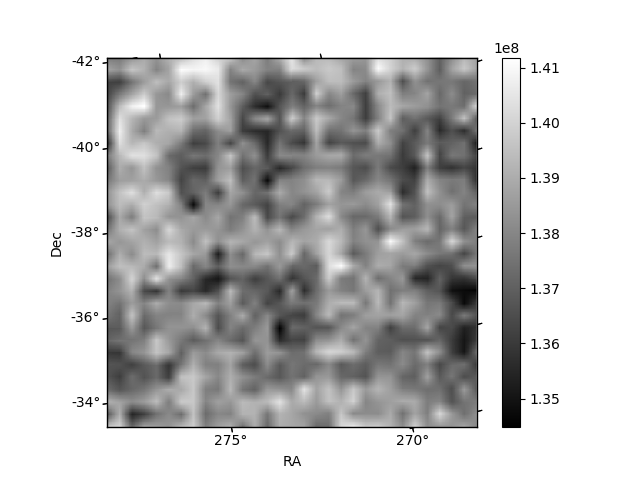
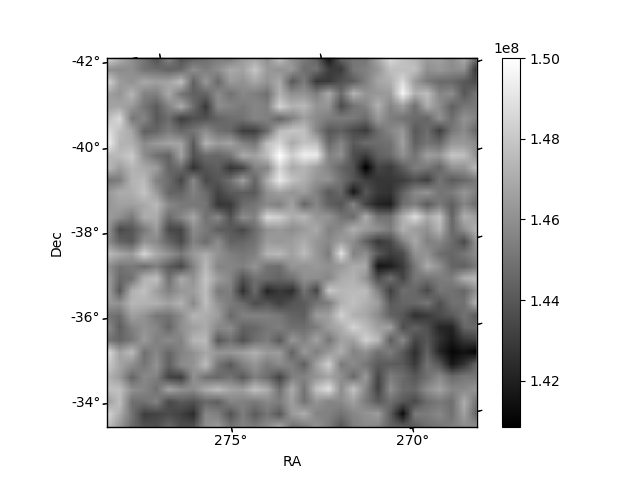
Histogram calculated using DETX and DETY for each event in the final _common_clean file
| Quadrant A | 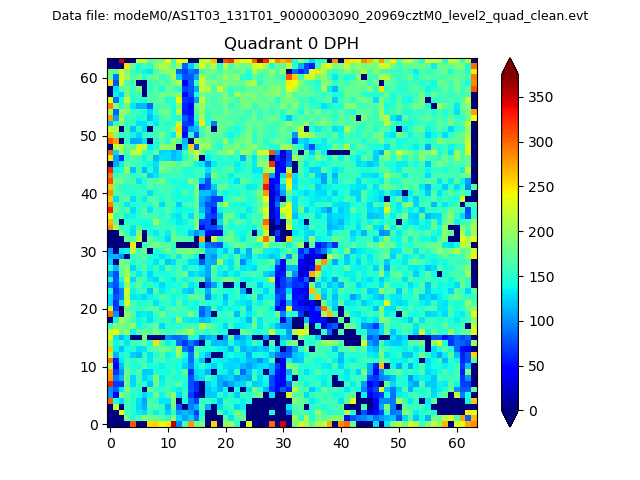 |
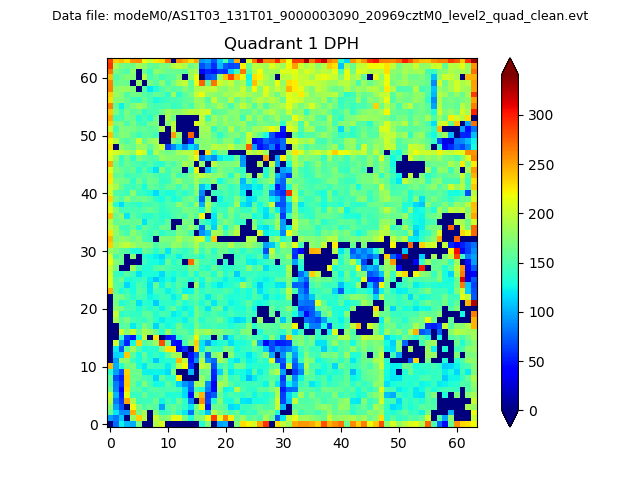 |
Quadrant B |
|---|---|---|---|
| Quadrant D | 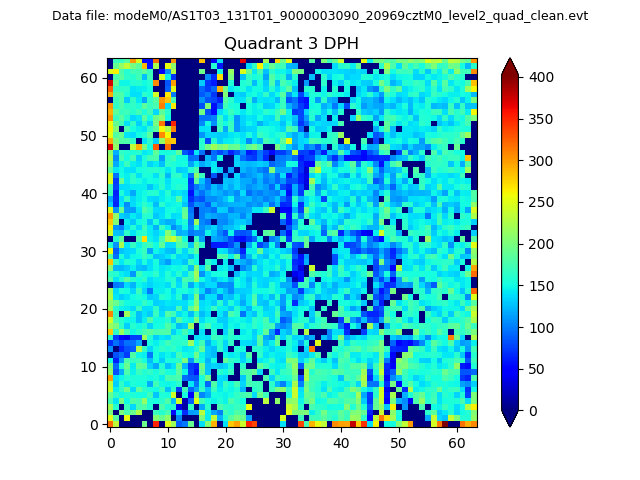 |
 |
Quadrant C |
| Plot type | Count rate plots | Images |
|---|---|---|
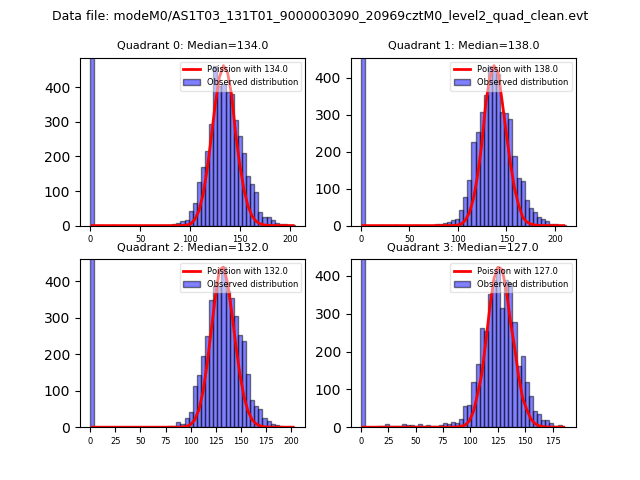
| Comparison with Poisson distribution Blue bars denote a histogram of data divided into 1 sec bins. Red curve is a Poisson curve with rate = median count rate of data. |
 |
 |
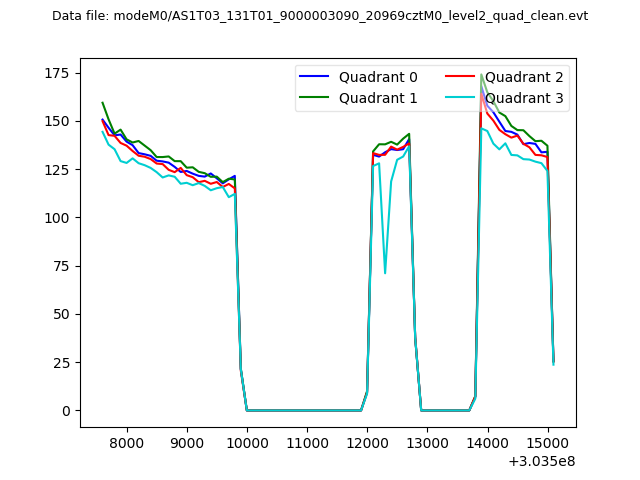
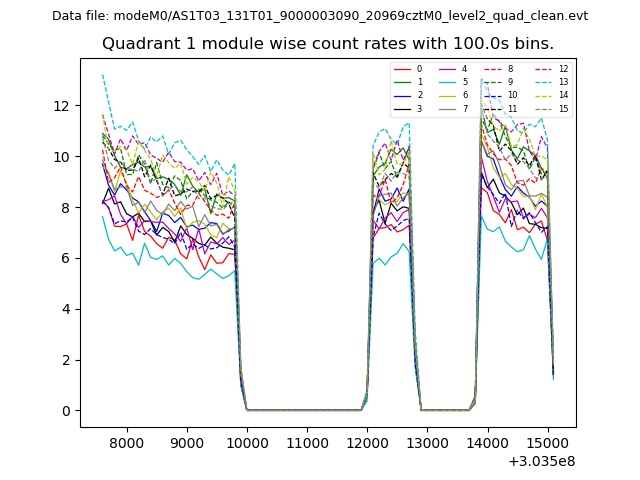
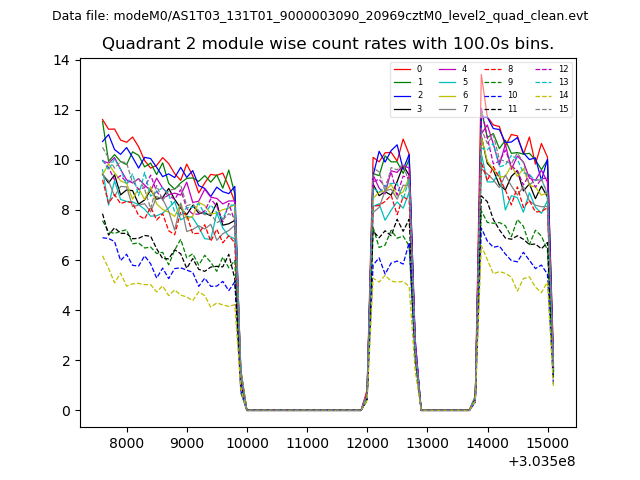
| Quadrant-wise count rates Data is divided into 100 sec bins |
 |
|
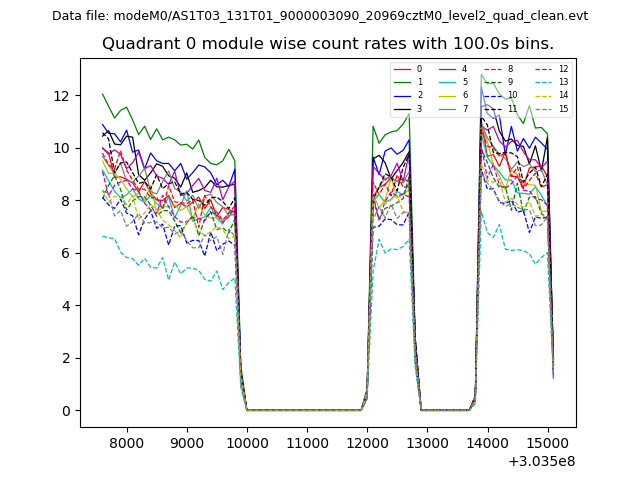
| Module-wise count rates for Quadrant A Data is divided into 100 sec bins |
 |
 |
| Module-wise count rates for Quadrant B Data is divided into 100 sec bins |
 |
 |
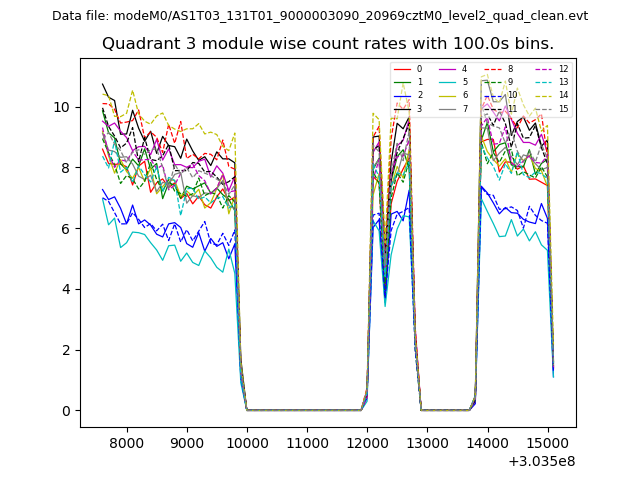
| Module-wise count rates for Quadrant C Data is divided into 100 sec bins |
 |
 |
| Module-wise count rates for Quadrant D Data is divided into 100 sec bins |
 |
 |
| Parameter | Plot |
|---|---|
| CZT HV Monitor | 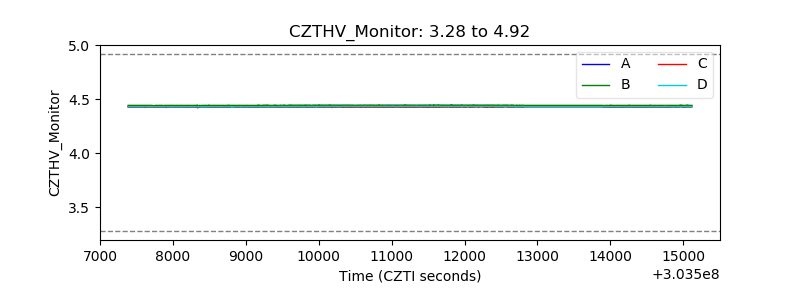 |
| D_VDD | 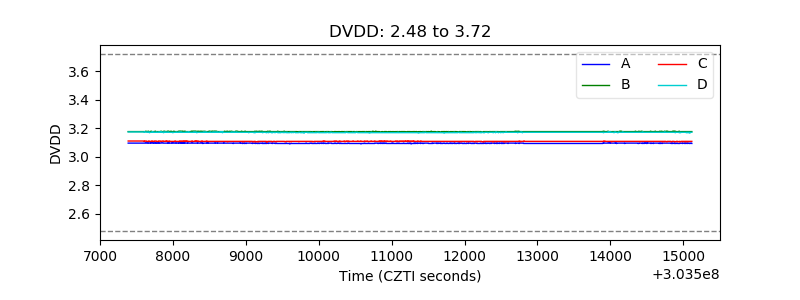 |
| Temperature 1 |  |
| Veto HV Monitor |  |
| Veto LLD |  |
| Alpha Counter | 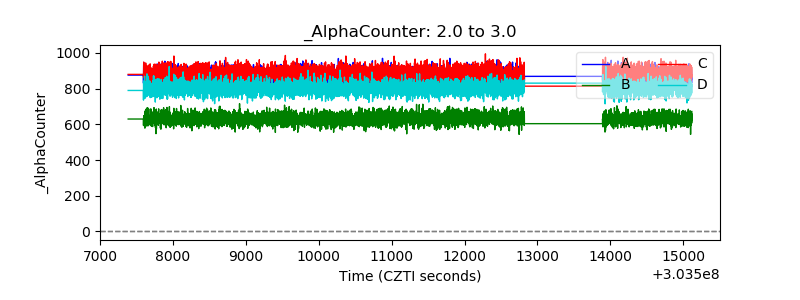 |
| _CPM_Rate | 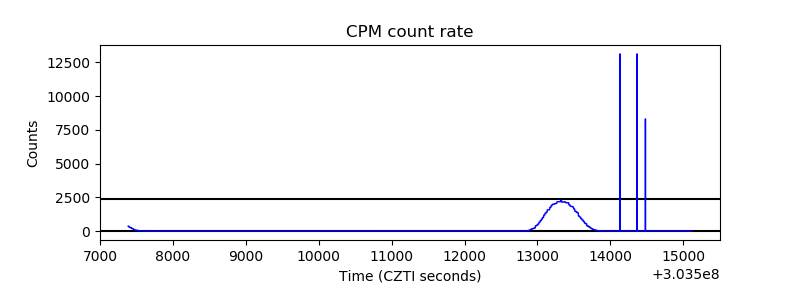 |
| CZT Counter | 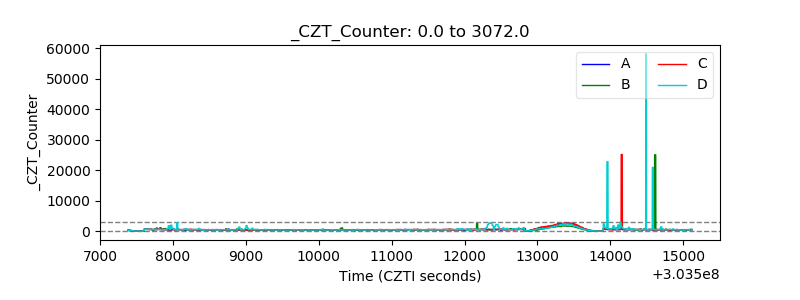 |
| +2.5 Volts monitor |  |
| +5 Volts monitor | 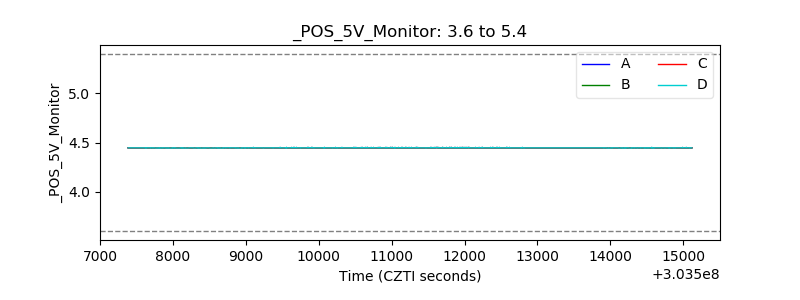 |
| _ROLL_ROT | 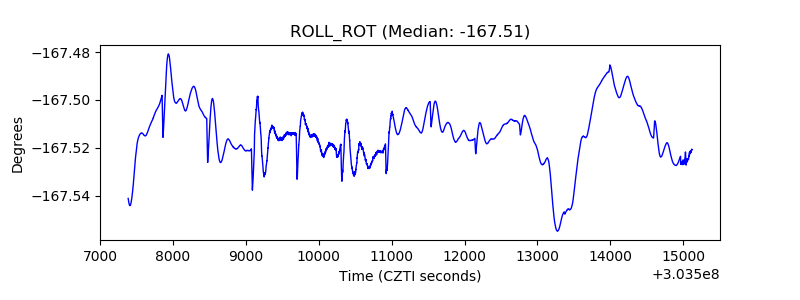 |
| _Roll_DEC | 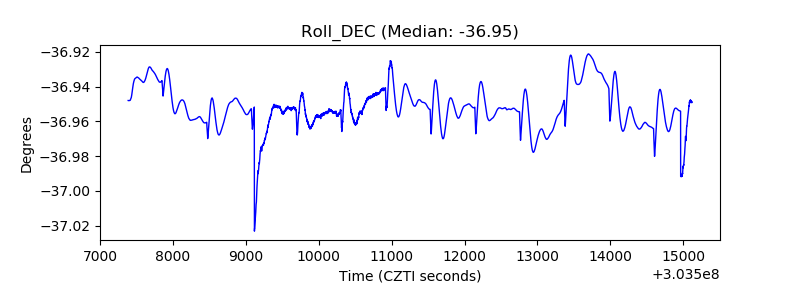 |
| _Roll_RA | 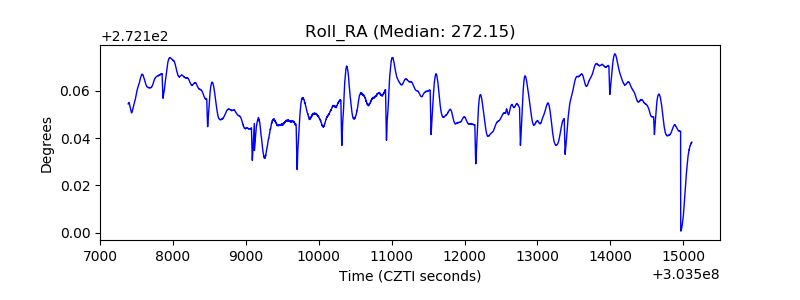 |
| Veto Counter | 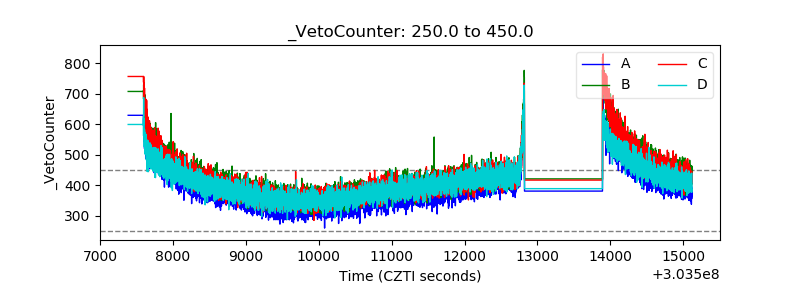 |