| Param | Original file | Final file |
|---|---|---|
| Filename | modeM0/AS1T03_131T01_9000003090_20973cztM0_level2.evt | modeM0/AS1T03_131T01_9000003090_20973cztM0_level2_quad_clean.evt |
| Size (bytes) | 501,477,120 | 83,689,920 |
| Size | 478.2 MB | 79.8 MB |
| Events in quadrant A | 3,254,876 | 526,712 |
| Events in quadrant B | 3,408,785 | 545,414 |
| Events in quadrant C | 3,359,838 | 524,931 |
| Events in quadrant D | 4,726,509 | 487,561 |
| Mode SS | |||
|---|---|---|---|
| Quadrant | BADHDUFLAG | Total packets | Discarded packets |
| A | 0 | 132 | 0 |
| B | 0 | 132 | 0 |
| C | 0 | 132 | 0 |
| D | 0 | 132 | 0 |
| Mode M9 | |||
|---|---|---|---|
| Quadrant | BADHDUFLAG | Total packets | Discarded packets |
| A | 0 | 17 | 0 |
| B | 0 | 18 | 0 |
| C | 0 | 18 | 0 |
| D | 0 | 18 | 0 |
| Mode M0 | |||
|---|---|---|---|
| Quadrant | BADHDUFLAG | Total packets | Discarded packets |
| A | 0 | 13436 | 2 |
| B | 0 | 13885 | 2 |
| C | 0 | 13634 | 2 |
| D | 0 | 18091 | 3 |
| Quadrant | Total seconds | Saturated seconds | Saturation percentage |
|---|---|---|---|
| A | 6442 | 27 | 0.419124% |
| B | 6442 | 43 | 0.667495% |
| C | 6442 | 60 | 0.931388% |
| D | 6441 | 374 | 5.806552% |
Noise dominated data is calculated using 1-second bins in cleaned event files. If a bin has >2000 counts, and if more than 50% of those come from <1% of pixels, then it is considered to be noise-dominated and hence unusable.
| Quadrant | # 1 sec bins | Bins with >0 counts | Bins with >2000 counts | High rate bins dominated by noise | Noise dominated (total time) | Noise dominated (detector-on time) | Marked lightcurve |
|---|---|---|---|---|---|---|---|
| A | 7797 | 6443 | 4 | 4 | 0.05% | 0.06% | 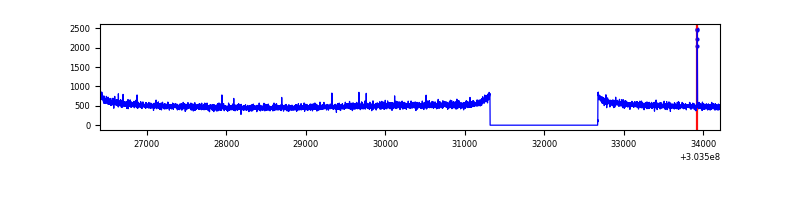 |
| B | 7797 | 6443 | 2 | 2 | 0.03% | 0.03% | 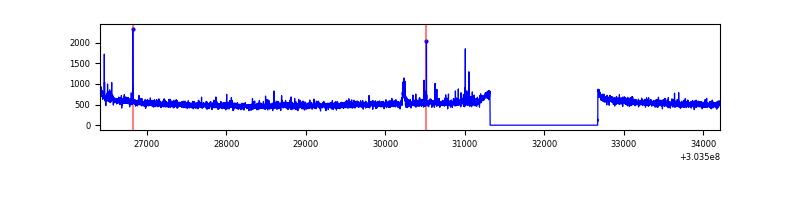 |
| C | 7797 | 6443 | 0 | 0 | 0.00% | 0.00% | 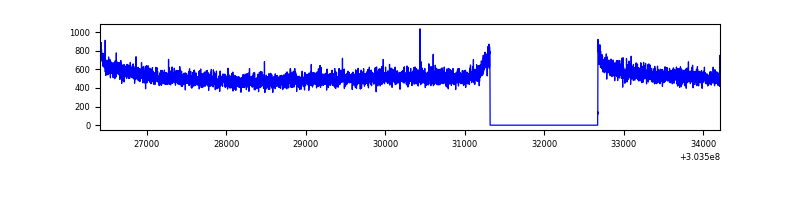 |
| D | 7796 | 6441 | 441 | 441 | 5.66% | 6.85% | 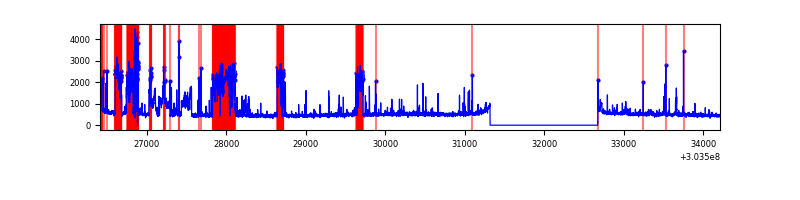 |
Top three noisy pixels from each quadrant. If the there are fewer than three noisy pixels in the level2.evt file, extra rows are filled as -1
| Pixel properties | Quadrant properties | ||||||
|---|---|---|---|---|---|---|---|
| Quadrant | DetID | PixID | Counts | Sigma | Mean | Median | Sigma |
| A | 2 | 79 | 10315 | 56.65 | 844 | 829 | 167.4 |
| A | 0 | 226 | 7400 | 39.24 | 844 | 829 | 167.4 |
| A | 3 | 137 | 6516 | 33.96 | 844 | 829 | 167.4 |
| B | 4 | 216 | 19141 | 115.06 | 858 | 840 | 159.1 |
| B | 12 | 111 | 18516 | 111.13 | 858 | 840 | 159.1 |
| B | 11 | 111 | 16143 | 96.21 | 858 | 840 | 159.1 |
| C | 14 | 238 | 132974 | 693.6 | 825 | 836 | 190.5 |
| C | 13 | 61 | 5800 | 26.06 | 825 | 836 | 190.5 |
| C | 7 | 247 | 5794 | 26.02 | 825 | 836 | 190.5 |
| D | 1 | 52 | 1384638 | 7098.82 | 812 | 790 | 194.9 |
| D | 15 | 0 | 146510 | 747.51 | 812 | 790 | 194.9 |
| D | 9 | 1 | 111632 | 568.59 | 812 | 790 | 194.9 |
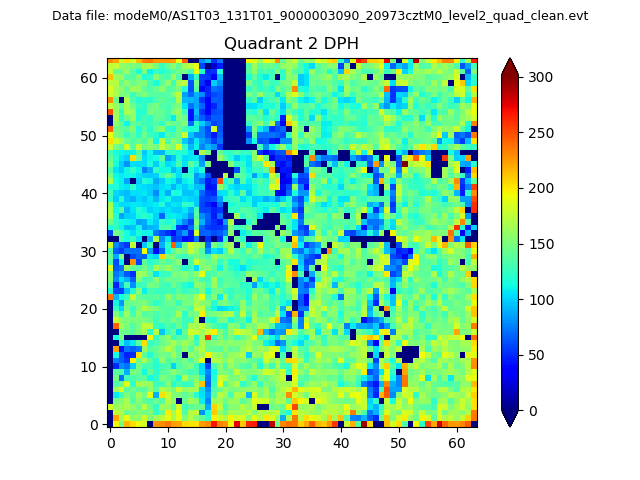
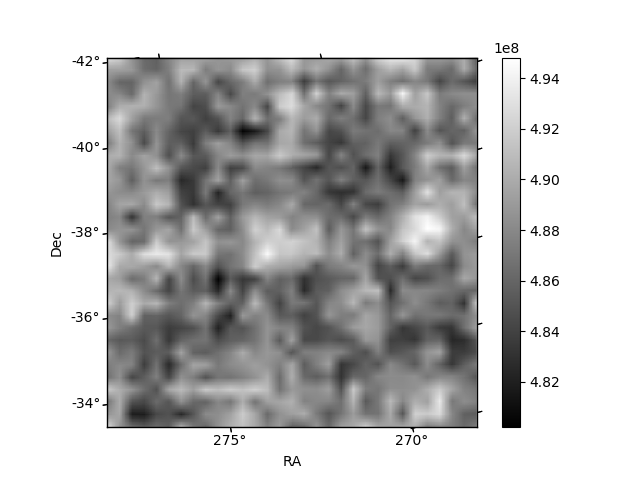
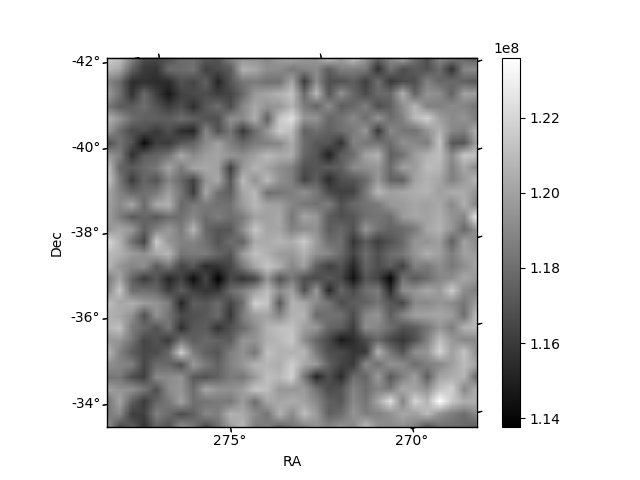
Histogram calculated using DETX and DETY for each event in the final _common_clean file
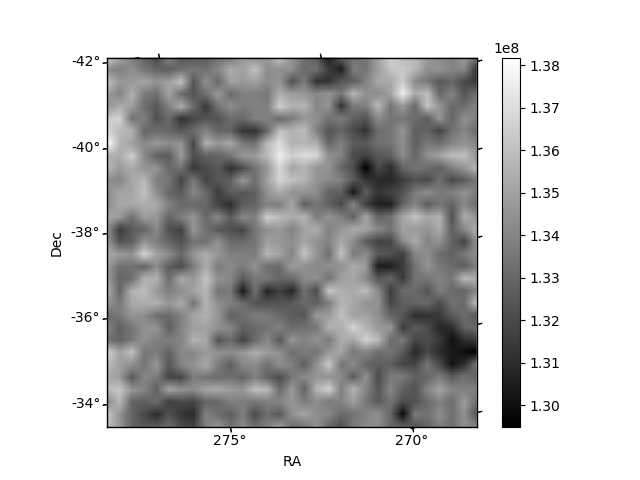
| Quadrant A | 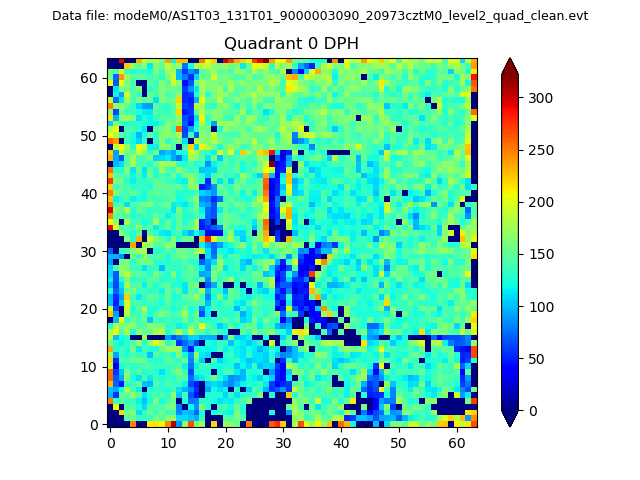 |
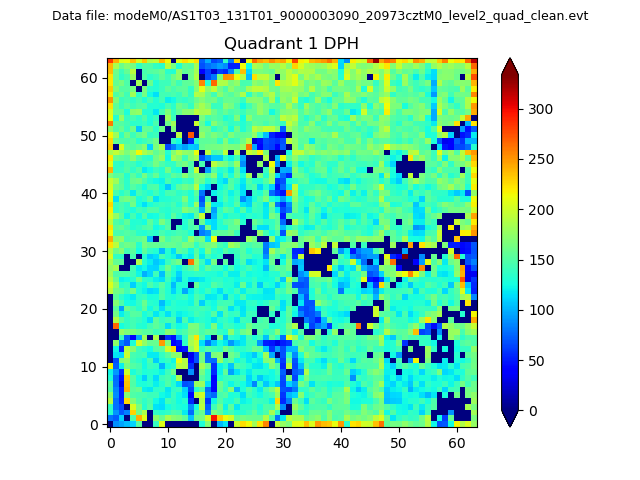 |
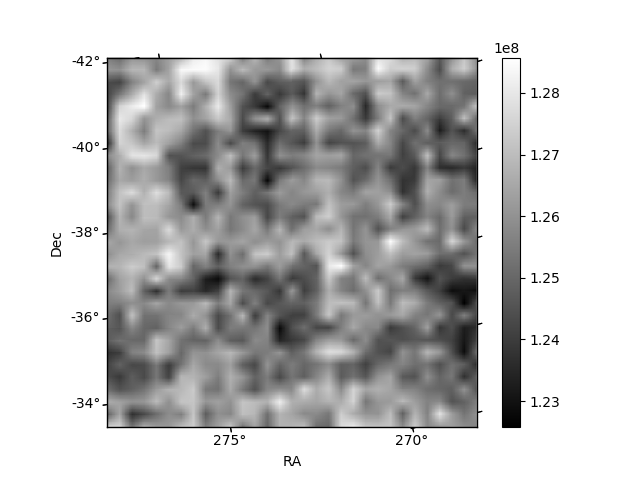
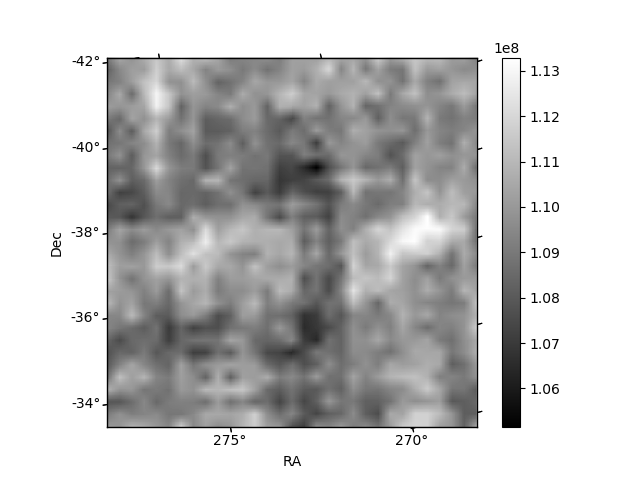
Quadrant B |
|---|---|---|---|
| Quadrant D | 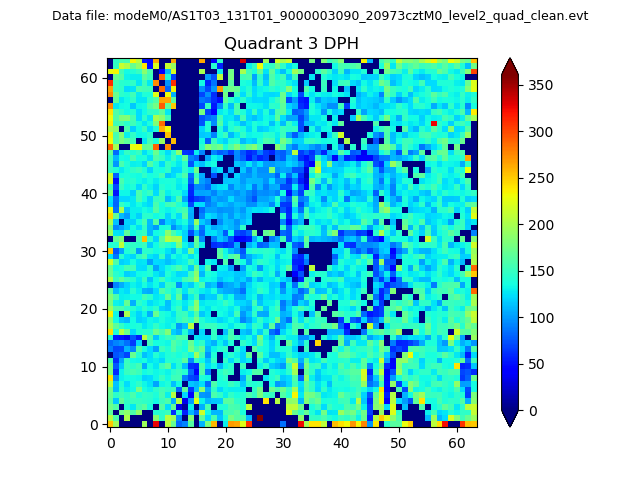 |
 |
Quadrant C |
| Plot type | Count rate plots | Images |
|---|---|---|
| Comparison with Poisson distribution Blue bars denote a histogram of data divided into 1 sec bins. Red curve is a Poisson curve with rate = median count rate of data. |
 |
 |
| Quadrant-wise count rates Data is divided into 100 sec bins |
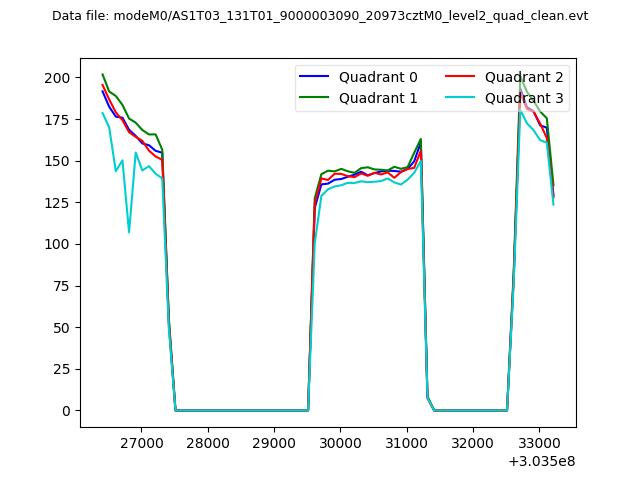 |
|
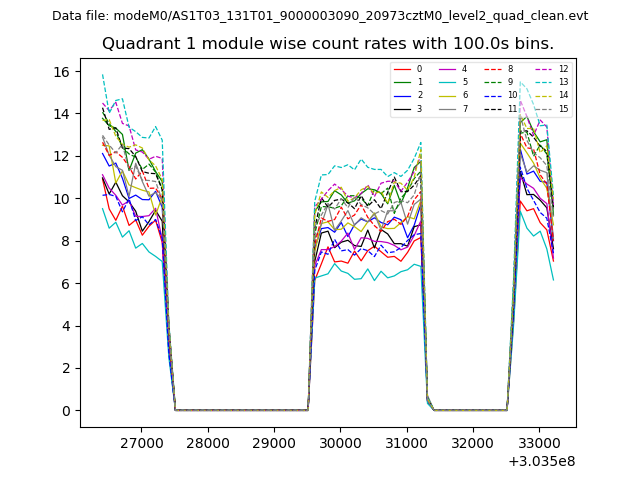
| Module-wise count rates for Quadrant A Data is divided into 100 sec bins |
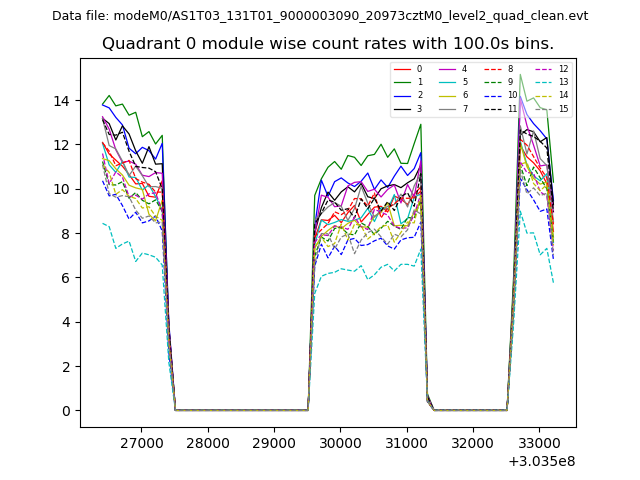 |
 |
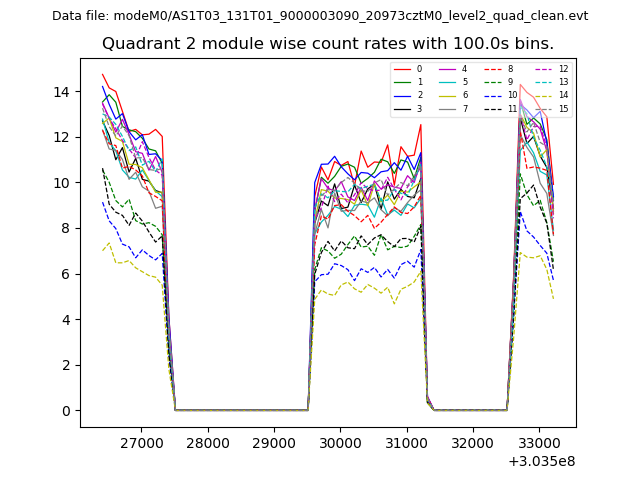
| Module-wise count rates for Quadrant B Data is divided into 100 sec bins |
 |
 |
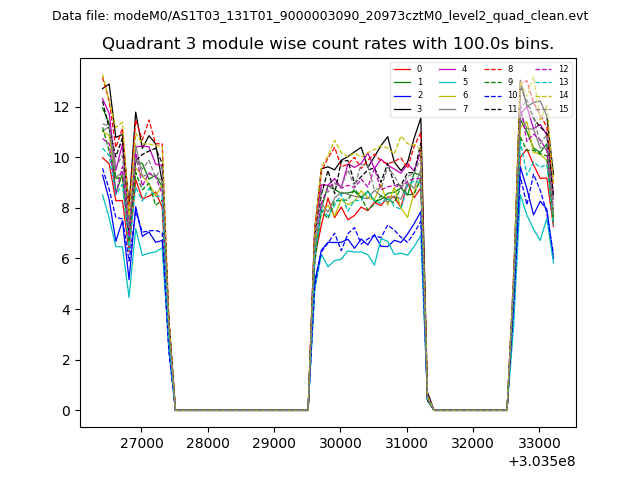
| Module-wise count rates for Quadrant C Data is divided into 100 sec bins |
 |
 |
| Module-wise count rates for Quadrant D Data is divided into 100 sec bins |
 |
 |
| Parameter | Plot |
|---|---|
| CZT HV Monitor | 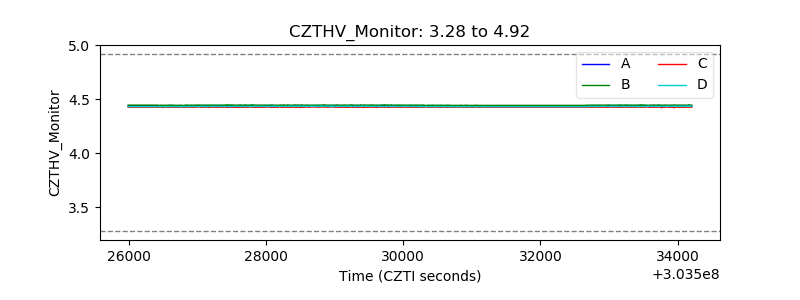 |
| D_VDD |  |
| Temperature 1 | 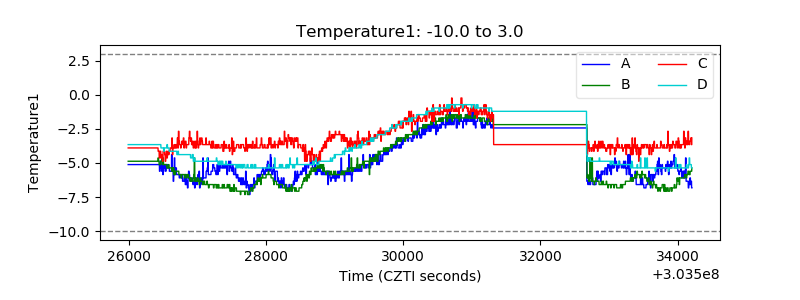 |
| Veto HV Monitor | 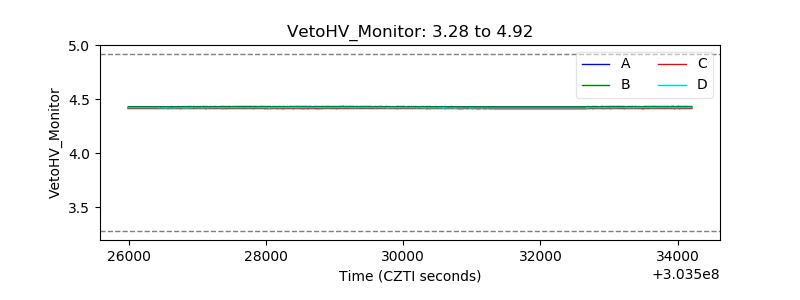 |
| Veto LLD | 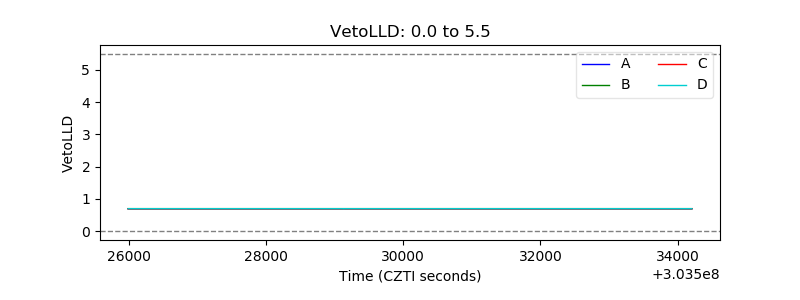 |
| Alpha Counter | 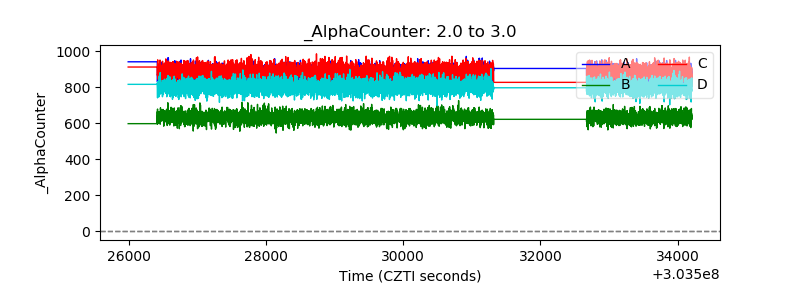 |
| _CPM_Rate | 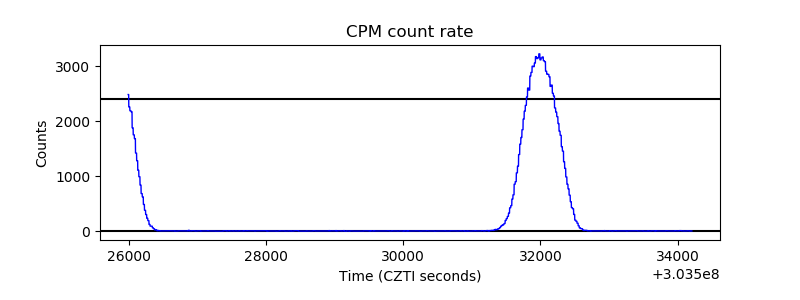 |
| CZT Counter | 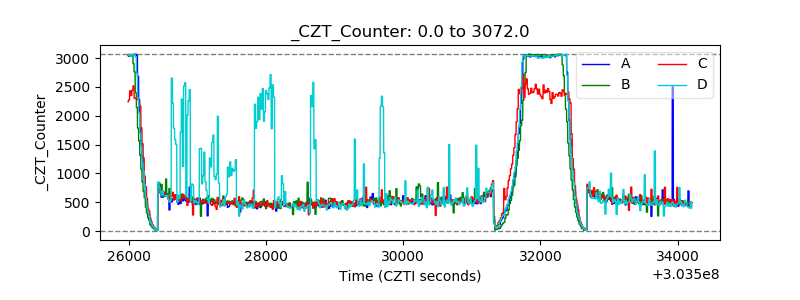 |
| +2.5 Volts monitor |  |
| +5 Volts monitor |  |
| _ROLL_ROT | 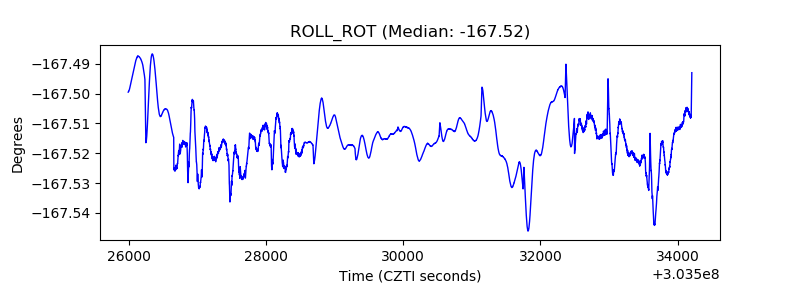 |
| _Roll_DEC | 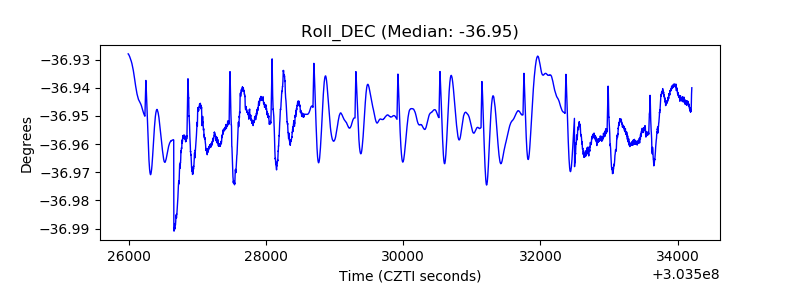 |
| _Roll_RA | 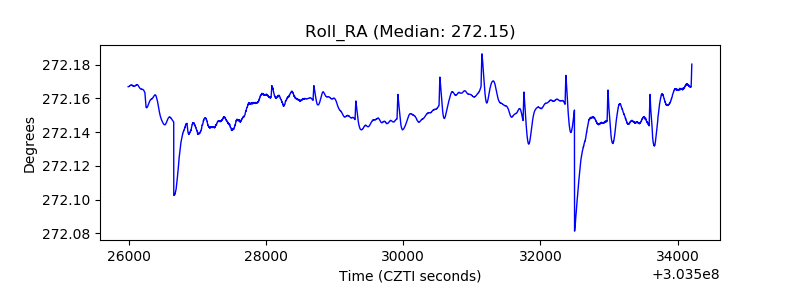 |
| Veto Counter | 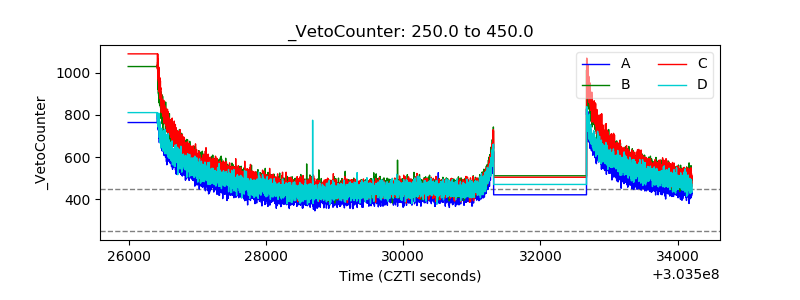 |