| Param | Original file | Final file |
|---|---|---|
| Filename | modeM0/AS1T03_131T01_9000003090_20974cztM0_level2.evt | modeM0/AS1T03_131T01_9000003090_20974cztM0_level2_quad_clean.evt |
| Size (bytes) | 1,564,992,000 | 267,814,080 |
| Size | 1.5 GB | 255.4 MB |
| Events in quadrant A | 10,466,788 | 1,679,581 |
| Events in quadrant B | 11,069,670 | 1,730,960 |
| Events in quadrant C | 10,773,622 | 1,667,892 |
| Events in quadrant D | 13,648,350 | 1,566,980 |
| Mode SS | |||
|---|---|---|---|
| Quadrant | BADHDUFLAG | Total packets | Discarded packets |
| A | 0 | 432 | 0 |
| B | 0 | 432 | 0 |
| C | 0 | 432 | 0 |
| D | 0 | 432 | 0 |
| Mode M9 | |||
|---|---|---|---|
| Quadrant | BADHDUFLAG | Total packets | Discarded packets |
| A | 0 | 54 | 0 |
| B | 0 | 55 | 0 |
| C | 0 | 55 | 0 |
| D | 0 | 55 | 0 |
| Mode M0 | |||
|---|---|---|---|
| Quadrant | BADHDUFLAG | Total packets | Discarded packets |
| A | 0 | 43984 | 5 |
| B | 0 | 45502 | 5 |
| C | 0 | 44395 | 5 |
| D | 0 | 54403 | 5 |
| Quadrant | Total seconds | Saturated seconds | Saturation percentage |
|---|---|---|---|
| A | 21300 | 107 | 0.502347% |
| B | 21300 | 163 | 0.765258% |
| C | 21300 | 202 | 0.948357% |
| D | 21300 | 756 | 3.549296% |
Noise dominated data is calculated using 1-second bins in cleaned event files. If a bin has >2000 counts, and if more than 50% of those come from <1% of pixels, then it is considered to be noise-dominated and hence unusable.
| Quadrant | # 1 sec bins | Bins with >0 counts | Bins with >2000 counts | High rate bins dominated by noise | Noise dominated (total time) | Noise dominated (detector-on time) | Marked lightcurve |
|---|---|---|---|---|---|---|---|
| A | 26465 | 21304 | 4 | 4 | 0.02% | 0.02% | 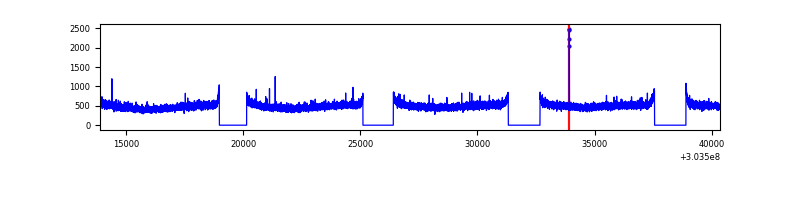 |
| B | 26465 | 21304 | 20 | 20 | 0.08% | 0.09% | 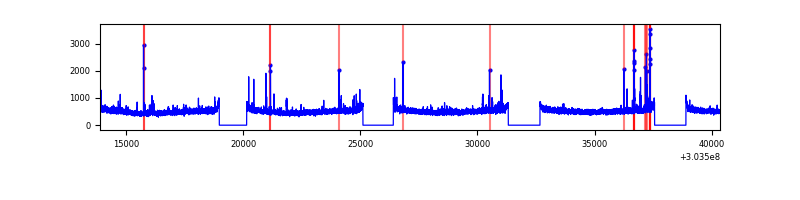 |
| C | 26465 | 21304 | 0 | 0 | 0.00% | 0.00% | 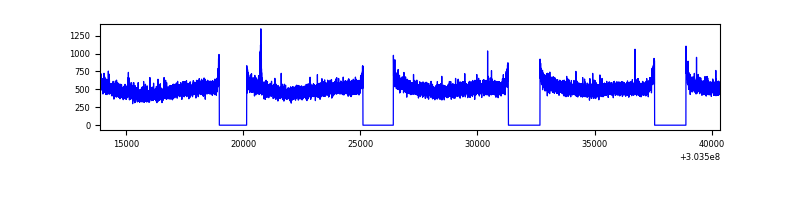 |
| D | 26465 | 21303 | 799 | 799 | 3.02% | 3.75% | 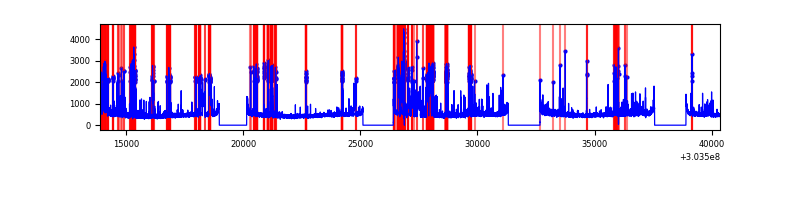 |
Top three noisy pixels from each quadrant. If the there are fewer than three noisy pixels in the level2.evt file, extra rows are filled as -1
| Pixel properties | Quadrant properties | ||||||
|---|---|---|---|---|---|---|---|
| Quadrant | DetID | PixID | Counts | Sigma | Mean | Median | Sigma |
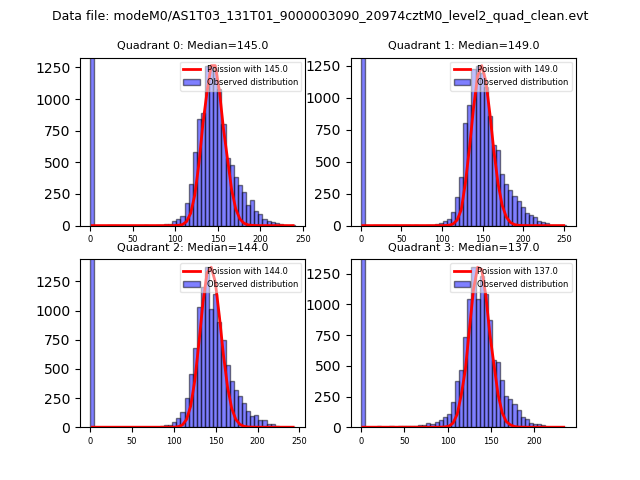
| A | 0 | 226 | 23722 | 38.96 | 2723 | 2675 | 540.2 |
| A | 3 | 137 | 21742 | 35.29 | 2723 | 2675 | 540.2 |
| A | 12 | 194 | 19466 | 31.08 | 2723 | 2675 | 540.2 |
| B | 3 | 64 | 129638 | 251.03 | 2746 | 2681 | 505.7 |
| B | 12 | 111 | 60282 | 113.89 | 2746 | 2681 | 505.7 |
| B | 0 | 189 | 59156 | 111.67 | 2746 | 2681 | 505.7 |
| C | 14 | 238 | 420317 | 687.62 | 2642 | 2666 | 607.4 |
| C | 7 | 247 | 34201 | 51.92 | 2642 | 2666 | 607.4 |
| C | 9 | 54 | 20740 | 29.76 | 2642 | 2666 | 607.4 |
| D | 1 | 52 | 2941253 | 4662.32 | 2627 | 2556 | 630.3 |
| D | 9 | 1 | 421133 | 664.08 | 2627 | 2556 | 630.3 |
| D | 15 | 0 | 181317 | 283.61 | 2627 | 2556 | 630.3 |
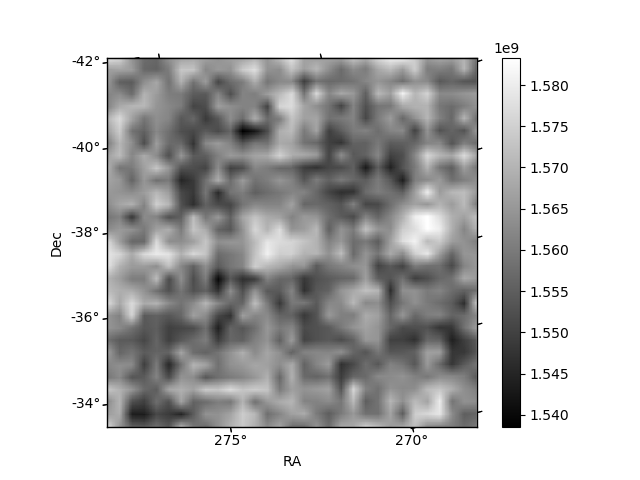
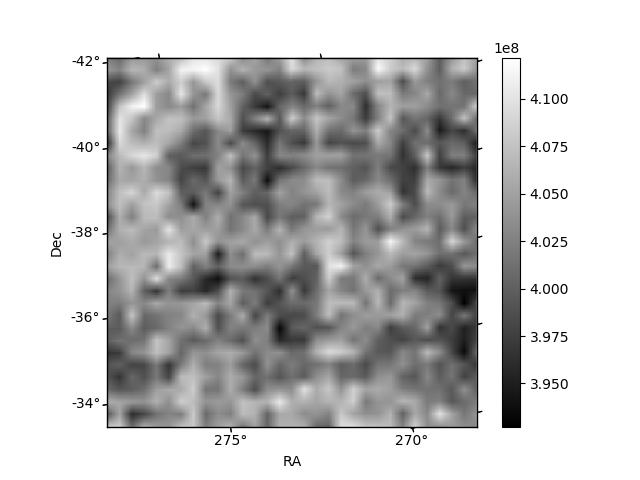
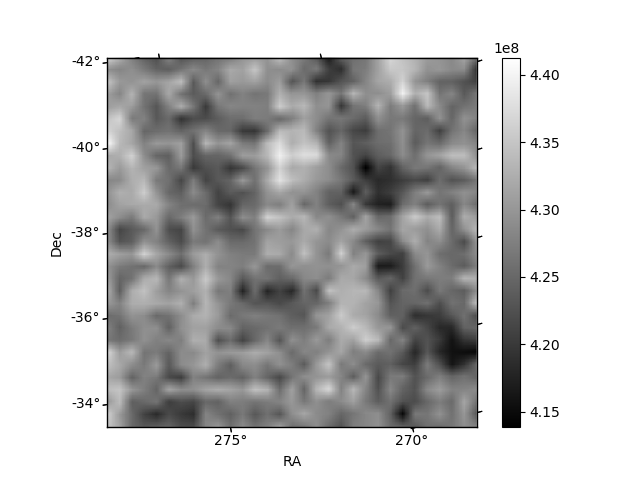
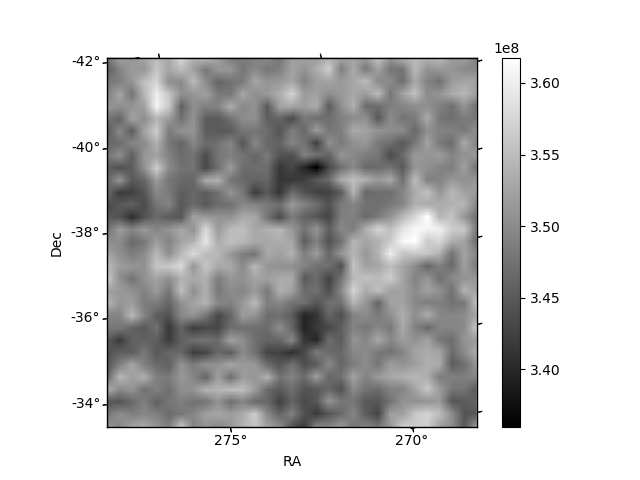
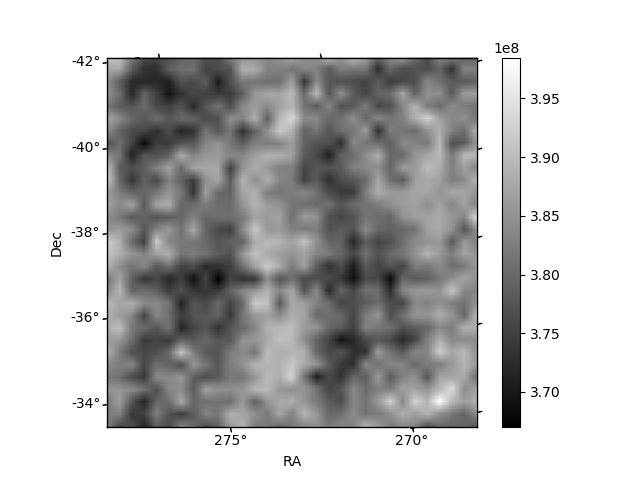
Histogram calculated using DETX and DETY for each event in the final _common_clean file
| Quadrant A | 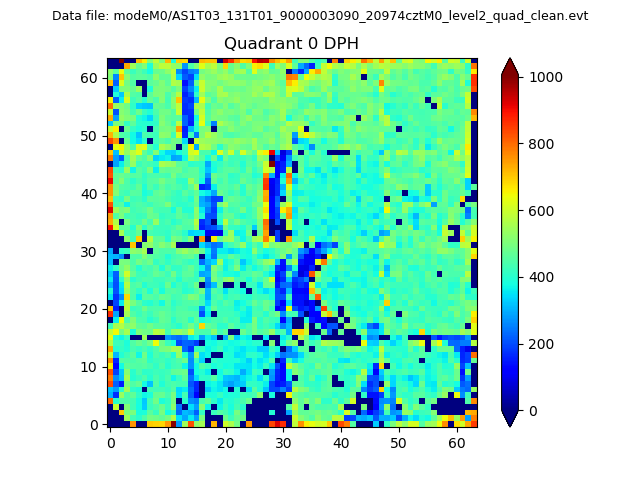 |
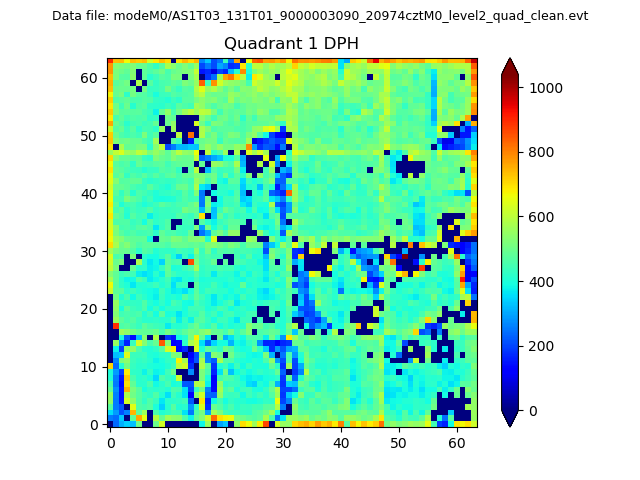 |
Quadrant B |
|---|---|---|---|
| Quadrant D | 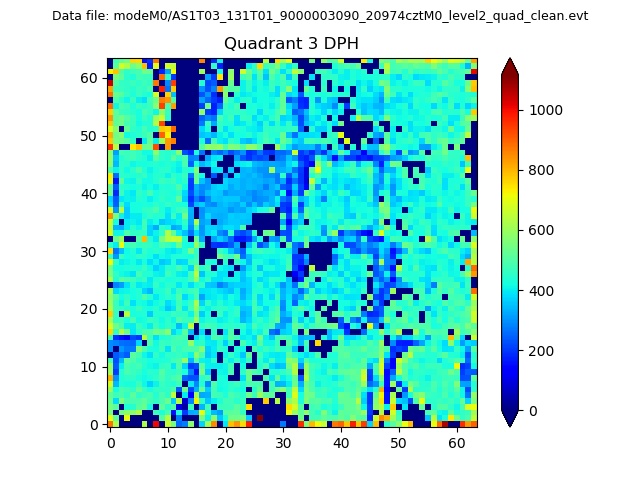 |
 |
Quadrant C |
| Plot type | Count rate plots | Images |
|---|---|---|
| Comparison with Poisson distribution Blue bars denote a histogram of data divided into 1 sec bins. Red curve is a Poisson curve with rate = median count rate of data. |
 |
 |
| Quadrant-wise count rates Data is divided into 100 sec bins |
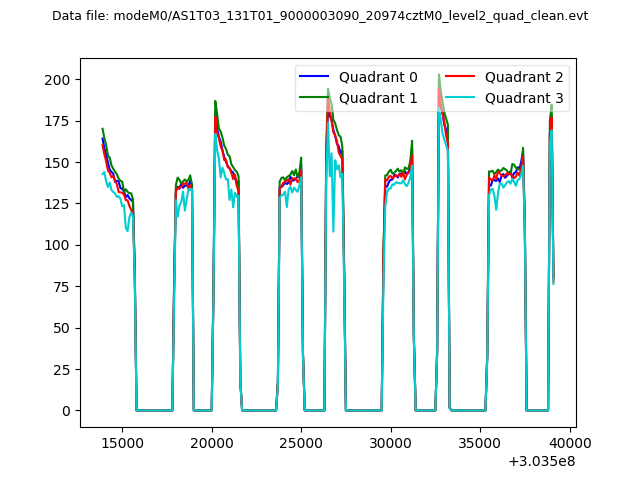 |
|
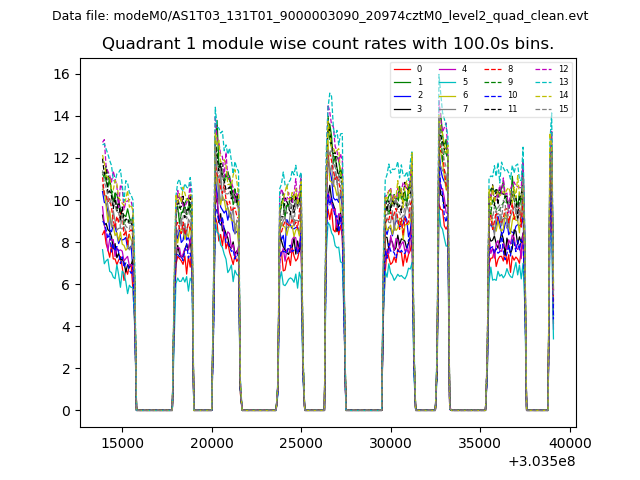
| Module-wise count rates for Quadrant A Data is divided into 100 sec bins |
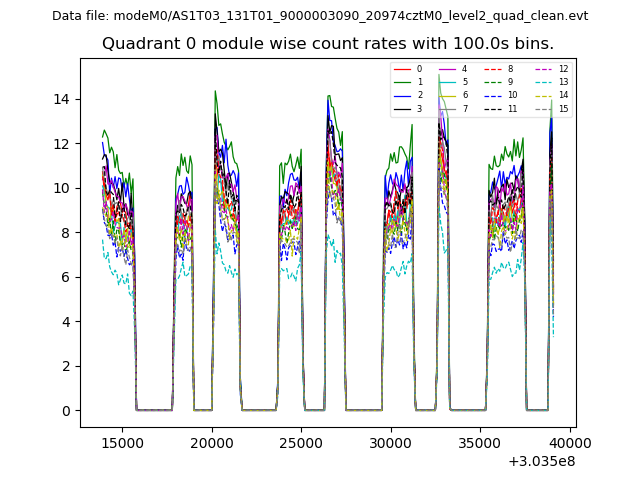 |
 |
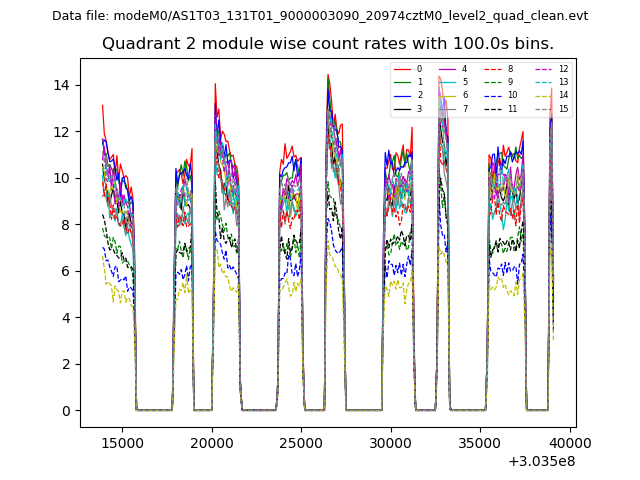
| Module-wise count rates for Quadrant B Data is divided into 100 sec bins |
 |
 |
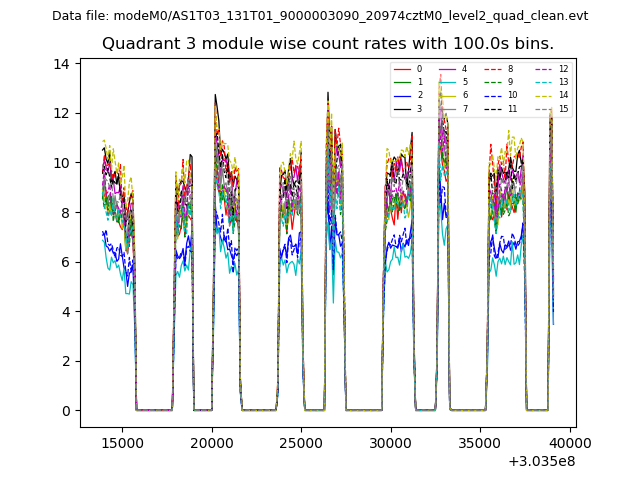
| Module-wise count rates for Quadrant C Data is divided into 100 sec bins |
 |
 |
| Module-wise count rates for Quadrant D Data is divided into 100 sec bins |
 |
 |
| Parameter | Plot |
|---|---|
| CZT HV Monitor | 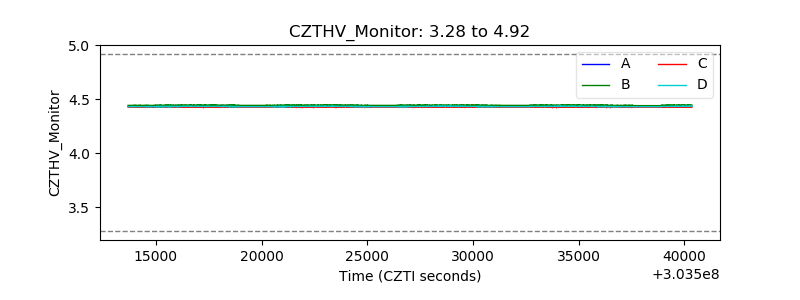 |
| D_VDD | 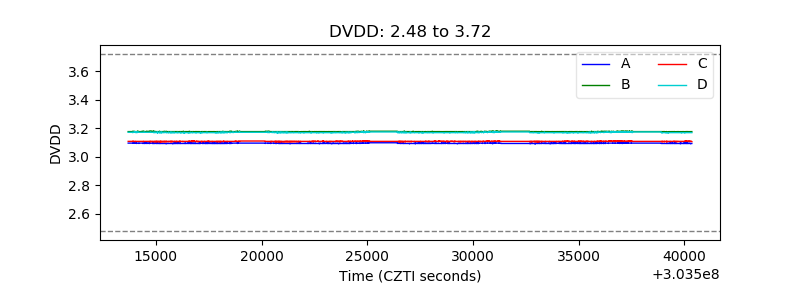 |
| Temperature 1 | 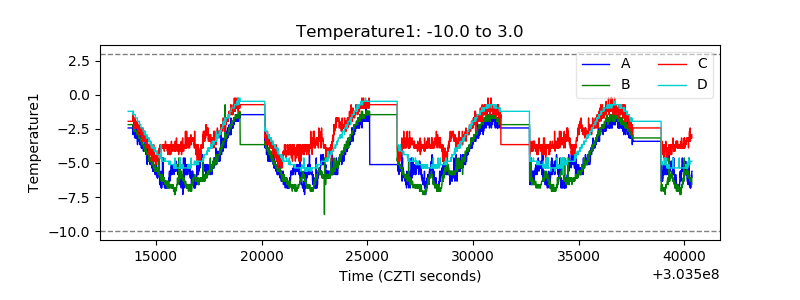 |
| Veto HV Monitor | 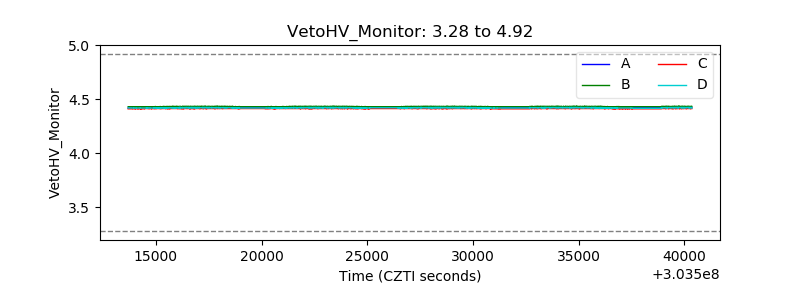 |
| Veto LLD | 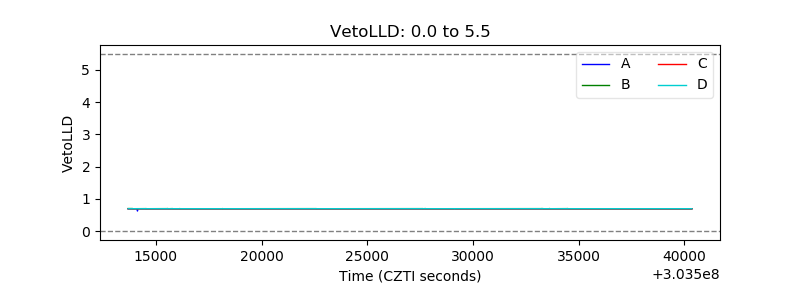 |
| Alpha Counter | 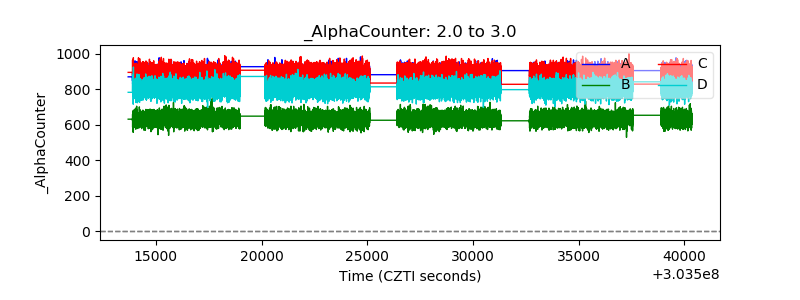 |
| _CPM_Rate | 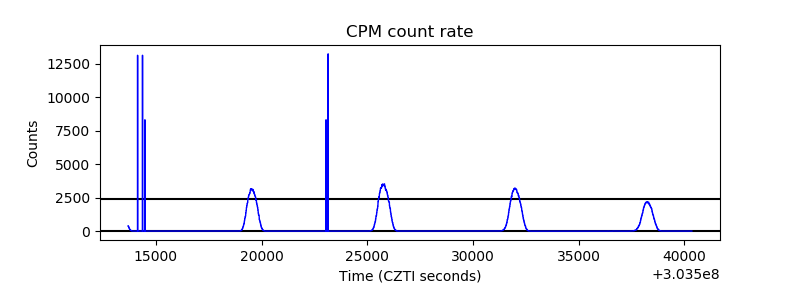 |
| CZT Counter |  |
| +2.5 Volts monitor |  |
| +5 Volts monitor |  |
| _ROLL_ROT | 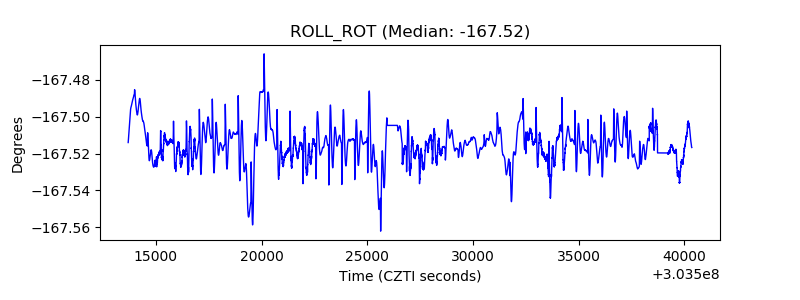 |
| _Roll_DEC | 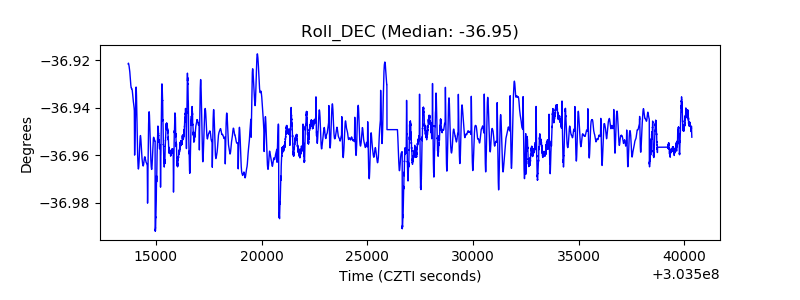 |
| _Roll_RA | 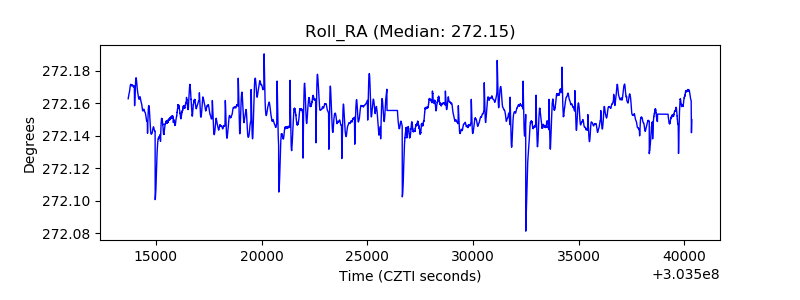 |
| Veto Counter | 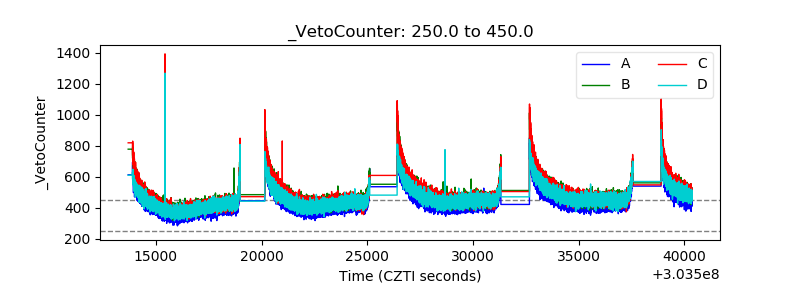 |