| Param | Original file | Final file |
|---|---|---|
| Filename | modeM0/AS1T03_131T01_9000003090_20978cztM0_level2.evt | modeM0/AS1T03_131T01_9000003090_20978cztM0_level2_quad_clean.evt |
| Size (bytes) | 254,664,000 | 43,534,080 |
| Size | 242.9 MB | 41.5 MB |
| Events in quadrant A | 1,591,875 | 270,791 |
| Events in quadrant B | 1,824,675 | 275,246 |
| Events in quadrant C | 1,616,130 | 271,254 |
| Events in quadrant D | 2,445,081 | 257,377 |
| Mode SS | |||
|---|---|---|---|
| Quadrant | BADHDUFLAG | Total packets | Discarded packets |
| A | 0 | 72 | 0 |
| B | 0 | 72 | 0 |
| C | 0 | 72 | 0 |
| D | 0 | 72 | 0 |
| Mode M9 | |||
|---|---|---|---|
| Quadrant | BADHDUFLAG | Total packets | Discarded packets |
| A | 0 | 5 | 0 |
| B | 0 | 5 | 0 |
| C | 0 | 5 | 0 |
| D | 0 | 5 | 0 |
| Mode M0 | |||
|---|---|---|---|
| Quadrant | BADHDUFLAG | Total packets | Discarded packets |
| A | 0 | 6972 | 1 |
| B | 0 | 7580 | 1 |
| C | 0 | 6988 | 1 |
| D | 0 | 9587 | 1 |
| Quadrant | Total seconds | Saturated seconds | Saturation percentage |
|---|---|---|---|
| A | 3425 | 31 | 0.905109% |
| B | 3426 | 53 | 1.546994% |
| C | 3426 | 59 | 1.722125% |
| D | 3426 | 198 | 5.779335% |
Noise dominated data is calculated using 1-second bins in cleaned event files. If a bin has >2000 counts, and if more than 50% of those come from <1% of pixels, then it is considered to be noise-dominated and hence unusable.
| Quadrant | # 1 sec bins | Bins with >0 counts | Bins with >2000 counts | High rate bins dominated by noise | Noise dominated (total time) | Noise dominated (detector-on time) | Marked lightcurve |
|---|---|---|---|---|---|---|---|
| A | 3935 | 3426 | 0 | 0 | 0.00% | 0.00% | 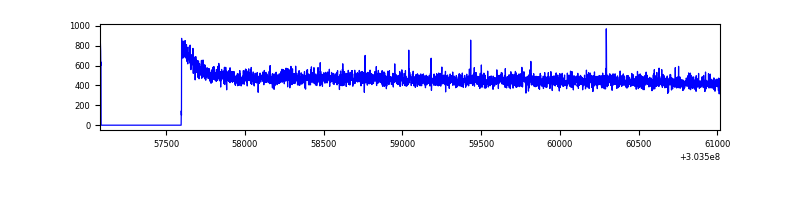 |
| B | 3936 | 3427 | 8 | 8 | 0.20% | 0.23% | 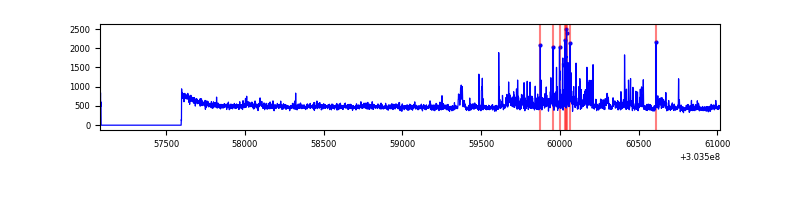 |
| C | 3936 | 3427 | 0 | 0 | 0.00% | 0.00% | 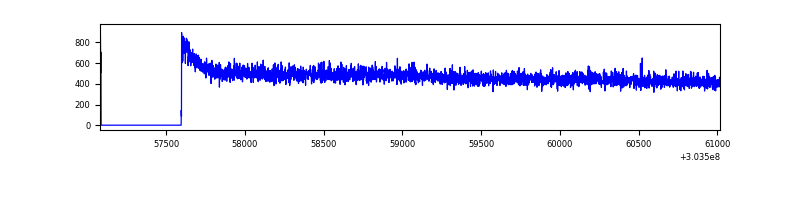 |
| D | 3936 | 3427 | 150 | 150 | 3.81% | 4.38% | 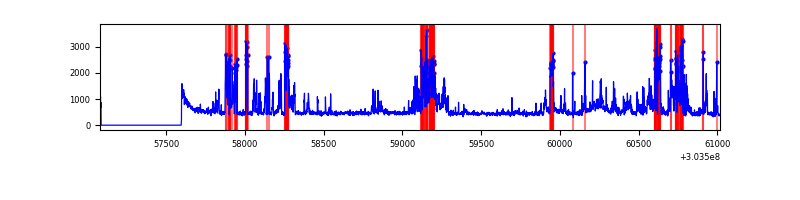 |
Top three noisy pixels from each quadrant. If the there are fewer than three noisy pixels in the level2.evt file, extra rows are filled as -1
| Pixel properties | Quadrant properties | ||||||
|---|---|---|---|---|---|---|---|
| Quadrant | DetID | PixID | Counts | Sigma | Mean | Median | Sigma |
| A | 0 | 226 | 3540 | 37.1 | 414 | 405 | 84.5 |
| A | 3 | 137 | 3441 | 35.93 | 414 | 405 | 84.5 |
| A | 12 | 194 | 2918 | 29.74 | 414 | 405 | 84.5 |
| B | 7 | 220 | 139770 | 1734.53 | 409 | 398 | 80.4 |
| B | 0 | 190 | 25765 | 315.7 | 409 | 398 | 80.4 |
| B | 3 | 64 | 18678 | 227.5 | 409 | 398 | 80.4 |
| C | 14 | 238 | 62401 | 656.16 | 397 | 399 | 94.5 |
| C | 7 | 247 | 5215 | 50.97 | 397 | 399 | 94.5 |
| C | 13 | 61 | 2732 | 24.69 | 397 | 399 | 94.5 |
| D | 1 | 52 | 666171 | 6883.07 | 395 | 383 | 96.7 |
| D | 9 | 1 | 159699 | 1647.04 | 395 | 383 | 96.7 |
| D | 7 | 238 | 101794 | 1048.41 | 395 | 383 | 96.7 |
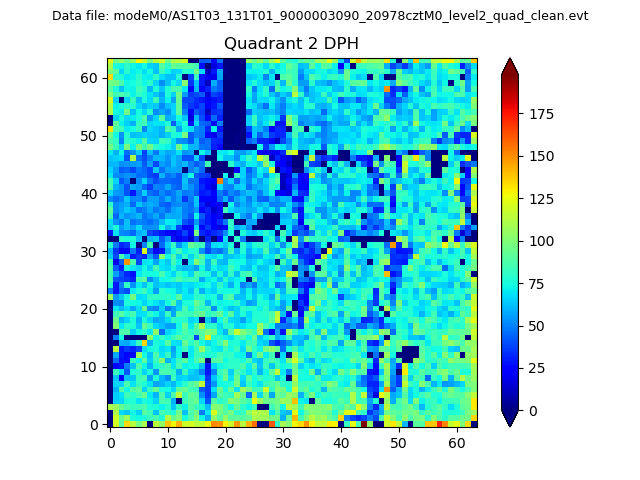
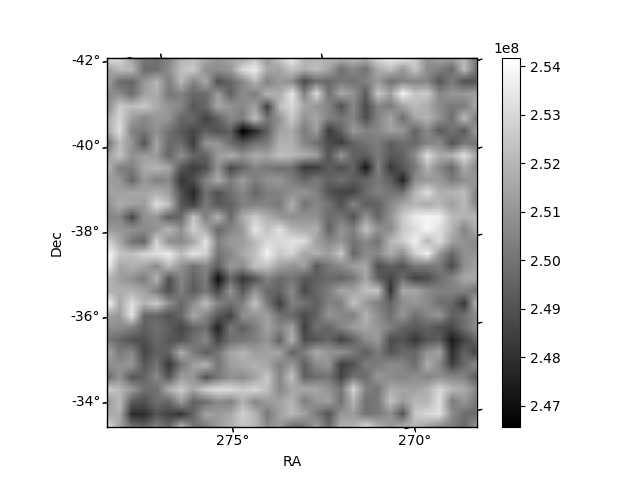
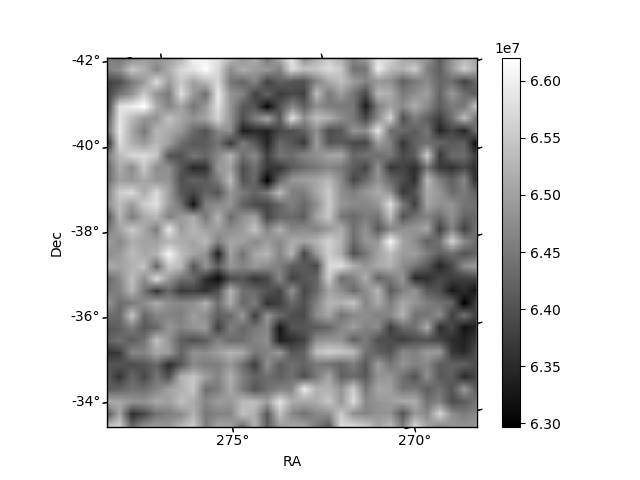
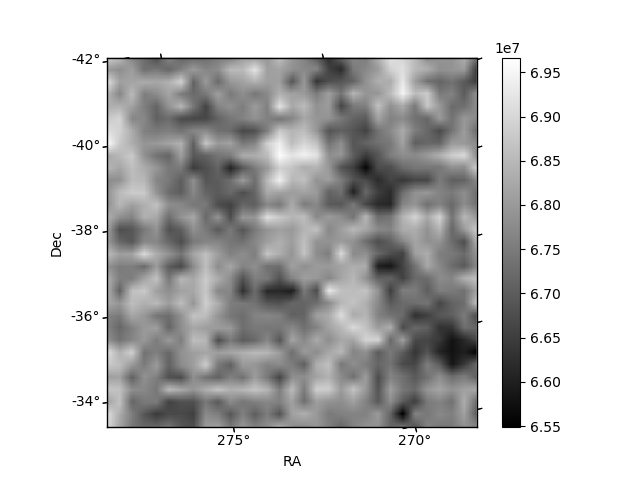
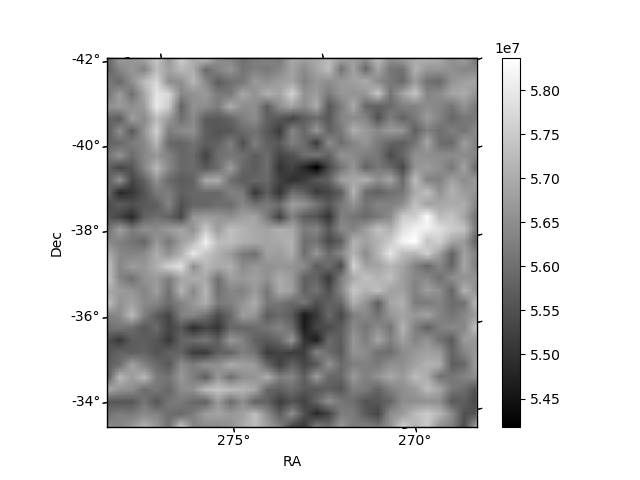
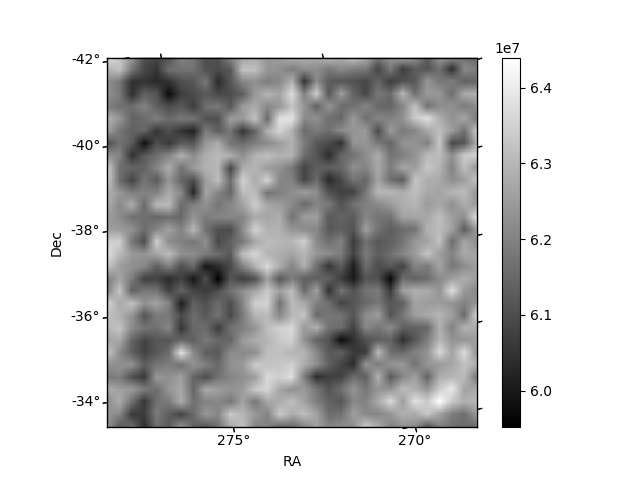
Histogram calculated using DETX and DETY for each event in the final _common_clean file
| Quadrant A | 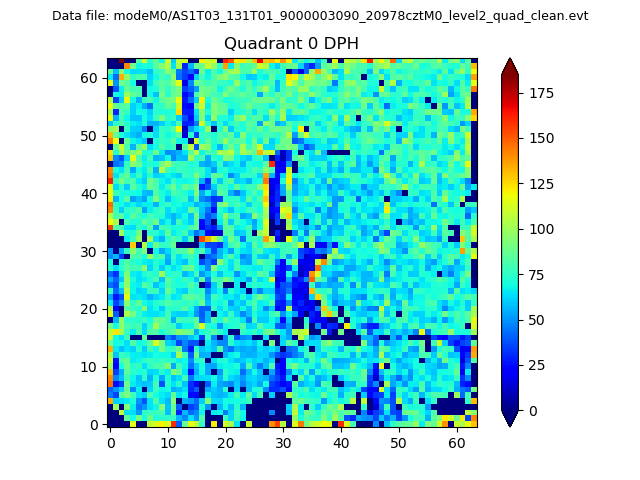 |
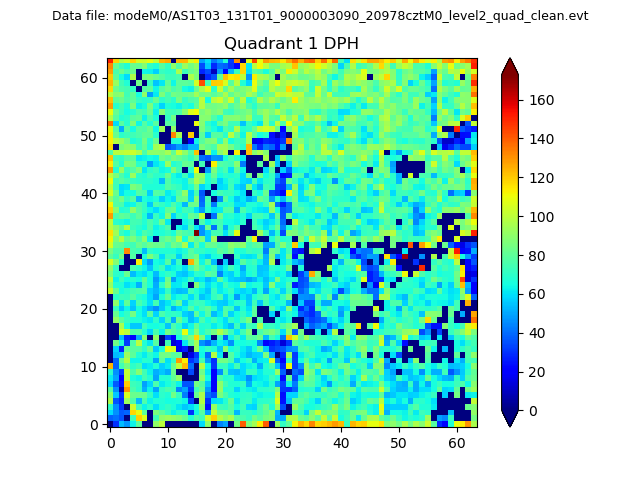 |
Quadrant B |
|---|---|---|---|
| Quadrant D | 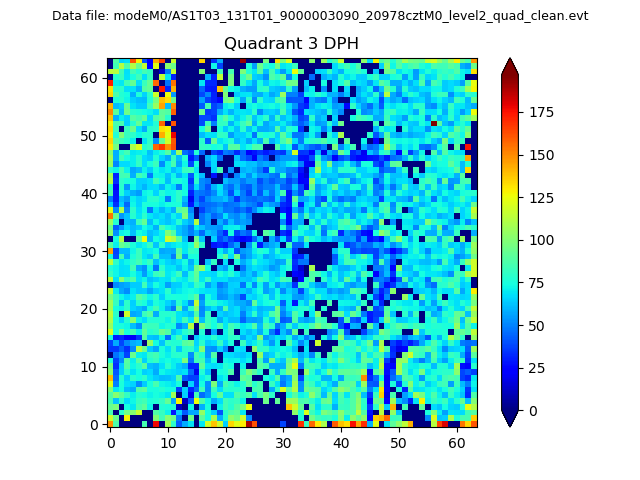 |
 |
Quadrant C |
| Plot type | Count rate plots | Images |
|---|---|---|
| Comparison with Poisson distribution Blue bars denote a histogram of data divided into 1 sec bins. Red curve is a Poisson curve with rate = median count rate of data. |
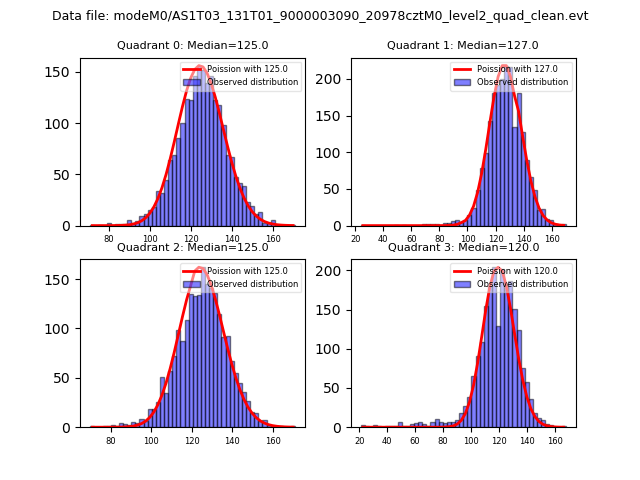 |
 |
| Quadrant-wise count rates Data is divided into 100 sec bins |
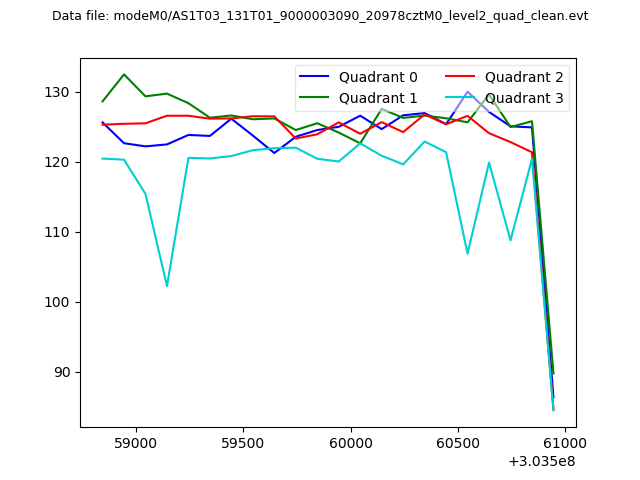 |
|
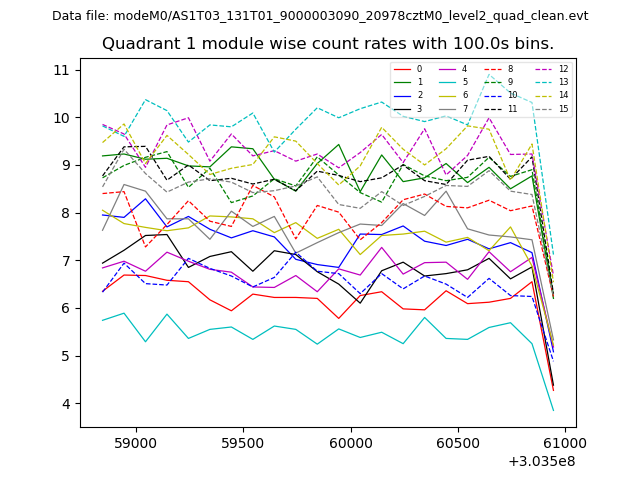
| Module-wise count rates for Quadrant A Data is divided into 100 sec bins |
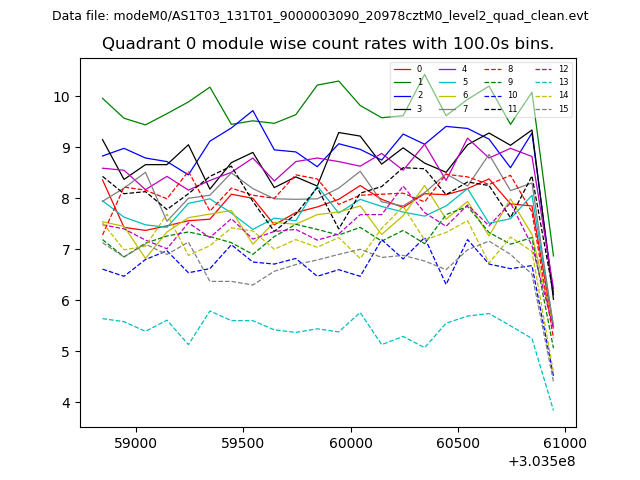 |
 |
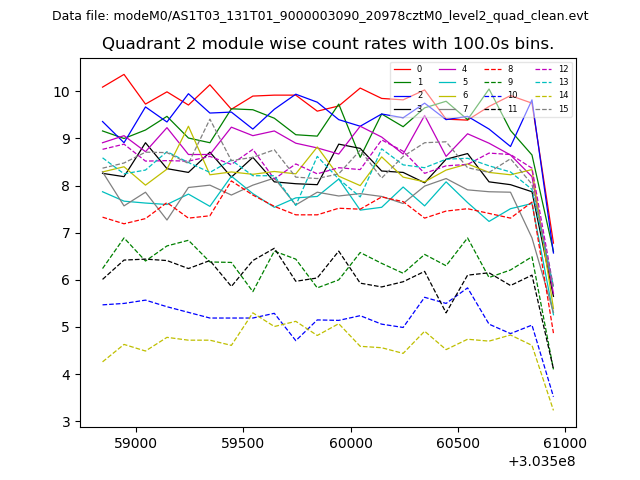
| Module-wise count rates for Quadrant B Data is divided into 100 sec bins |
 |
 |
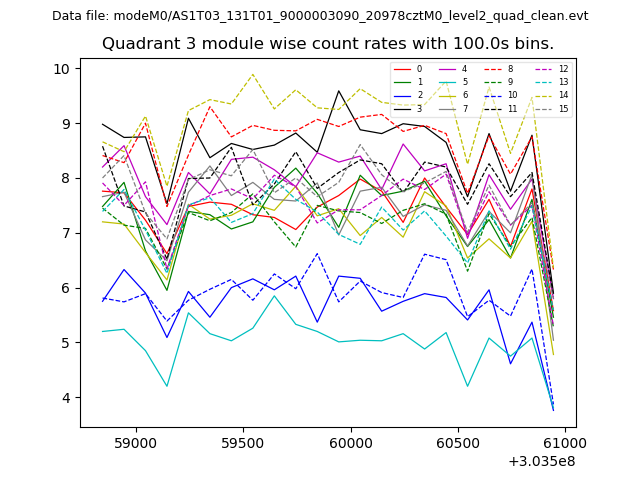
| Module-wise count rates for Quadrant C Data is divided into 100 sec bins |
 |
 |
| Module-wise count rates for Quadrant D Data is divided into 100 sec bins |
 |
 |
| Parameter | Plot |
|---|---|
| CZT HV Monitor | 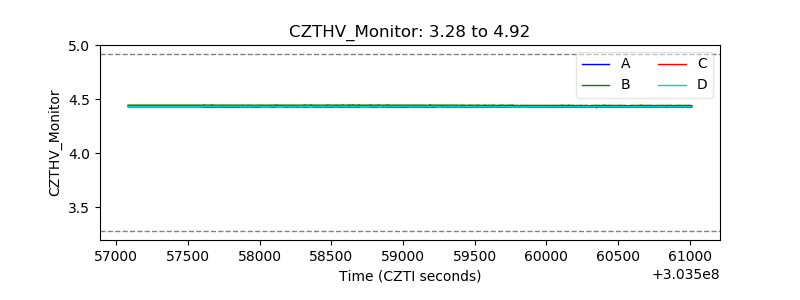 |
| D_VDD | 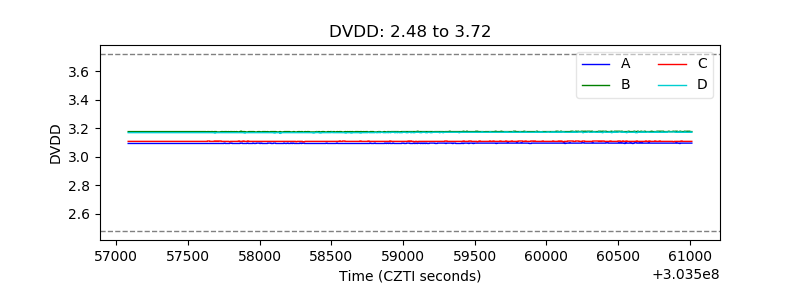 |
| Temperature 1 | 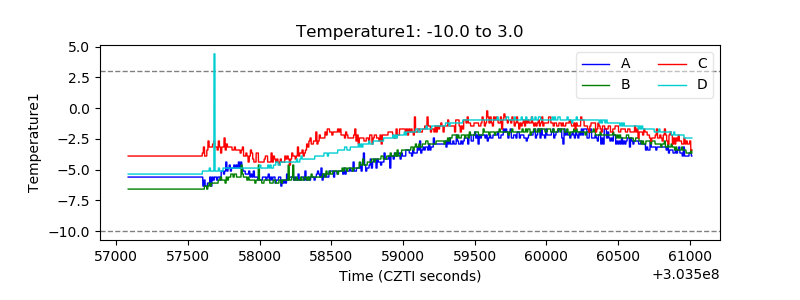 |
| Veto HV Monitor | 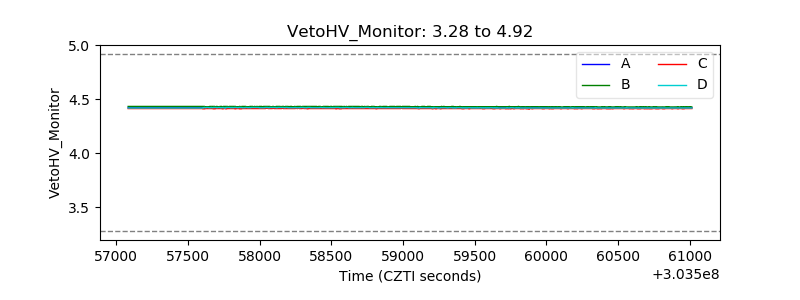 |
| Veto LLD | 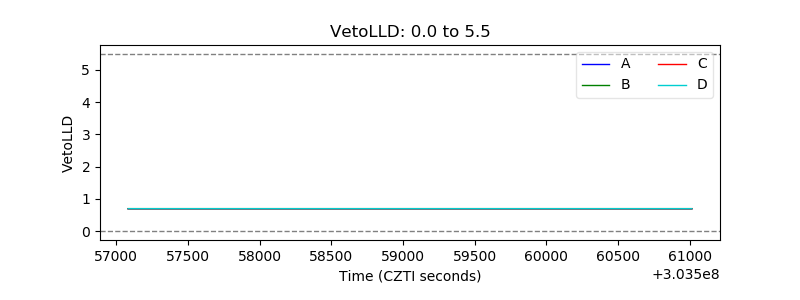 |
| Alpha Counter | 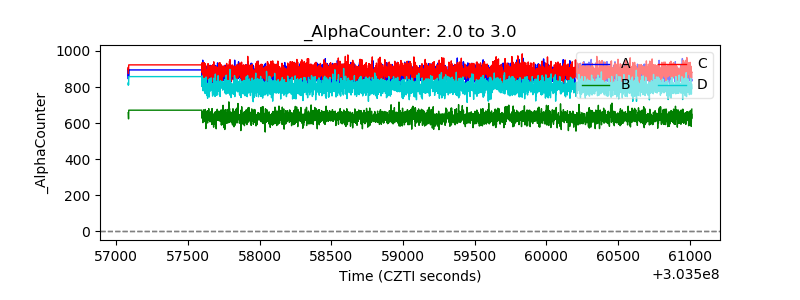 |
| _CPM_Rate | 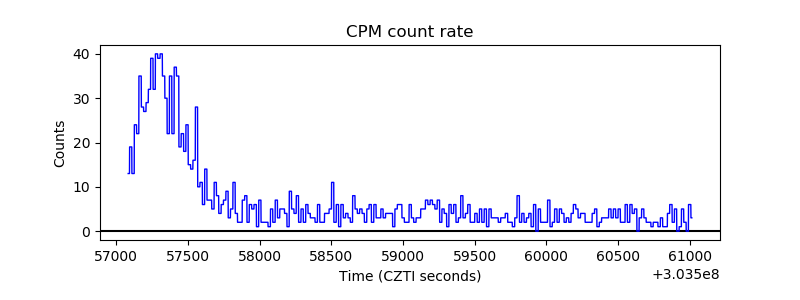 |
| CZT Counter | 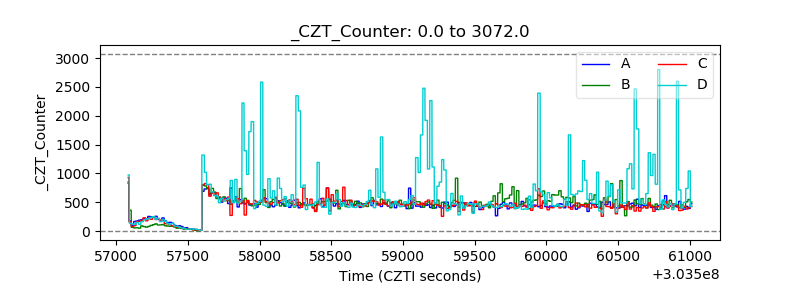 |
| +2.5 Volts monitor |  |
| +5 Volts monitor |  |
| _ROLL_ROT | 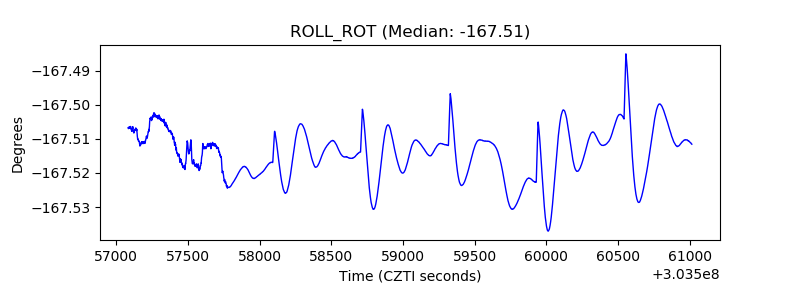 |
| _Roll_DEC | 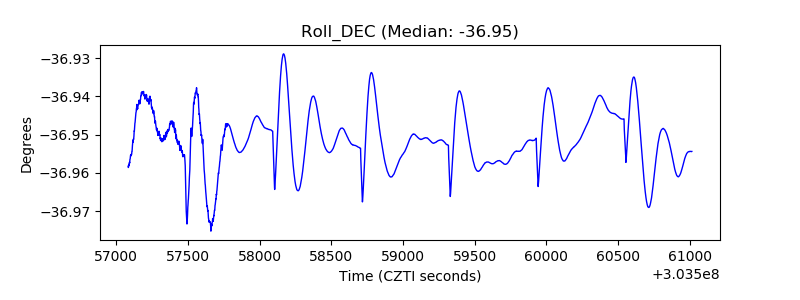 |
| _Roll_RA | 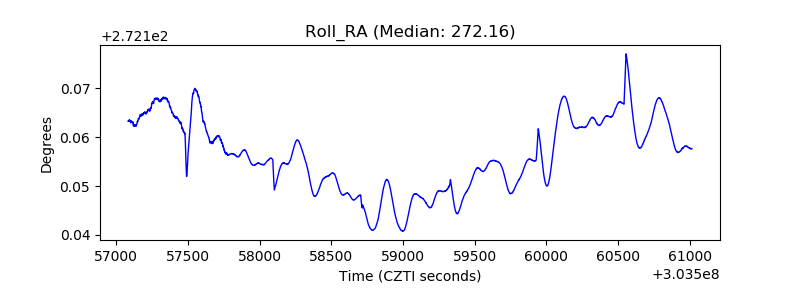 |
| Veto Counter | 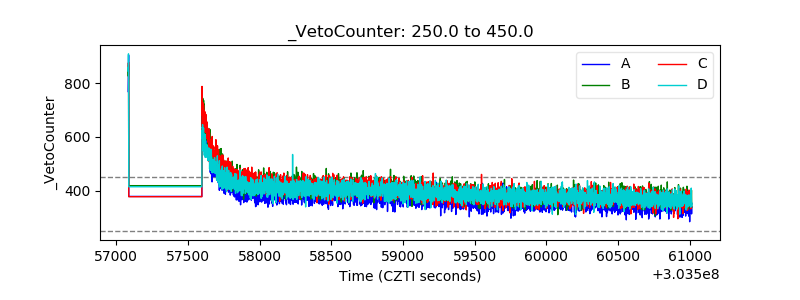 |