| Param | Original file | Final file |
|---|---|---|
| Filename | modeM0/AS1A05_072T04_9000003094cztM0_level2.fits | modeM0/AS1A05_072T04_9000003094cztM0_level2_quad_clean.evt |
| Size (bytes) | 941,797,440 | 855,313,920 |
| Size | 898.2 MB | 815.7 MB |
| Events in quadrant A | 5,886,094 | 5,171,039 |
| Events in quadrant B | 5,611,678 | 5,106,683 |
| Events in quadrant C | 5,674,500 | 4,814,347 |
| Events in quadrant D | 4,862,834 | 4,324,179 |
| Mode M9 | |||
|---|---|---|---|
| Quadrant | BADHDUFLAG | Total packets | Discarded packets |
| A | 0 | 176 | 0 |
| B | 0 | 176 | 0 |
| C | 0 | 176 | 0 |
| D | 0 | 176 | 0 |
| Mode SS | |||
|---|---|---|---|
| Quadrant | BADHDUFLAG | Total packets | Discarded packets |
| A | 0 | 1932 | 0 |
| B | 0 | 1932 | 0 |
| C | 0 | 1932 | 0 |
| D | 0 | 1932 | 0 |
| Mode M0 | |||
|---|---|---|---|
| Quadrant | BADHDUFLAG | Total packets | Discarded packets |
| A | 0 | 194912 | 0 |
| B | 0 | 208105 | 0 |
| C | 0 | 198653 | 0 |
| D | 0 | 233100 | 0 |
| Quadrant | Total seconds | Saturated seconds | Saturation percentage |
|---|---|---|---|
| A | 94626 | 984 | 1.039883% |
| B | 94625 | 1632 | 1.724703% |
| C | 94623 | 1599 | 1.689864% |
| D | 94625 | 4320 | 4.565390% |
Noise dominated data is calculated using 1-second bins in cleaned event files. If a bin has >2000 counts, and if more than 50% of those come from <1% of pixels, then it is considered to be noise-dominated and hence unusable.
| Quadrant | # 1 sec bins | Bins with >0 counts | Bins with >2000 counts | High rate bins dominated by noise | Noise dominated (total time) | Noise dominated (detector-on time) | Marked lightcurve |
|---|---|---|---|---|---|---|---|
| A | 112305 | 94629 | 0 | 0 | 0.00% | 0.00% |  |
| B | 112305 | 94625 | 0 | 0 | 0.00% | 0.00% |  |
| C | 112305 | 94627 | 0 | 0 | 0.00% | 0.00% |  |
| D | 112305 | 94612 | 0 | 0 | 0.00% | 0.00% |  |
Top three noisy pixels from each quadrant. If the there are fewer than three noisy pixels in the level2.evt file, extra rows are filled as -1
| Pixel properties | Quadrant properties | ||||||
|---|---|---|---|---|---|---|---|
| Quadrant | DetID | PixID | Counts | Sigma | Mean | Median | Sigma |
| A | 0 | 29 | 5638 | 11.17 | 1532 | 1442 | 375.8 |
| A | 7 | 110 | 4641 | 8.51 | 1532 | 1442 | 375.8 |
| A | 9 | 19 | 4460 | 8.03 | 1532 | 1442 | 375.8 |
| B | 2 | 9 | 4381 | 10.25 | 1486 | 1420 | 288.9 |
| B | 2 | 8 | 3686 | 7.84 | 1486 | 1420 | 288.9 |
| B | 5 | 128 | 3681 | 7.82 | 1486 | 1420 | 288.9 |
| C | 12 | 241 | 3868 | 6.46 | 1498 | 1402 | 381.8 |
| C | 12 | 250 | 3847 | 6.4 | 1498 | 1402 | 381.8 |
| C | 12 | 249 | 3825 | 6.35 | 1498 | 1402 | 381.8 |
| D | 3 | 14 | 3537 | 6.1 | 1391 | 1268 | 371.7 |
| D | 6 | 231 | 3480 | 5.95 | 1391 | 1268 | 371.7 |
| D | 10 | 189 | 3463 | 5.9 | 1391 | 1268 | 371.7 |
Histogram calculated using DETX and DETY for each event in the final _common_clean file
| Quadrant A | 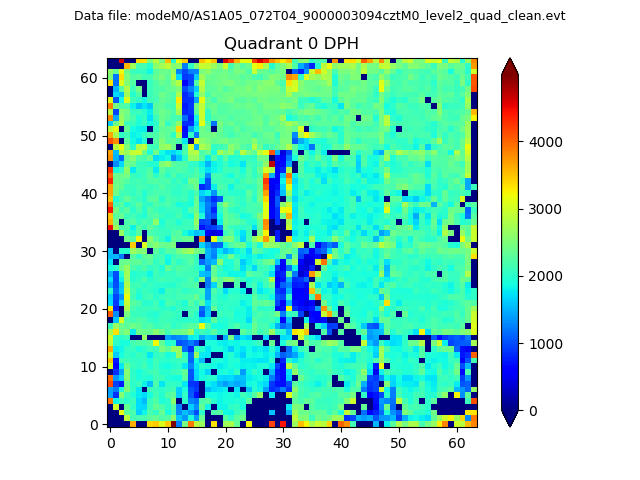 |
 |
Quadrant B |
|---|---|---|---|
| Quadrant D |  |
 |
Quadrant C |
| Plot type | Count rate plots | Images |
|---|---|---|
| Comparison with Poisson distribution Blue bars denote a histogram of data divided into 1 sec bins. Red curve is a Poisson curve with rate = median count rate of data. |
 |
 |
| Quadrant-wise count rates Data is divided into 100 sec bins |
 |
|
| Module-wise count rates for Quadrant A Data is divided into 100 sec bins |
 |
 |
| Module-wise count rates for Quadrant B Data is divided into 100 sec bins |
 |
 |
| Module-wise count rates for Quadrant C Data is divided into 100 sec bins |
 |
 |
| Module-wise count rates for Quadrant D Data is divided into 100 sec bins |
 |
 |
| Parameter | Plot |
|---|---|
| CZT HV Monitor |  |
| D_VDD |  |
| Temperature 1 |  |
| Veto HV Monitor |  |
| Veto LLD |  |
| Alpha Counter |  |
| _CPM_Rate |  |
| CZT Counter |  |
| +2.5 Volts monitor |  |
| +5 Volts monitor |  |
| _ROLL_ROT | 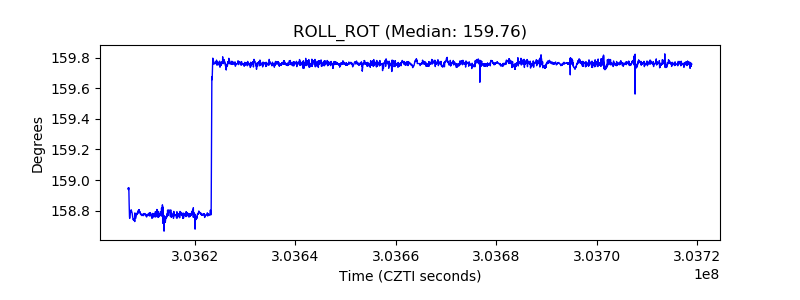 |
| _Roll_DEC |  |
| _Roll_RA |  |
| Veto Counter | 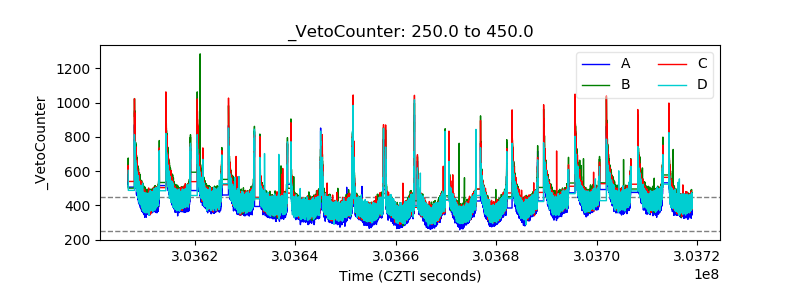 |