| Param | Original file | Final file |
|---|---|---|
| Filename | modeM0/AS1A05_072T04_9000003094_20986cztM0_level2.evt | modeM0/AS1A05_072T04_9000003094_20986cztM0_level2_quad_clean.evt |
| Size (bytes) | 95,941,440 | 25,562,880 |
| Size | 91.5 MB | 24.4 MB |
| Events in quadrant A | 677,147 | 173,352 |
| Events in quadrant B | 739,766 | 178,793 |
| Events in quadrant C | 694,396 | 166,398 |
| Events in quadrant D | 705,578 | 160,203 |
| Mode M9 | |||
|---|---|---|---|
| Quadrant | BADHDUFLAG | Total packets | Discarded packets |
| A | 0 | 13 | 0 |
| B | 0 | 13 | 0 |
| C | 0 | 13 | 0 |
| D | 0 | 13 | 0 |
| Mode SS | |||
|---|---|---|---|
| Quadrant | BADHDUFLAG | Total packets | Discarded packets |
| A | 0 | 26 | 0 |
| B | 0 | 26 | 0 |
| C | 0 | 26 | 0 |
| D | 0 | 26 | 0 |
| Mode M0 | |||
|---|---|---|---|
| Quadrant | BADHDUFLAG | Total packets | Discarded packets |
| A | 0 | 2749 | 1 |
| B | 0 | 2940 | 1 |
| C | 0 | 2800 | 1 |
| D | 0 | 2875 | 1 |
| Quadrant | Total seconds | Saturated seconds | Saturation percentage |
|---|---|---|---|
| A | 1266 | 5 | 0.394945% |
| B | 1266 | 12 | 0.947867% |
| C | 1266 | 16 | 1.263823% |
| D | 1266 | 3 | 0.236967% |
Noise dominated data is calculated using 1-second bins in cleaned event files. If a bin has >2000 counts, and if more than 50% of those come from <1% of pixels, then it is considered to be noise-dominated and hence unusable.
| Quadrant | # 1 sec bins | Bins with >0 counts | Bins with >2000 counts | High rate bins dominated by noise | Noise dominated (total time) | Noise dominated (detector-on time) | Marked lightcurve |
|---|---|---|---|---|---|---|---|
| A | 2506 | 1267 | 0 | 0 | 0.00% | 0.00% | 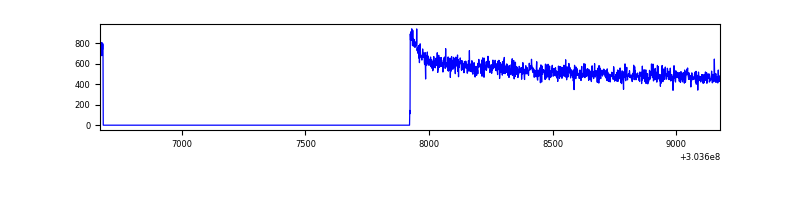 |
| B | 2506 | 1267 | 0 | 0 | 0.00% | 0.00% | 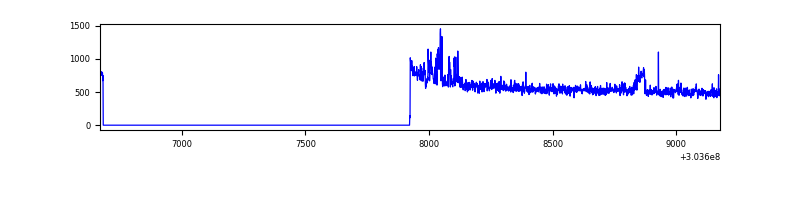 |
| C | 2506 | 1267 | 0 | 0 | 0.00% | 0.00% | 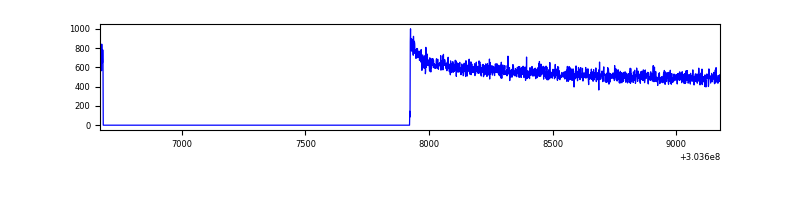 |
| D | 2506 | 1267 | 3 | 3 | 0.12% | 0.24% | 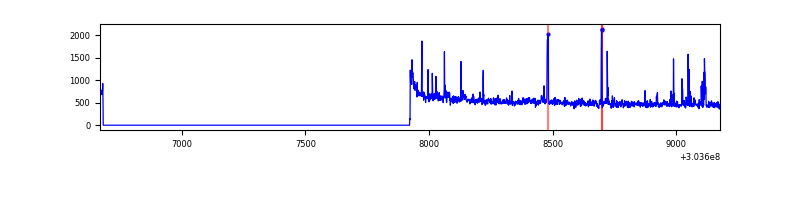 |
Top three noisy pixels from each quadrant. If the there are fewer than three noisy pixels in the level2.evt file, extra rows are filled as -1
| Pixel properties | Quadrant properties | ||||||
|---|---|---|---|---|---|---|---|
| Quadrant | DetID | PixID | Counts | Sigma | Mean | Median | Sigma |
| A | 0 | 226 | 1408 | 33.99 | 176 | 173 | 36.3 |
| A | 12 | 194 | 1279 | 30.44 | 176 | 173 | 36.3 |
| A | 3 | 137 | 1268 | 30.14 | 176 | 173 | 36.3 |
| B | 0 | 182 | 22989 | 643.89 | 179 | 175 | 35.4 |
| B | 0 | 230 | 12594 | 350.51 | 179 | 175 | 35.4 |
| B | 12 | 111 | 3780 | 101.75 | 179 | 175 | 35.4 |
| C | 14 | 238 | 27018 | 647.47 | 171 | 171 | 41.5 |
| C | 13 | 61 | 1218 | 25.25 | 171 | 171 | 41.5 |
| C | 7 | 247 | 542 | 8.95 | 171 | 171 | 41.5 |
| D | 7 | 223 | 26220 | 614.97 | 169 | 165 | 42.4 |
| D | 1 | 52 | 19650 | 459.9 | 169 | 165 | 42.4 |
| D | 13 | 172 | 16015 | 374.11 | 169 | 165 | 42.4 |
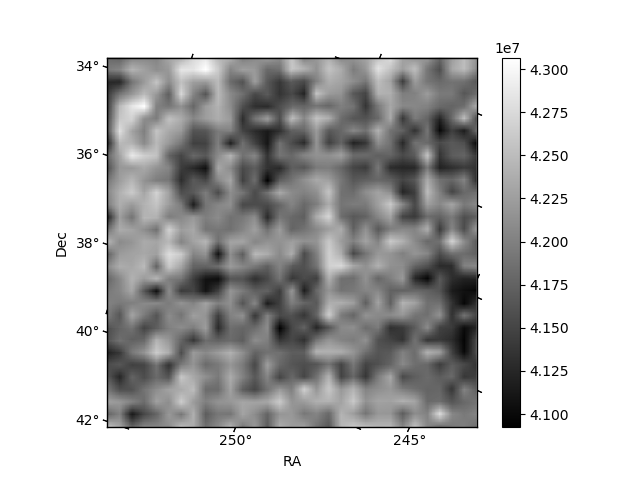
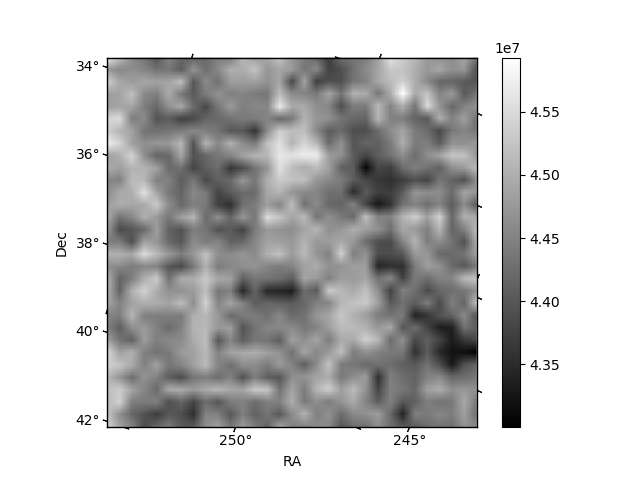
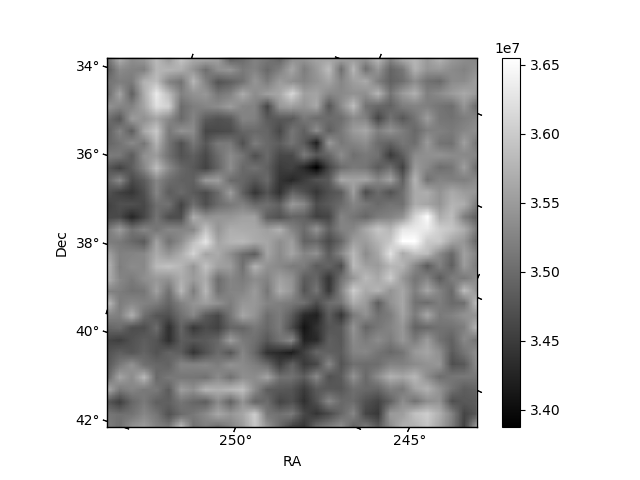
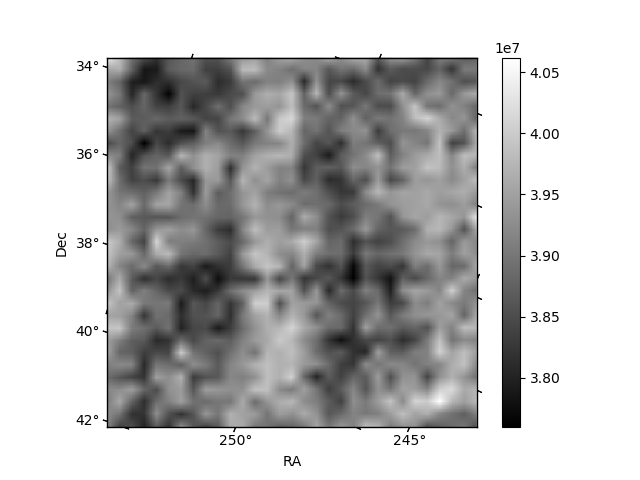
Histogram calculated using DETX and DETY for each event in the final _common_clean file
| Quadrant A | 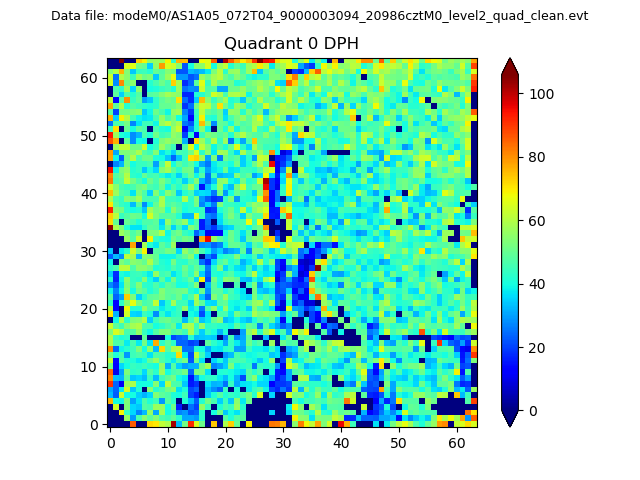 |
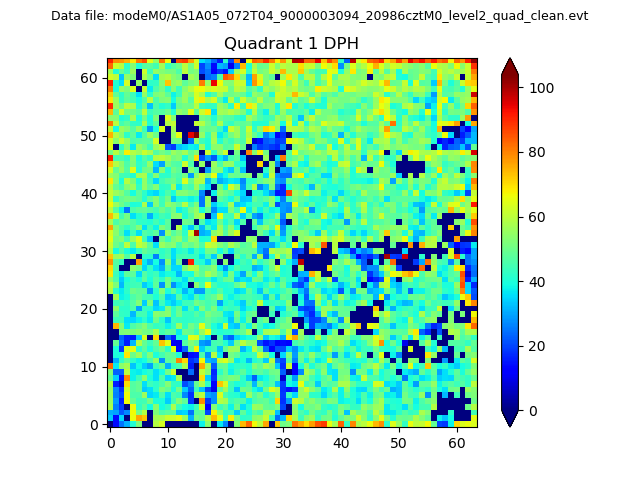 |
Quadrant B |
|---|---|---|---|
| Quadrant D | 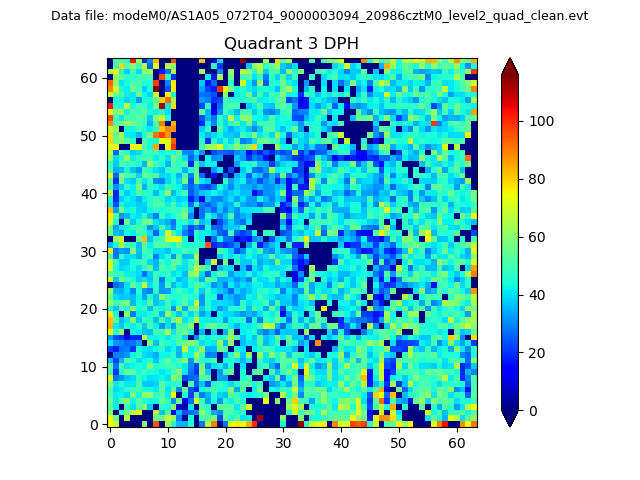 |
 |
Quadrant C |
| Plot type | Count rate plots | Images |
|---|---|---|
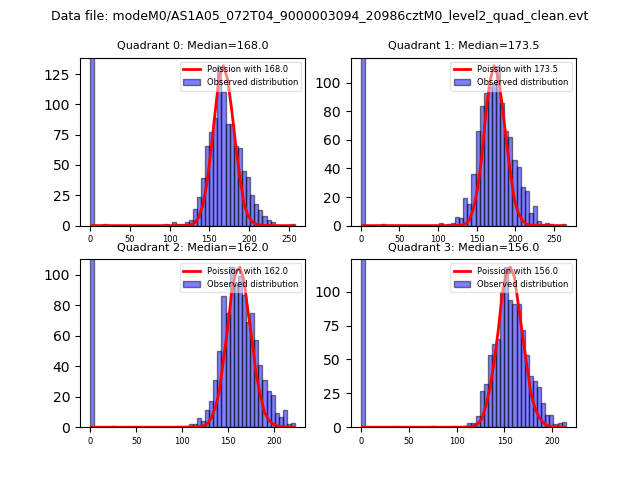
| Comparison with Poisson distribution Blue bars denote a histogram of data divided into 1 sec bins. Red curve is a Poisson curve with rate = median count rate of data. |
 |
 |
| Quadrant-wise count rates Data is divided into 100 sec bins |
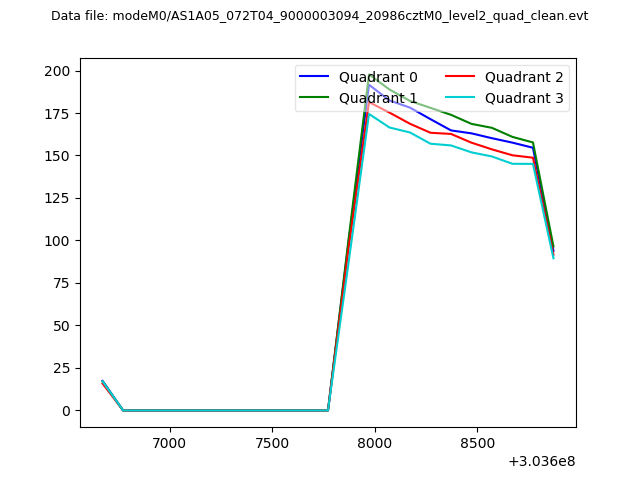 |
|
| Module-wise count rates for Quadrant A Data is divided into 100 sec bins |
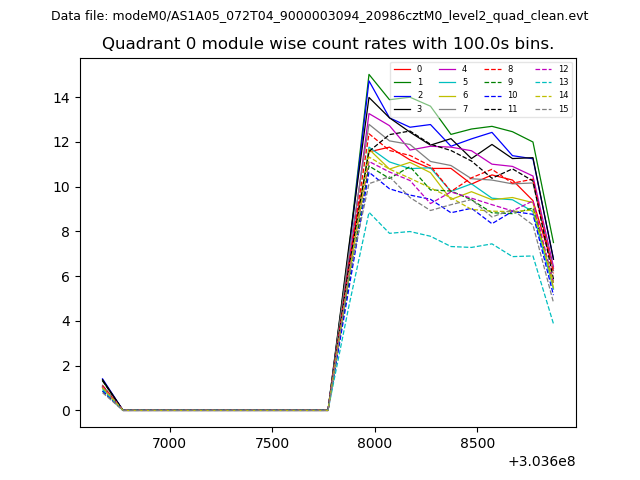 |
 |
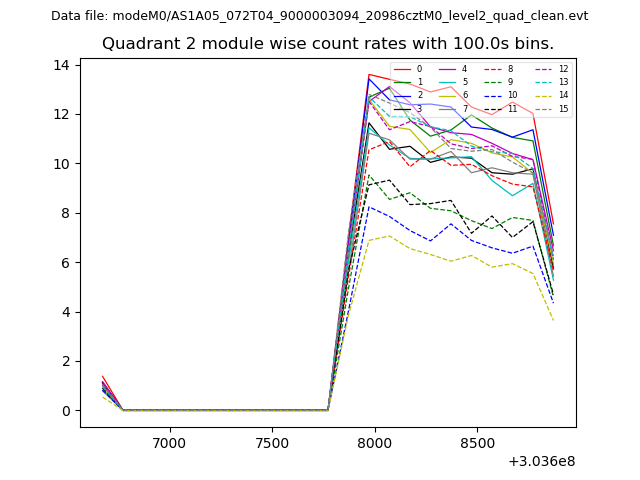
| Module-wise count rates for Quadrant B Data is divided into 100 sec bins |
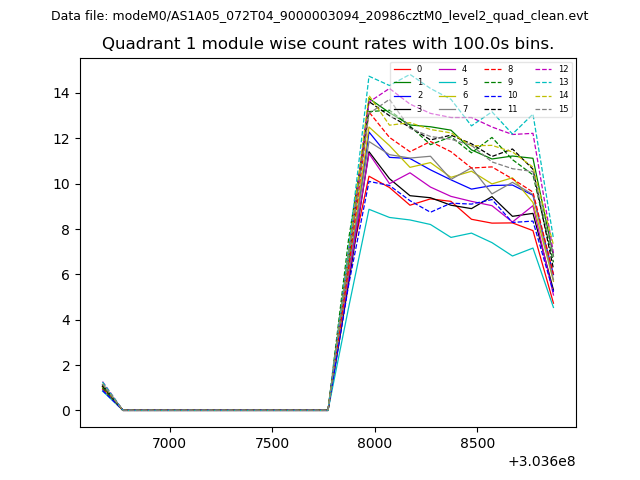 |
 |
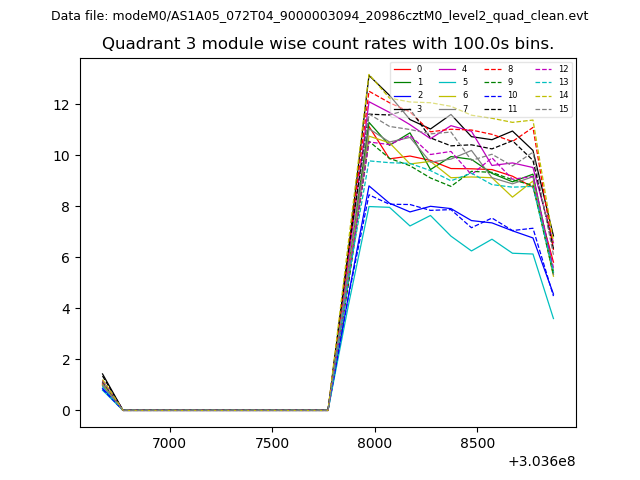
| Module-wise count rates for Quadrant C Data is divided into 100 sec bins |
 |
 |
| Module-wise count rates for Quadrant D Data is divided into 100 sec bins |
 |
 |
| Parameter | Plot |
|---|---|
| CZT HV Monitor | 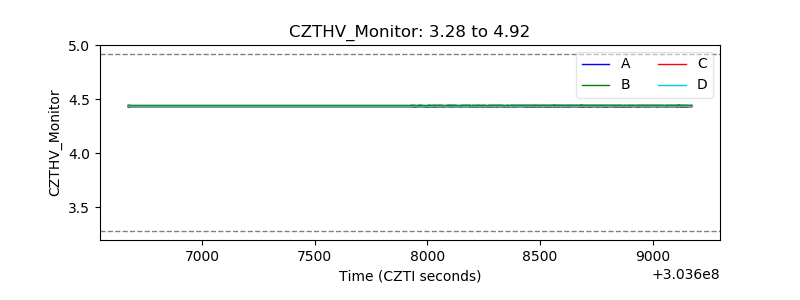 |
| D_VDD | 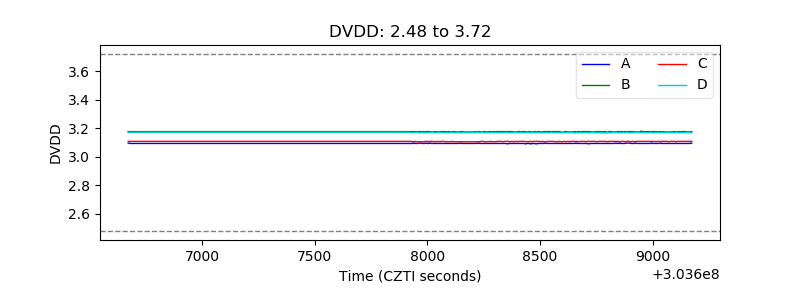 |
| Temperature 1 | 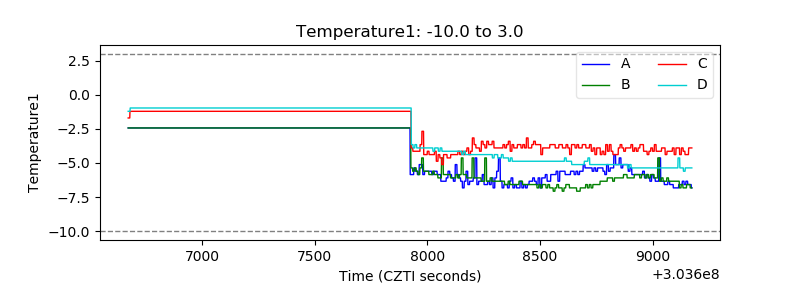 |
| Veto HV Monitor | 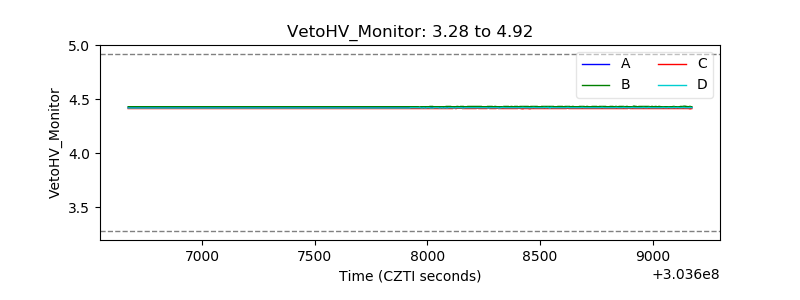 |
| Veto LLD | 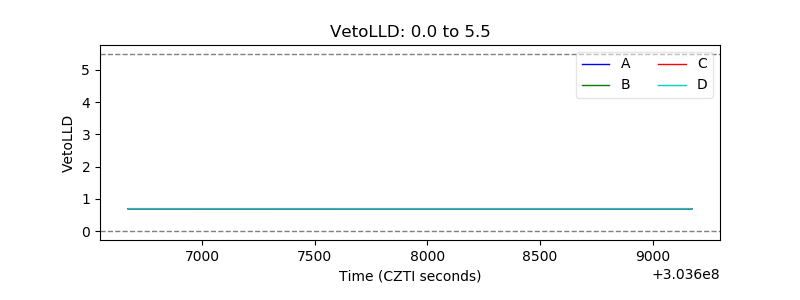 |
| Alpha Counter | 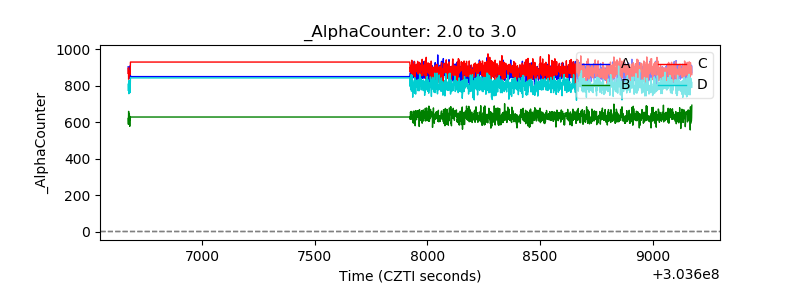 |
| _CPM_Rate | 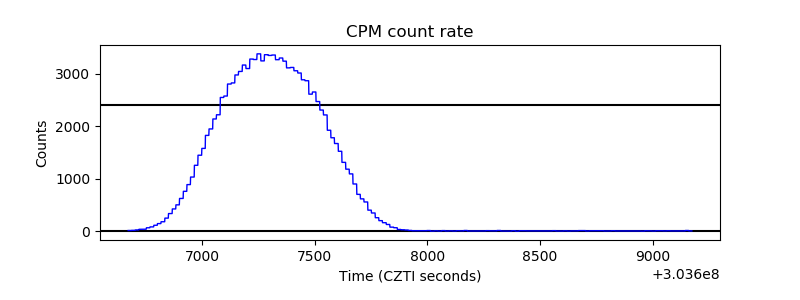 |
| CZT Counter |  |
| +2.5 Volts monitor |  |
| +5 Volts monitor | 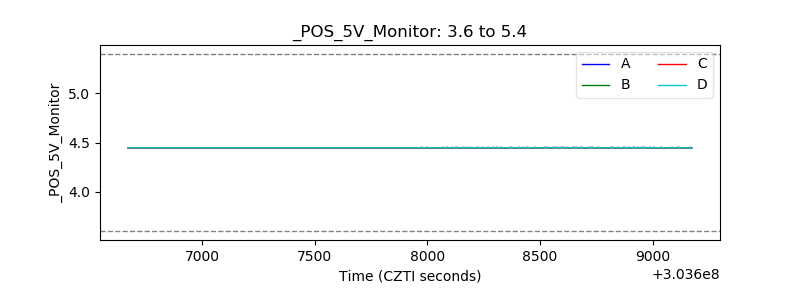 |
| _ROLL_ROT | 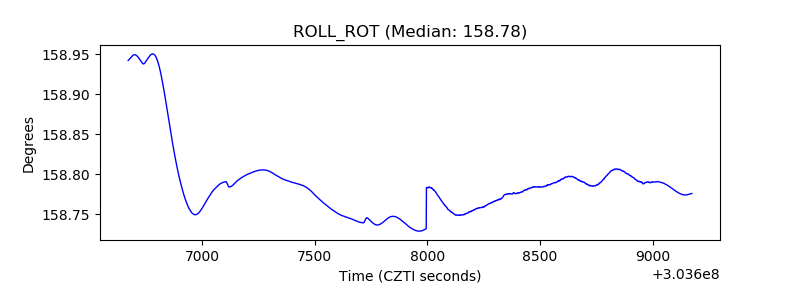 |
| _Roll_DEC | 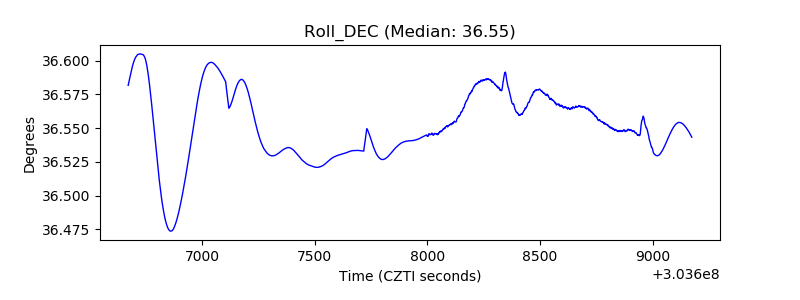 |
| _Roll_RA | 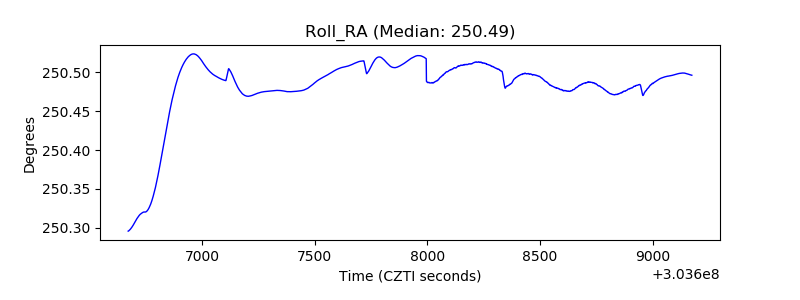 |
| Veto Counter | 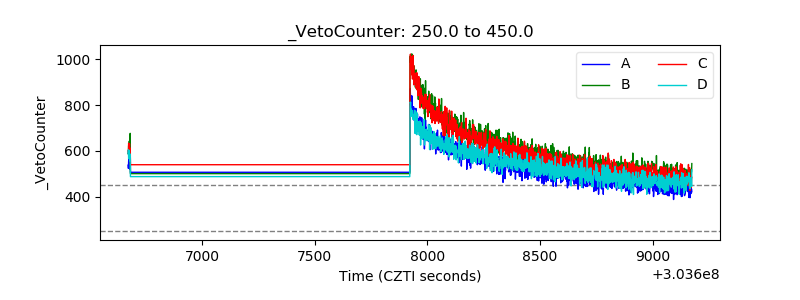 |