| Param | Original file | Final file |
|---|---|---|
| Filename | modeM0/AS1A05_072T04_9000003094_20987cztM0_level2.evt | modeM0/AS1A05_072T04_9000003094_20987cztM0_level2_quad_clean.evt |
| Size (bytes) | 444,764,160 | 85,268,160 |
| Size | 424.2 MB | 81.3 MB |
| Events in quadrant A | 3,140,791 | 549,967 |
| Events in quadrant B | 3,591,832 | 557,939 |
| Events in quadrant C | 3,186,164 | 527,141 |
| Events in quadrant D | 3,127,334 | 512,000 |
| Mode M9 | |||
|---|---|---|---|
| Quadrant | BADHDUFLAG | Total packets | Discarded packets |
| A | 0 | 19 | 0 |
| B | 0 | 20 | 0 |
| C | 0 | 20 | 0 |
| D | 0 | 20 | 0 |
| Mode SS | |||
|---|---|---|---|
| Quadrant | BADHDUFLAG | Total packets | Discarded packets |
| A | 0 | 126 | 0 |
| B | 0 | 126 | 0 |
| C | 0 | 126 | 0 |
| D | 0 | 126 | 0 |
| Mode M0 | |||
|---|---|---|---|
| Quadrant | BADHDUFLAG | Total packets | Discarded packets |
| A | 0 | 13108 | 3 |
| B | 0 | 14576 | 2 |
| C | 0 | 13210 | 2 |
| D | 0 | 13331 | 2 |
| Quadrant | Total seconds | Saturated seconds | Saturation percentage |
|---|---|---|---|
| A | 6236 | 43 | 0.689545% |
| B | 6236 | 103 | 1.651700% |
| C | 6236 | 69 | 1.106479% |
| D | 6236 | 24 | 0.384862% |
Noise dominated data is calculated using 1-second bins in cleaned event files. If a bin has >2000 counts, and if more than 50% of those come from <1% of pixels, then it is considered to be noise-dominated and hence unusable.
| Quadrant | # 1 sec bins | Bins with >0 counts | Bins with >2000 counts | High rate bins dominated by noise | Noise dominated (total time) | Noise dominated (detector-on time) | Marked lightcurve |
|---|---|---|---|---|---|---|---|
| A | 7542 | 6237 | 0 | 0 | 0.00% | 0.00% | 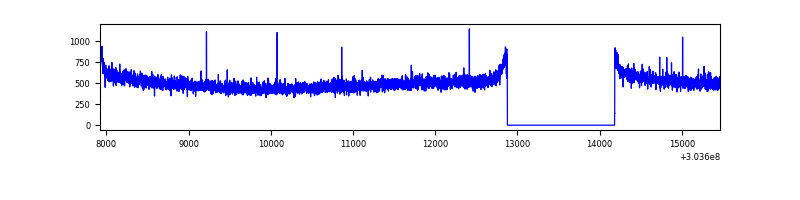 |
| B | 7542 | 6237 | 29 | 29 | 0.38% | 0.46% | 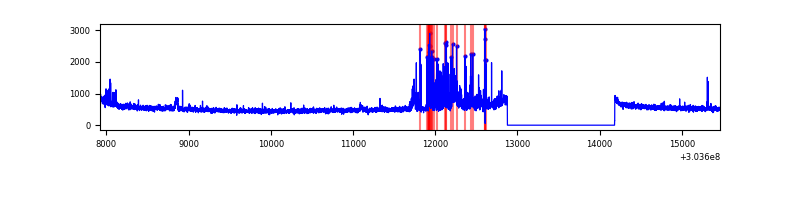 |
| C | 7542 | 6237 | 0 | 0 | 0.00% | 0.00% | 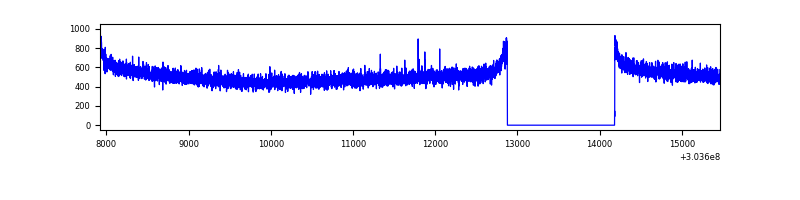 |
| D | 7542 | 6237 | 6 | 6 | 0.08% | 0.10% | 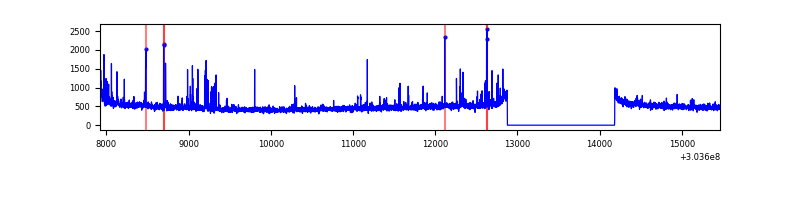 |
Top three noisy pixels from each quadrant. If the there are fewer than three noisy pixels in the level2.evt file, extra rows are filled as -1
| Pixel properties | Quadrant properties | ||||||
|---|---|---|---|---|---|---|---|
| Quadrant | DetID | PixID | Counts | Sigma | Mean | Median | Sigma |
| A | 0 | 226 | 6927 | 37.61 | 817 | 801 | 162.9 |
| A | 3 | 137 | 6074 | 32.38 | 817 | 801 | 162.9 |
| A | 12 | 194 | 5727 | 30.25 | 817 | 801 | 162.9 |
| B | 0 | 182 | 200705 | 1312.3 | 819 | 799 | 152.3 |
| B | 7 | 220 | 136887 | 893.36 | 819 | 799 | 152.3 |
| B | 0 | 230 | 22225 | 140.65 | 819 | 799 | 152.3 |
| C | 14 | 238 | 124688 | 683.99 | 783 | 790 | 181.1 |
| C | 13 | 61 | 5596 | 26.53 | 783 | 790 | 181.1 |
| C | 3 | 233 | 3872 | 17.01 | 783 | 790 | 181.1 |
| D | 7 | 223 | 72273 | 375.29 | 784 | 762 | 190.5 |
| D | 1 | 52 | 52079 | 269.31 | 784 | 762 | 190.5 |
| D | 2 | 234 | 20912 | 105.75 | 784 | 762 | 190.5 |
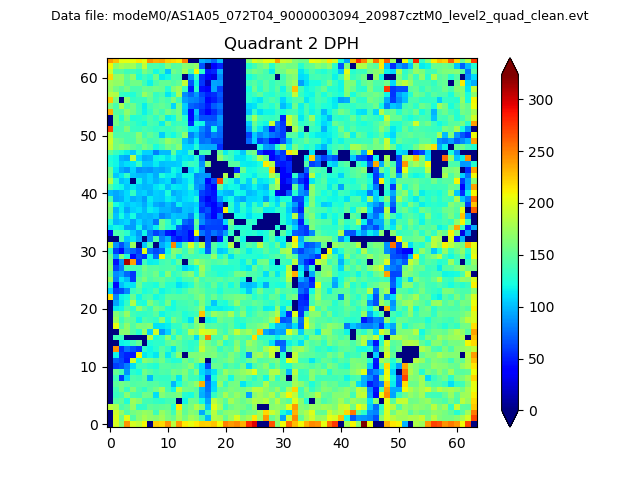
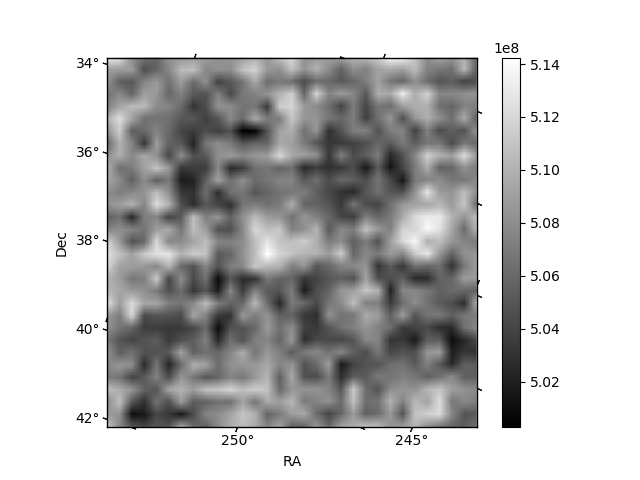
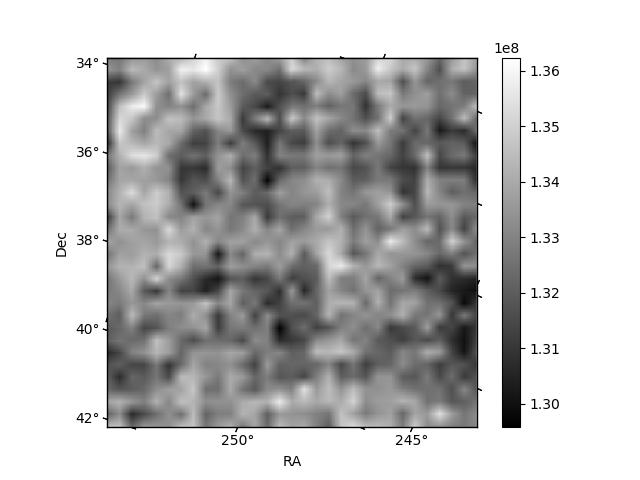
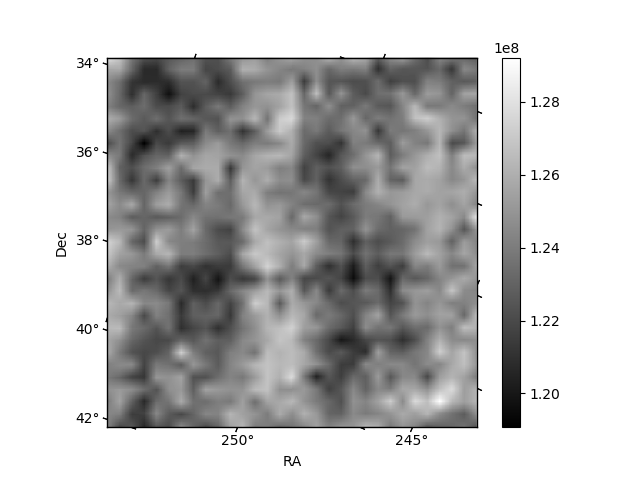
Histogram calculated using DETX and DETY for each event in the final _common_clean file
| Quadrant A | 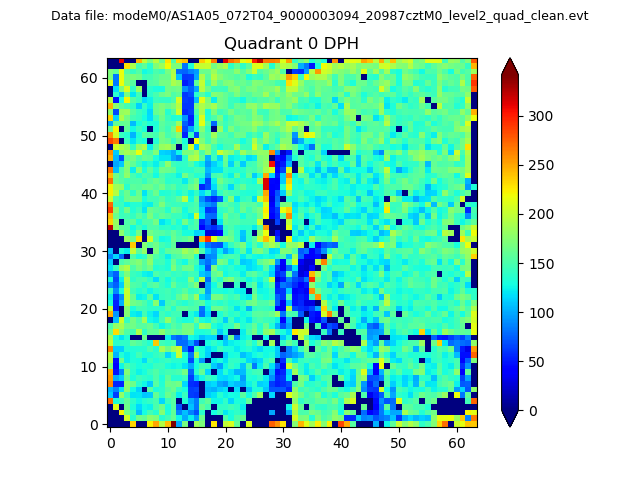 |
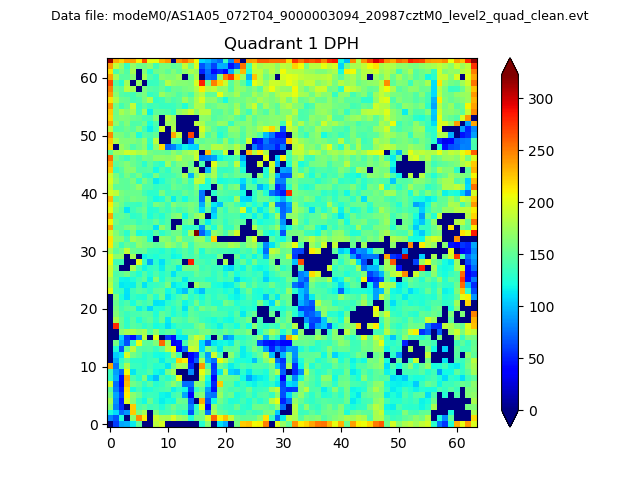 |
Quadrant B |
|---|---|---|---|
| Quadrant D | 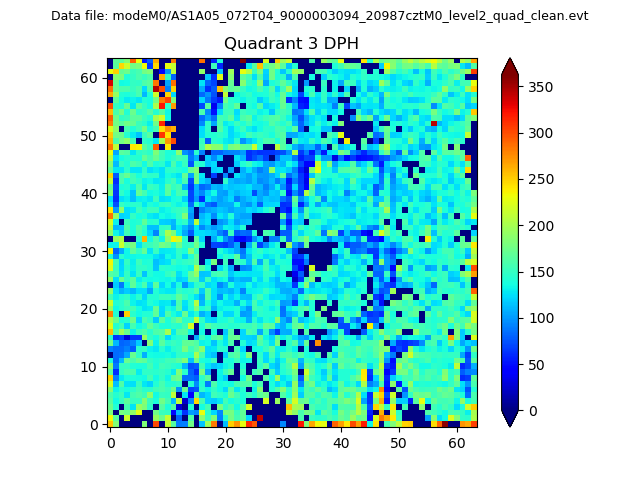 |
 |
Quadrant C |
| Plot type | Count rate plots | Images |
|---|---|---|
| Comparison with Poisson distribution Blue bars denote a histogram of data divided into 1 sec bins. Red curve is a Poisson curve with rate = median count rate of data. |
 |
 |
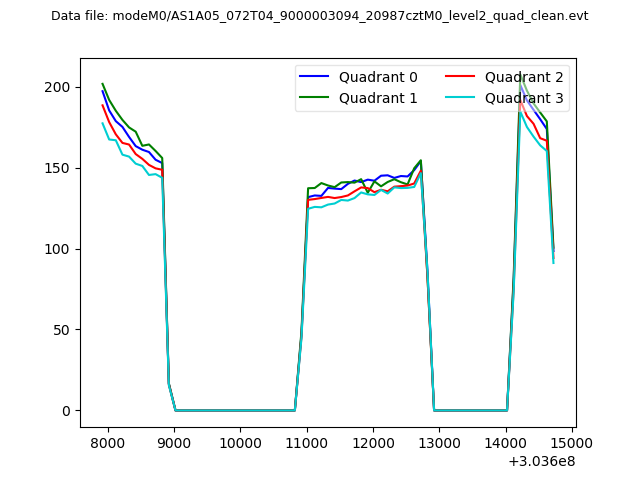
| Quadrant-wise count rates Data is divided into 100 sec bins |
 |
|
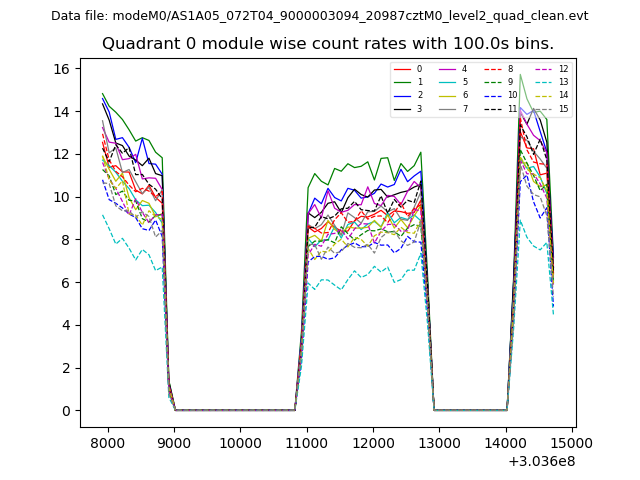
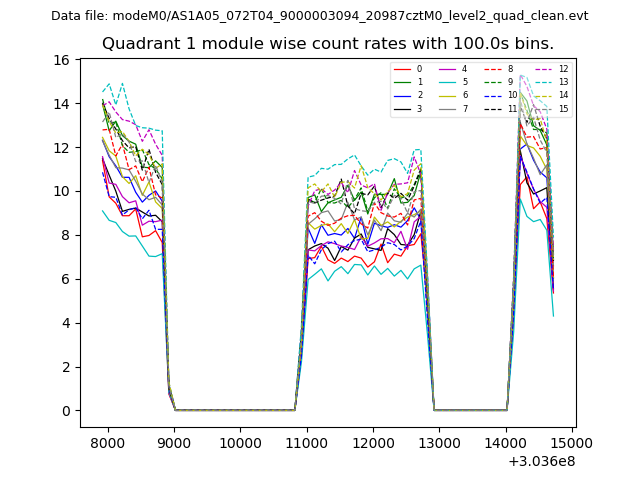
| Module-wise count rates for Quadrant A Data is divided into 100 sec bins |
 |
 |
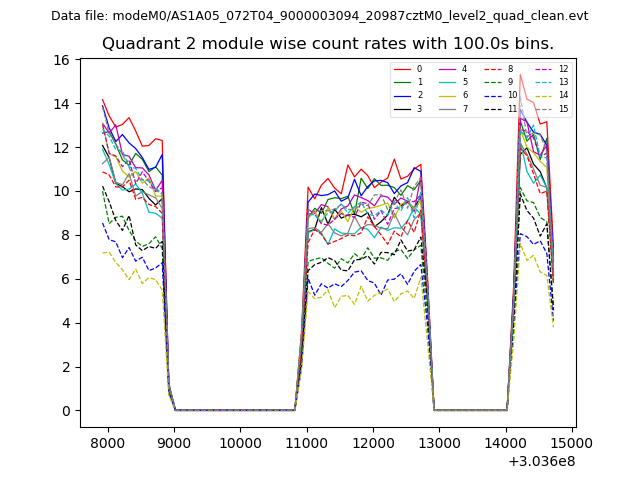
| Module-wise count rates for Quadrant B Data is divided into 100 sec bins |
 |
 |
| Module-wise count rates for Quadrant C Data is divided into 100 sec bins |
 |
 |
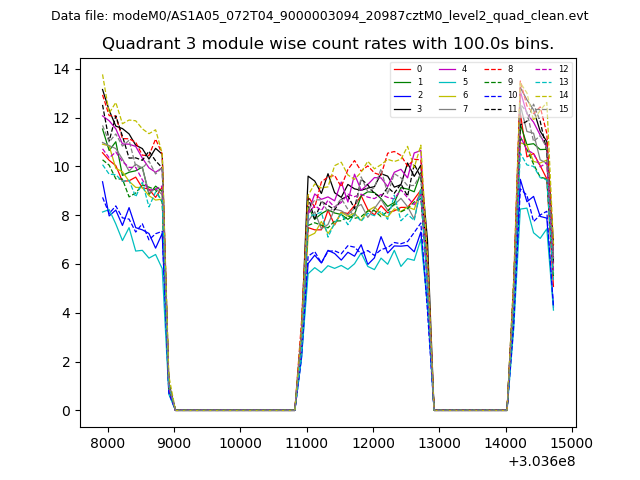
| Module-wise count rates for Quadrant D Data is divided into 100 sec bins |
 |
 |
| Parameter | Plot |
|---|---|
| CZT HV Monitor | 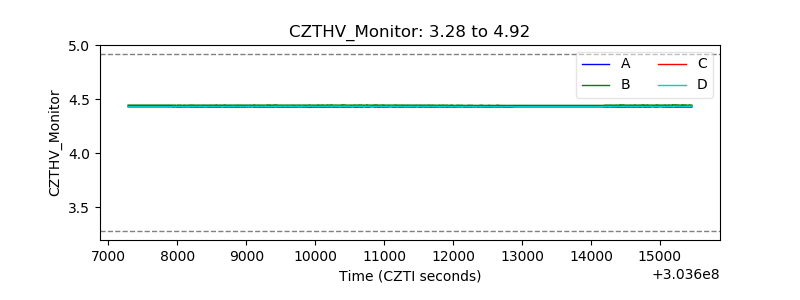 |
| D_VDD | 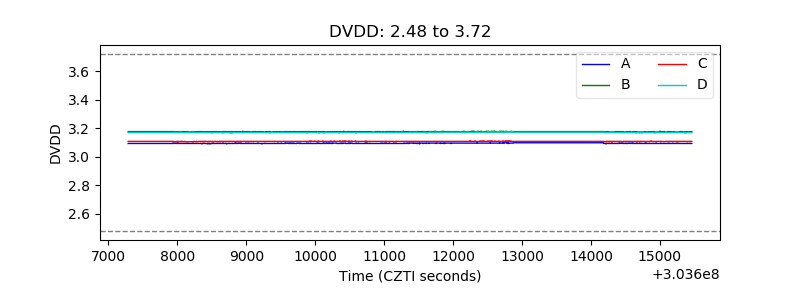 |
| Temperature 1 | 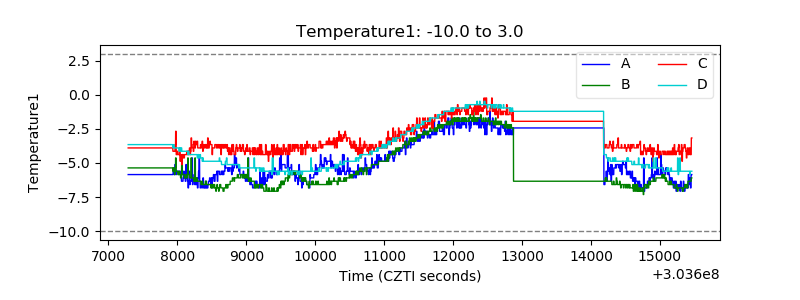 |
| Veto HV Monitor | 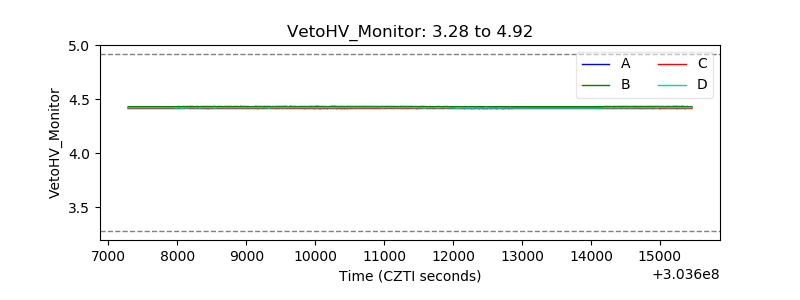 |
| Veto LLD | 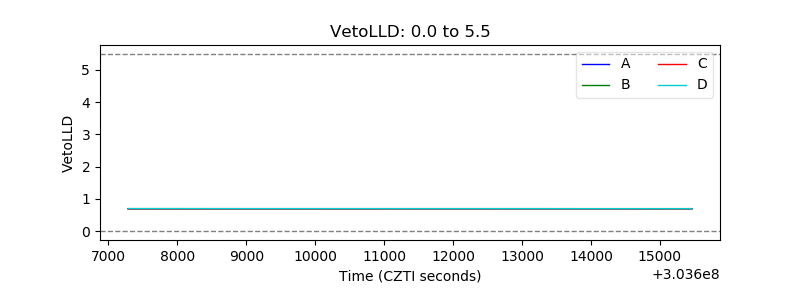 |
| Alpha Counter | 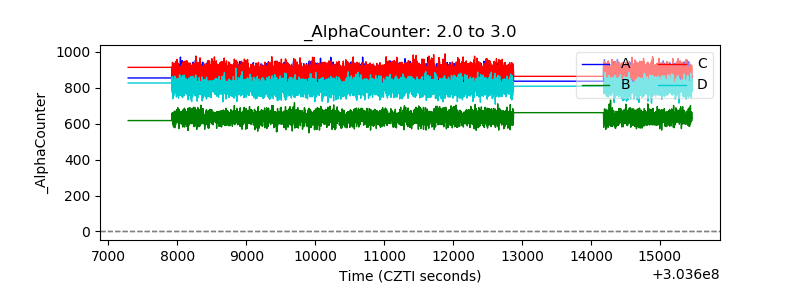 |
| _CPM_Rate |  |
| CZT Counter | 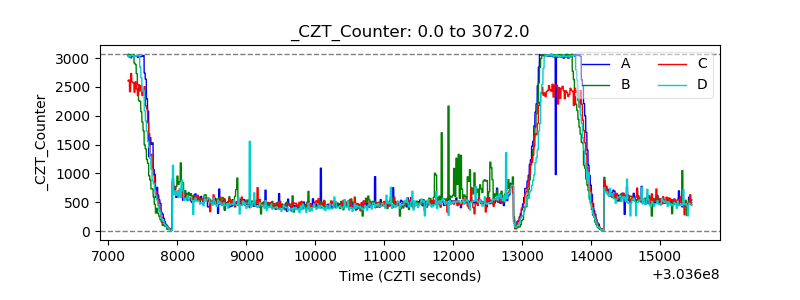 |
| +2.5 Volts monitor |  |
| +5 Volts monitor |  |
| _ROLL_ROT | 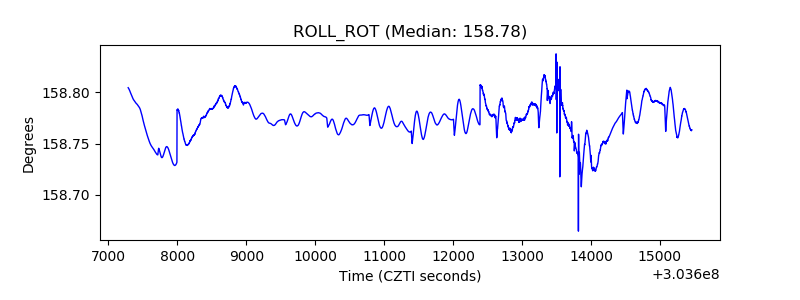 |
| _Roll_DEC | 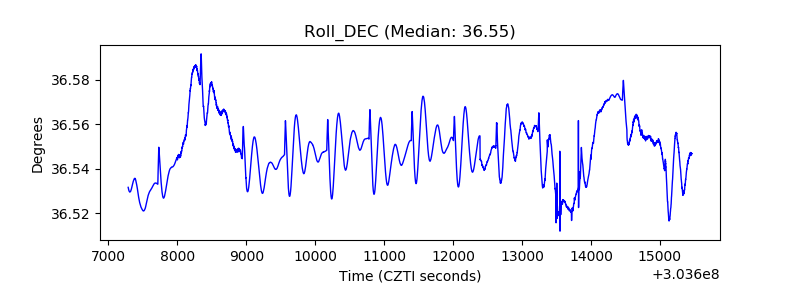 |
| _Roll_RA | 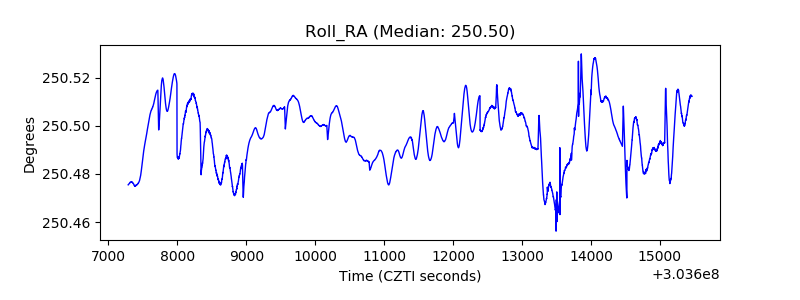 |
| Veto Counter | 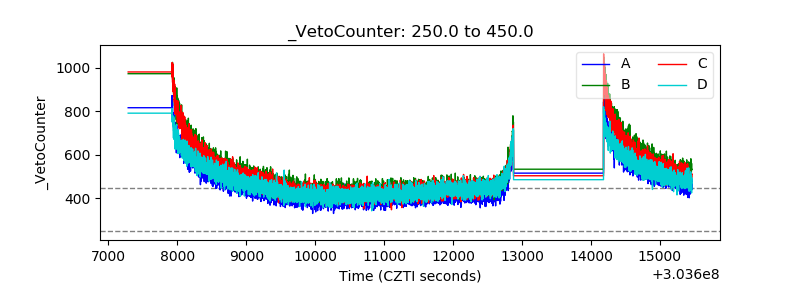 |