| Param | Original file | Final file |
|---|---|---|
| Filename | modeM0/AS1A05_072T04_9000003094_20991cztM0_level2.evt | modeM0/AS1A05_072T04_9000003094_20991cztM0_level2_quad_clean.evt |
| Size (bytes) | 545,091,840 | 86,273,280 |
| Size | 519.8 MB | 82.3 MB |
| Events in quadrant A | 3,374,299 | 553,407 |
| Events in quadrant B | 3,657,030 | 552,190 |
| Events in quadrant C | 3,384,626 | 528,300 |
| Events in quadrant D | 5,618,641 | 492,500 |
| Mode M9 | |||
|---|---|---|---|
| Quadrant | BADHDUFLAG | Total packets | Discarded packets |
| A | 0 | 9 | 0 |
| B | 0 | 10 | 0 |
| C | 0 | 10 | 0 |
| D | 0 | 10 | 0 |
| Mode SS | |||
|---|---|---|---|
| Quadrant | BADHDUFLAG | Total packets | Discarded packets |
| A | 0 | 140 | 0 |
| B | 0 | 140 | 0 |
| C | 0 | 140 | 0 |
| D | 0 | 140 | 0 |
| Mode M0 | |||
|---|---|---|---|
| Quadrant | BADHDUFLAG | Total packets | Discarded packets |
| A | 0 | 14398 | 2 |
| B | 0 | 15130 | 2 |
| C | 0 | 14400 | 2 |
| D | 0 | 21210 | 2 |
| Quadrant | Total seconds | Saturated seconds | Saturation percentage |
|---|---|---|---|
| A | 6979 | 159 | 2.278263% |
| B | 6979 | 208 | 2.980370% |
| C | 6979 | 183 | 2.622152% |
| D | 6979 | 915 | 13.110761% |
Noise dominated data is calculated using 1-second bins in cleaned event files. If a bin has >2000 counts, and if more than 50% of those come from <1% of pixels, then it is considered to be noise-dominated and hence unusable.
| Quadrant | # 1 sec bins | Bins with >0 counts | Bins with >2000 counts | High rate bins dominated by noise | Noise dominated (total time) | Noise dominated (detector-on time) | Marked lightcurve |
|---|---|---|---|---|---|---|---|
| A | 7659 | 6980 | 0 | 0 | 0.00% | 0.00% | 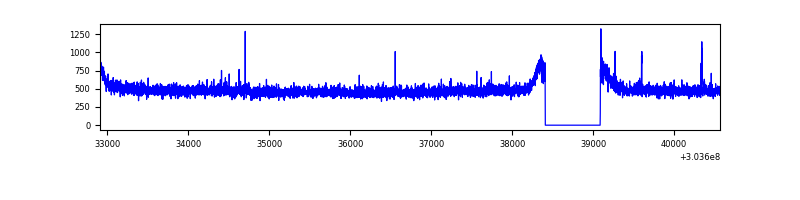 |
| B | 7659 | 6980 | 25 | 25 | 0.33% | 0.36% | 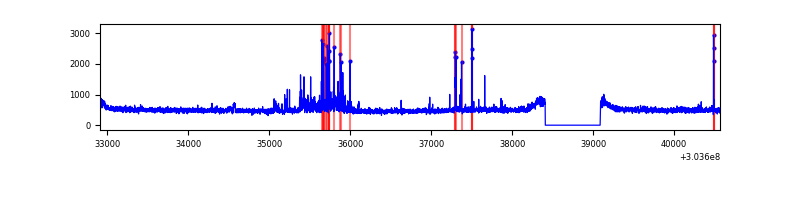 |
| C | 7659 | 6980 | 0 | 0 | 0.00% | 0.00% | 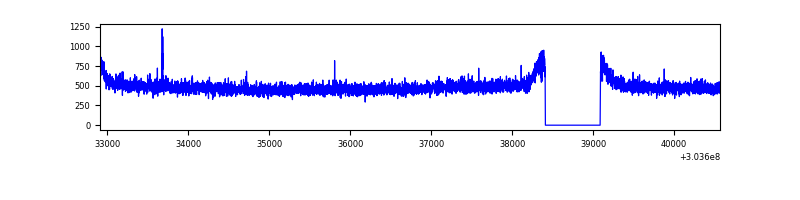 |
| D | 7659 | 6980 | 804 | 804 | 10.50% | 11.52% | 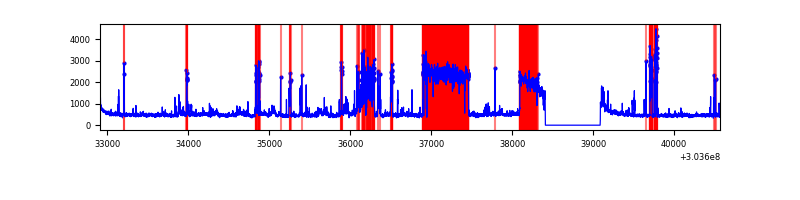 |
Top three noisy pixels from each quadrant. If the there are fewer than three noisy pixels in the level2.evt file, extra rows are filled as -1
| Pixel properties | Quadrant properties | ||||||
|---|---|---|---|---|---|---|---|
| Quadrant | DetID | PixID | Counts | Sigma | Mean | Median | Sigma |
| A | 12 | 96 | 20705 | 112.31 | 871 | 853 | 176.8 |
| A | 0 | 226 | 7577 | 38.04 | 871 | 853 | 176.8 |
| A | 3 | 137 | 7124 | 35.48 | 871 | 853 | 176.8 |
| B | 7 | 220 | 136984 | 819.83 | 865 | 843 | 166.1 |
| B | 3 | 64 | 50680 | 300.12 | 865 | 843 | 166.1 |
| B | 12 | 111 | 19629 | 113.13 | 865 | 843 | 166.1 |
| C | 14 | 238 | 130983 | 670.33 | 833 | 837 | 194.2 |
| C | 13 | 61 | 5739 | 25.25 | 833 | 837 | 194.2 |
| C | 9 | 54 | 4974 | 21.31 | 833 | 837 | 194.2 |
| D | 1 | 52 | 1923646 | 9734.37 | 812 | 787 | 197.5 |
| D | 1 | 239 | 510052 | 2578.13 | 812 | 787 | 197.5 |
| D | 7 | 38 | 84839 | 425.51 | 812 | 787 | 197.5 |
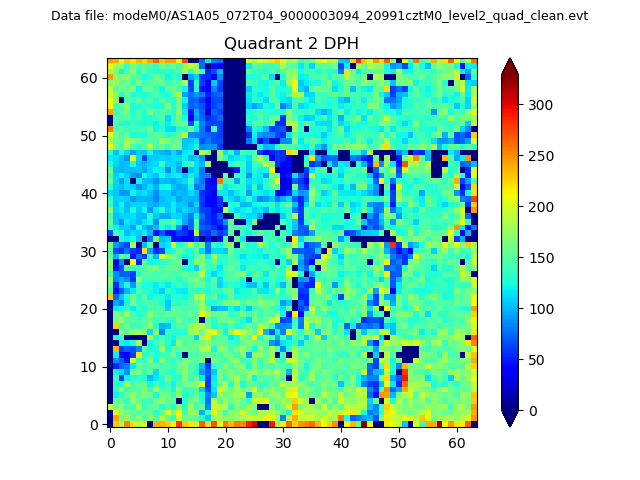
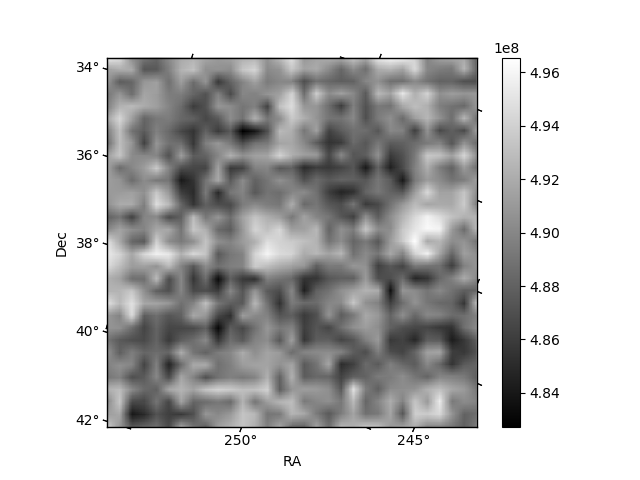
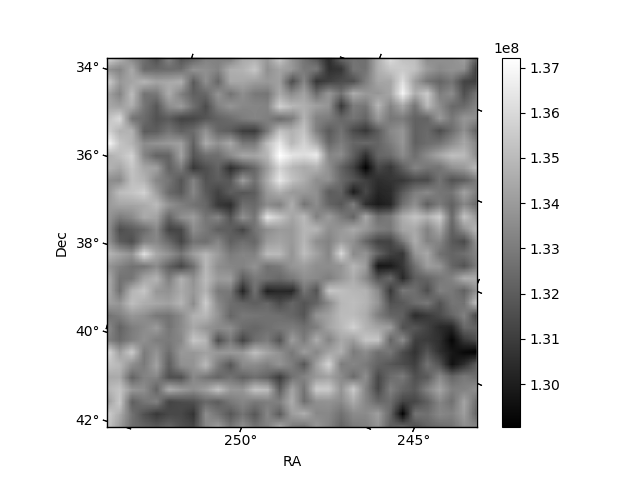
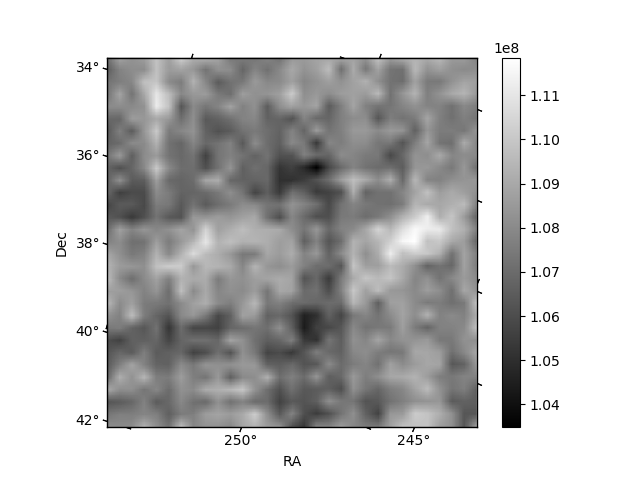
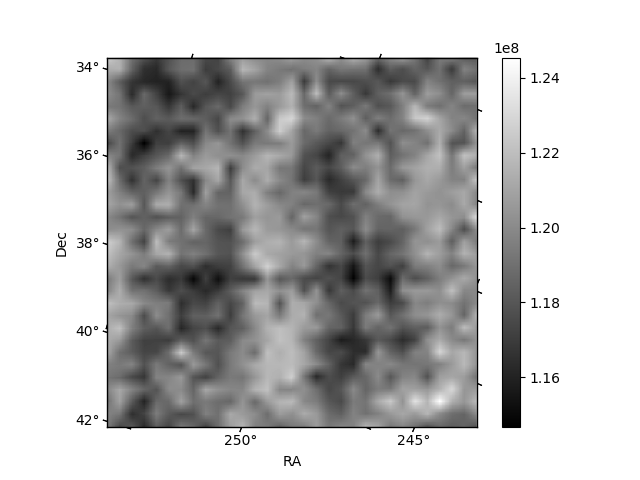
Histogram calculated using DETX and DETY for each event in the final _common_clean file
| Quadrant A | 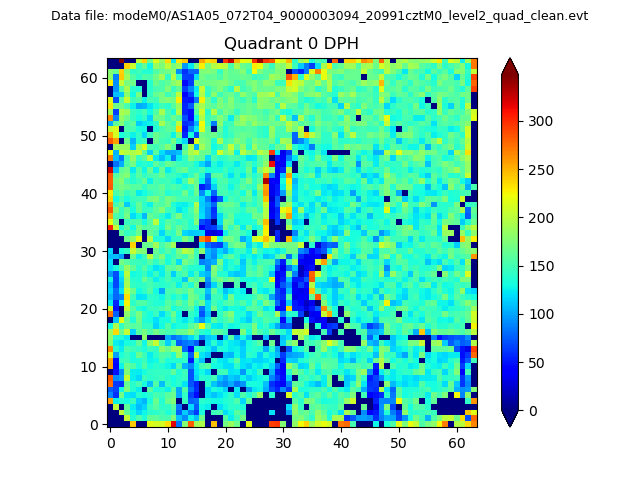 |
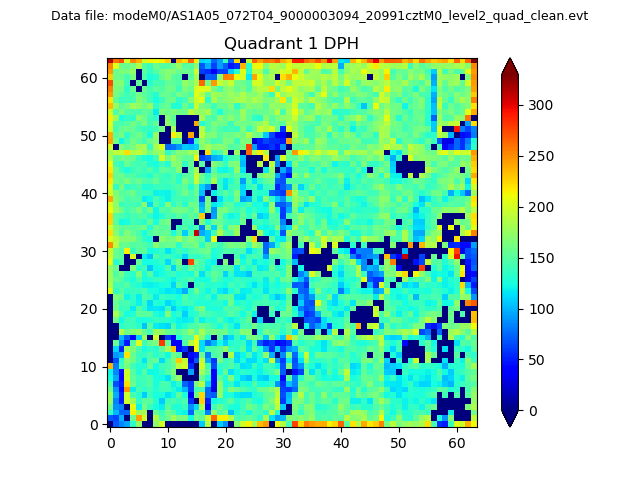 |
Quadrant B |
|---|---|---|---|
| Quadrant D | 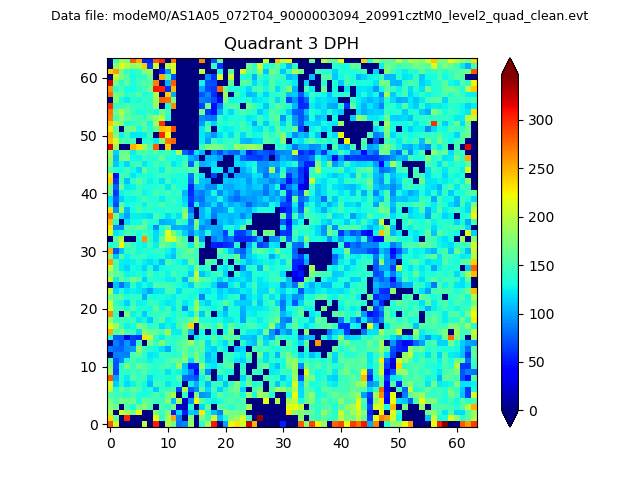 |
 |
Quadrant C |
| Plot type | Count rate plots | Images |
|---|---|---|
| Comparison with Poisson distribution Blue bars denote a histogram of data divided into 1 sec bins. Red curve is a Poisson curve with rate = median count rate of data. |
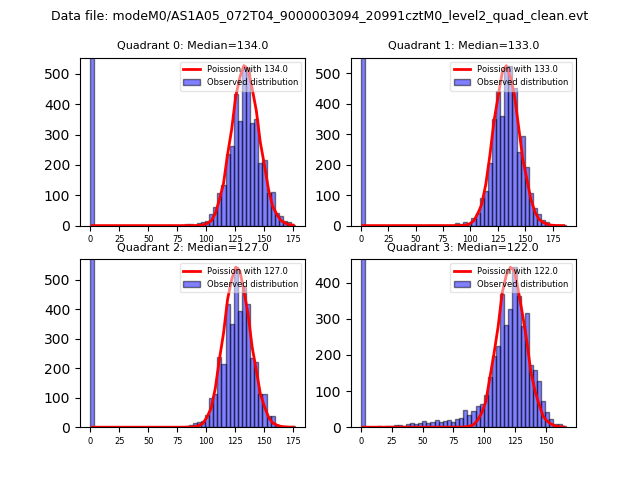 |
 |
| Quadrant-wise count rates Data is divided into 100 sec bins |
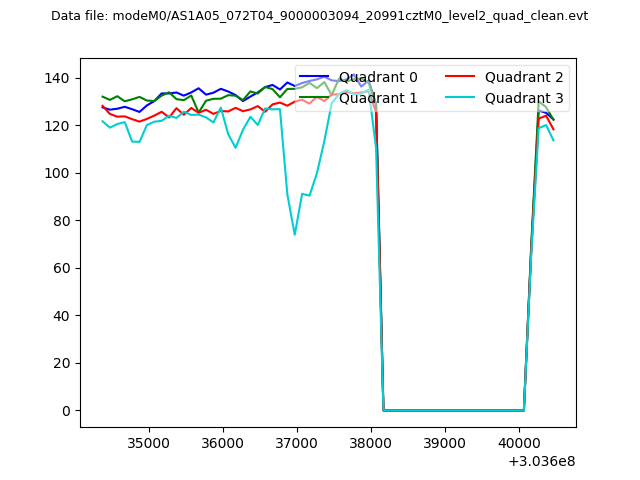 |
|
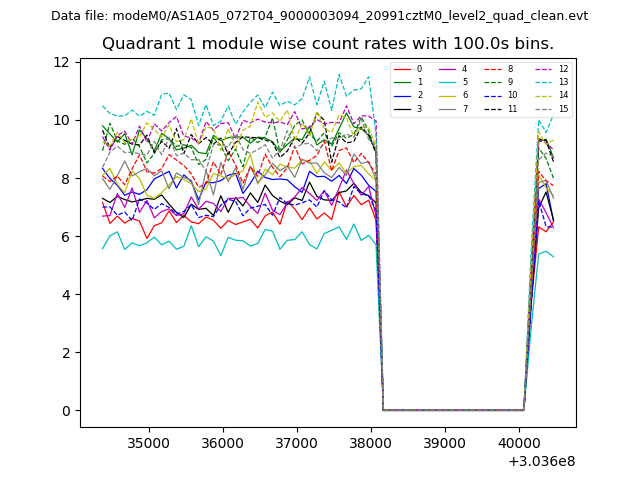
| Module-wise count rates for Quadrant A Data is divided into 100 sec bins |
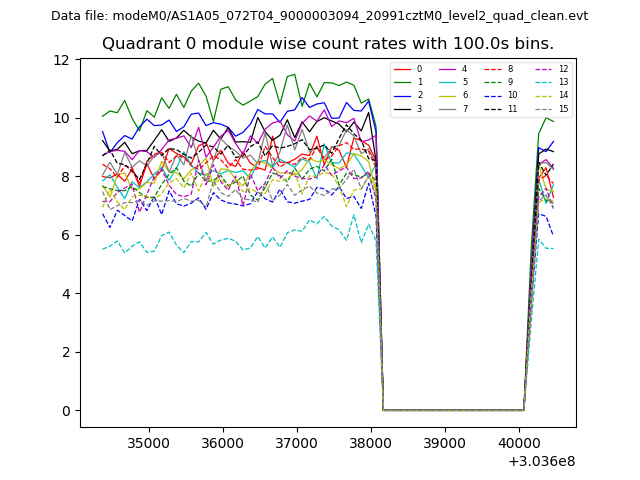 |
 |
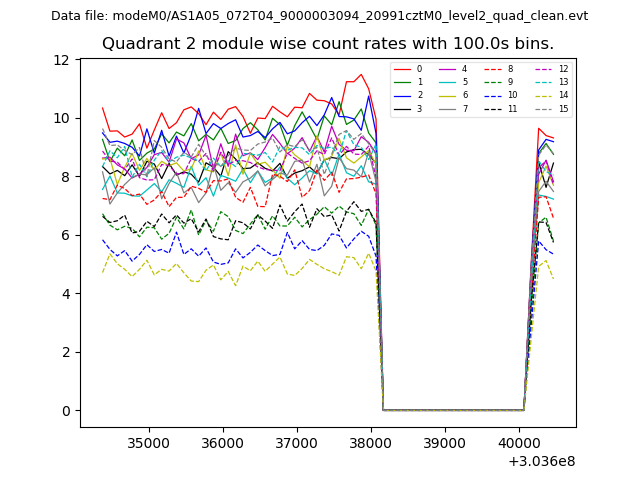
| Module-wise count rates for Quadrant B Data is divided into 100 sec bins |
 |
 |
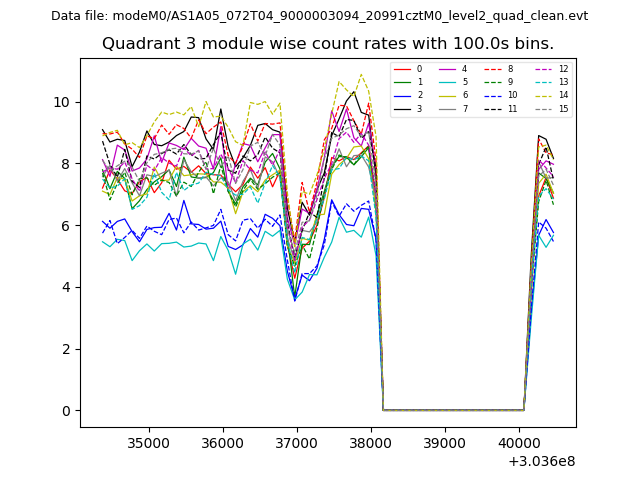
| Module-wise count rates for Quadrant C Data is divided into 100 sec bins |
 |
 |
| Module-wise count rates for Quadrant D Data is divided into 100 sec bins |
 |
 |
| Parameter | Plot |
|---|---|
| CZT HV Monitor | 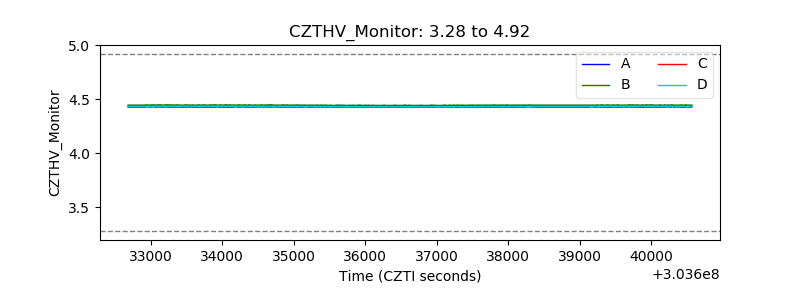 |
| D_VDD | 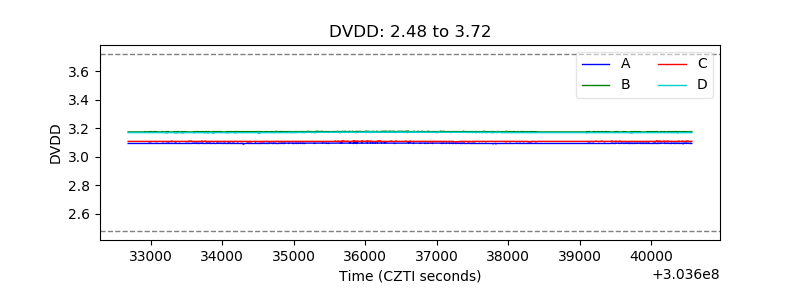 |
| Temperature 1 | 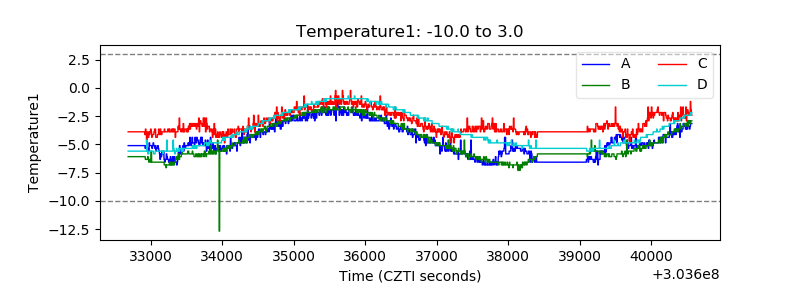 |
| Veto HV Monitor | 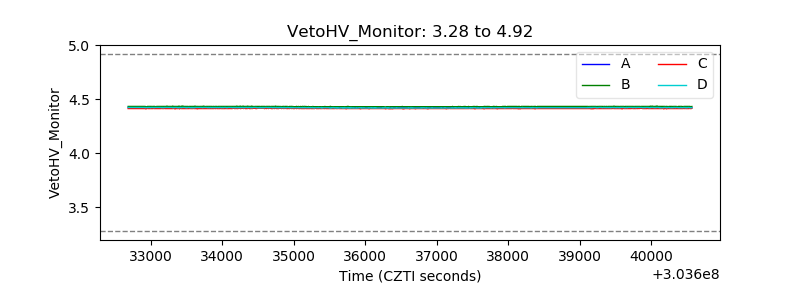 |
| Veto LLD | 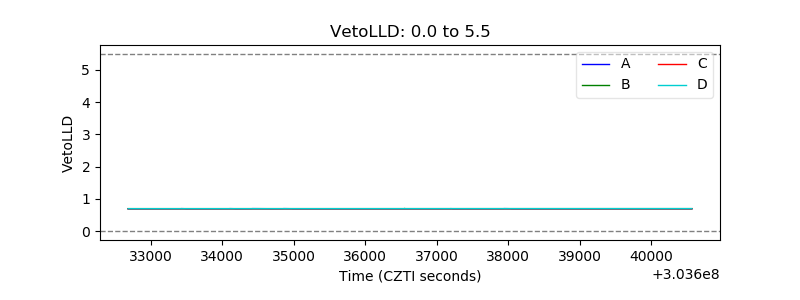 |
| Alpha Counter | 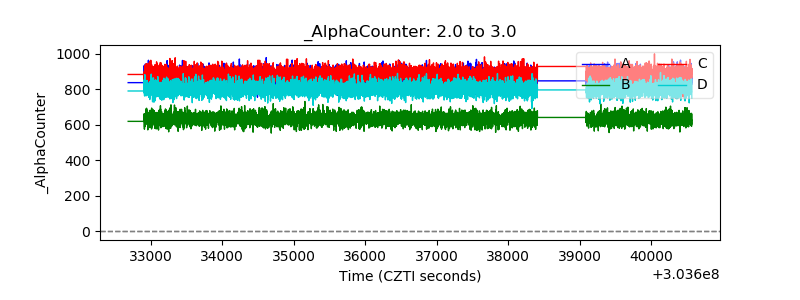 |
| _CPM_Rate | 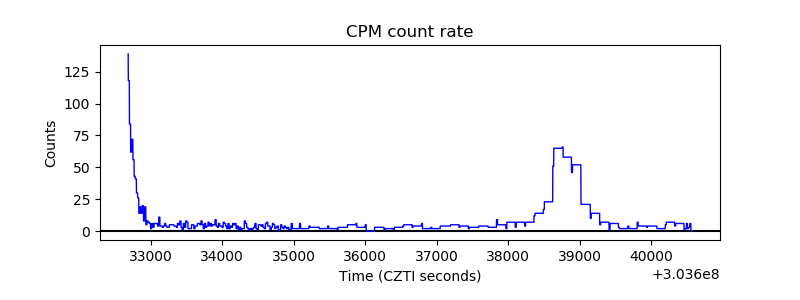 |
| CZT Counter | 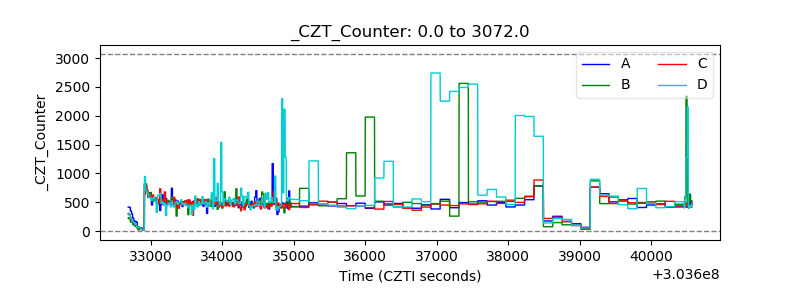 |
| +2.5 Volts monitor |  |
| +5 Volts monitor | 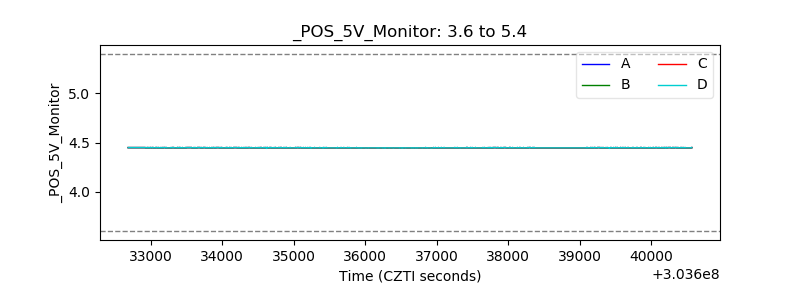 |
| _ROLL_ROT | 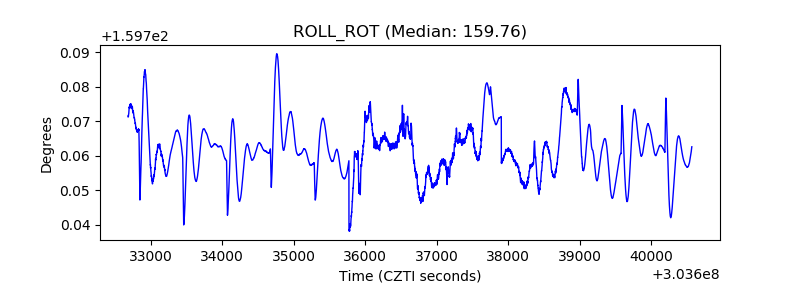 |
| _Roll_DEC | 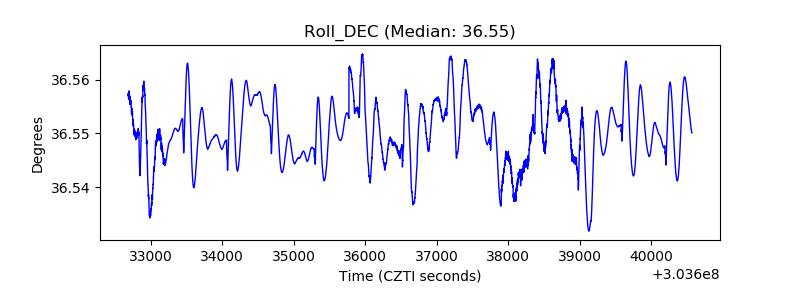 |
| _Roll_RA | 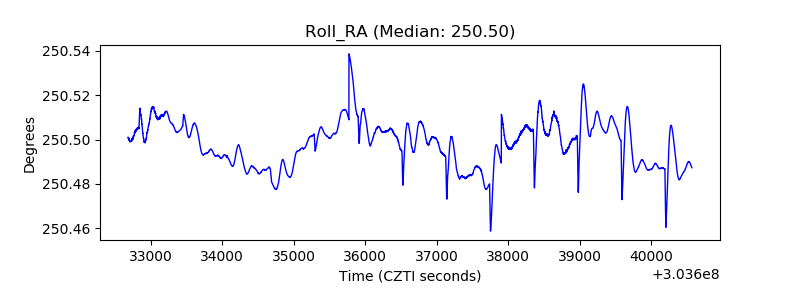 |
| Veto Counter | 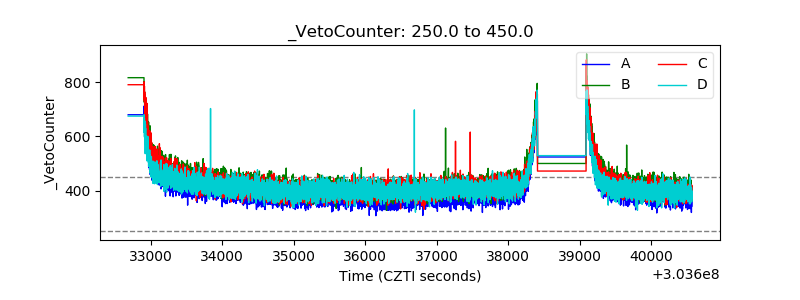 |