| Param | Original file | Final file |
|---|---|---|
| Filename | modeM0/AS1A05_072T04_9000003094_20996cztM0_level2.evt | modeM0/AS1A05_072T04_9000003094_20996cztM0_level2_quad_clean.evt |
| Size (bytes) | 1,283,572,800 | 242,688,960 |
| Size | 1.2 GB | 231.4 MB |
| Events in quadrant A | 8,418,919 | 1,575,829 |
| Events in quadrant B | 9,221,961 | 1,565,917 |
| Events in quadrant C | 8,654,642 | 1,504,786 |
| Events in quadrant D | 11,339,238 | 1,441,675 |
| Mode M9 | |||
|---|---|---|---|
| Quadrant | BADHDUFLAG | Total packets | Discarded packets |
| A | 0 | 18 | 0 |
| B | 0 | 18 | 0 |
| C | 0 | 18 | 0 |
| D | 0 | 18 | 0 |
| Mode SS | |||
|---|---|---|---|
| Quadrant | BADHDUFLAG | Total packets | Discarded packets |
| A | 0 | 372 | 0 |
| B | 0 | 372 | 0 |
| C | 0 | 372 | 0 |
| D | 0 | 372 | 0 |
| Mode M0 | |||
|---|---|---|---|
| Quadrant | BADHDUFLAG | Total packets | Discarded packets |
| A | 0 | 37402 | 3 |
| B | 0 | 39312 | 3 |
| C | 0 | 37706 | 3 |
| D | 0 | 46402 | 3 |
| Quadrant | Total seconds | Saturated seconds | Saturation percentage |
|---|---|---|---|
| A | 18315 | 148 | 0.808081% |
| B | 18316 | 221 | 1.206595% |
| C | 18316 | 258 | 1.408604% |
| D | 18316 | 836 | 4.564315% |
Noise dominated data is calculated using 1-second bins in cleaned event files. If a bin has >2000 counts, and if more than 50% of those come from <1% of pixels, then it is considered to be noise-dominated and hence unusable.
| Quadrant | # 1 sec bins | Bins with >0 counts | Bins with >2000 counts | High rate bins dominated by noise | Noise dominated (total time) | Noise dominated (detector-on time) | Marked lightcurve |
|---|---|---|---|---|---|---|---|
| A | 20090 | 18318 | 0 | 0 | 0.00% | 0.00% | 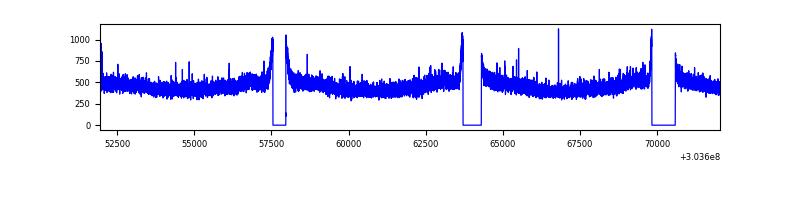 |
| B | 20091 | 18319 | 33 | 33 | 0.16% | 0.18% | 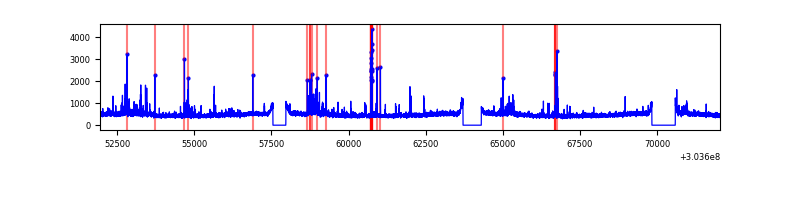 |
| C | 20091 | 18319 | 9 | 9 | 0.04% | 0.05% | 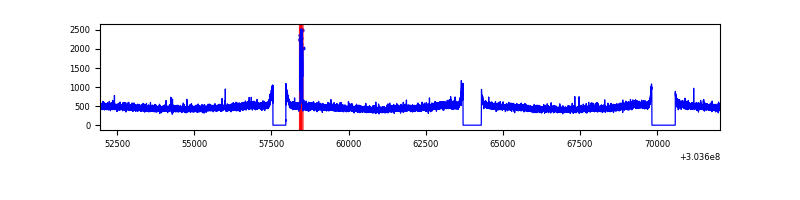 |
| D | 20091 | 18319 | 654 | 654 | 3.26% | 3.57% | 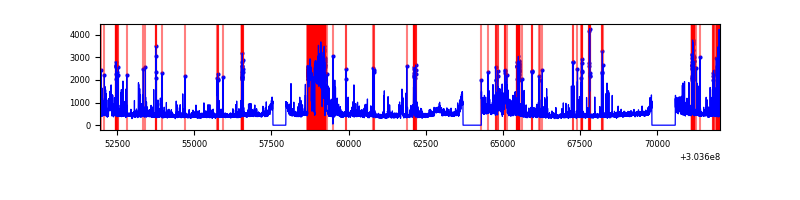 |
Top three noisy pixels from each quadrant. If the there are fewer than three noisy pixels in the level2.evt file, extra rows are filled as -1
| Pixel properties | Quadrant properties | ||||||
|---|---|---|---|---|---|---|---|
| Quadrant | DetID | PixID | Counts | Sigma | Mean | Median | Sigma |
| A | 0 | 226 | 18655 | 37.53 | 2190 | 2140 | 440.0 |
| A | 3 | 137 | 18026 | 36.1 | 2190 | 2140 | 440.0 |
| A | 12 | 194 | 15619 | 30.63 | 2190 | 2140 | 440.0 |
| B | 7 | 220 | 183566 | 443.14 | 2173 | 2118 | 409.5 |
| B | 3 | 64 | 149282 | 359.41 | 2173 | 2118 | 409.5 |
| B | 4 | 216 | 116398 | 279.1 | 2173 | 2118 | 409.5 |
| C | 14 | 238 | 325990 | 657.66 | 2098 | 2110 | 492.5 |
| C | 7 | 247 | 98998 | 196.74 | 2098 | 2110 | 492.5 |
| C | 3 | 233 | 23396 | 43.22 | 2098 | 2110 | 492.5 |
| D | 7 | 238 | 1199839 | 2362.37 | 2100 | 2041 | 507.0 |
| D | 1 | 52 | 633720 | 1245.83 | 2100 | 2041 | 507.0 |
| D | 1 | 239 | 621482 | 1221.7 | 2100 | 2041 | 507.0 |
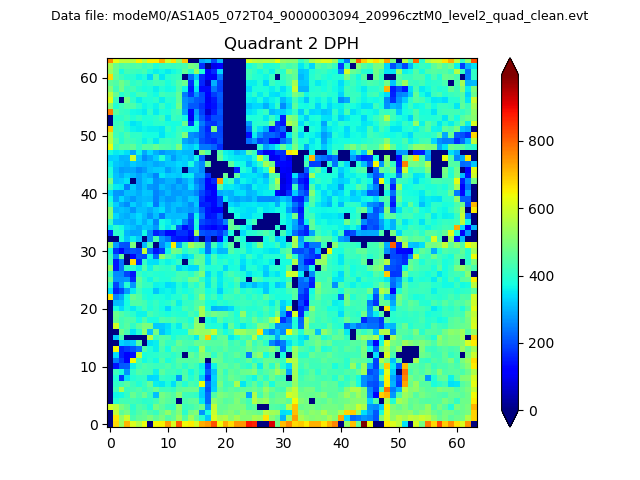
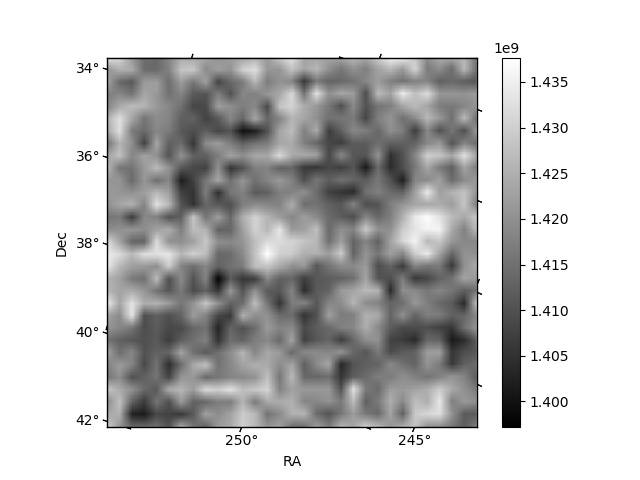
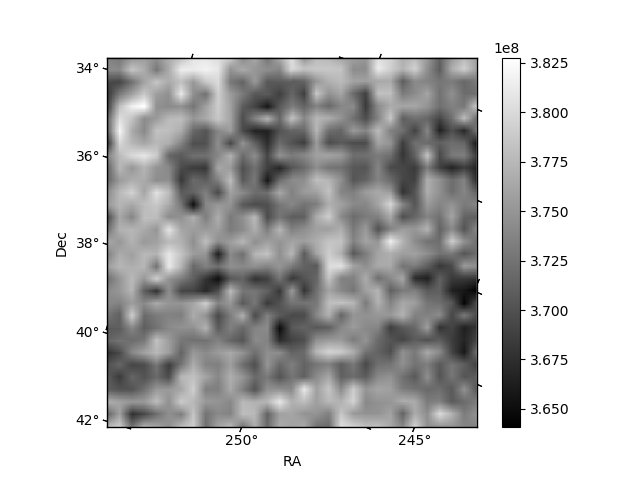
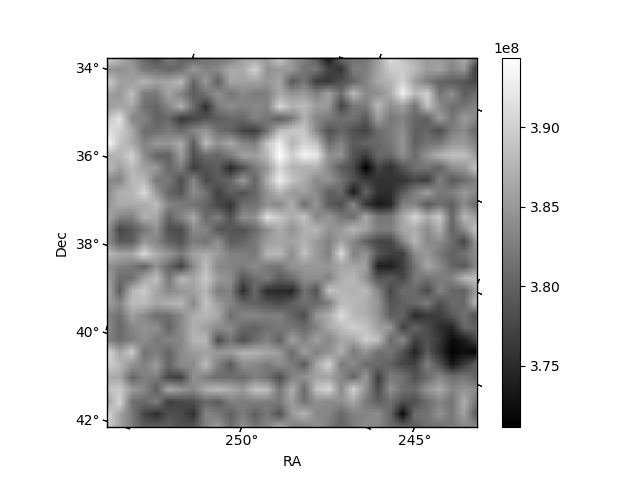
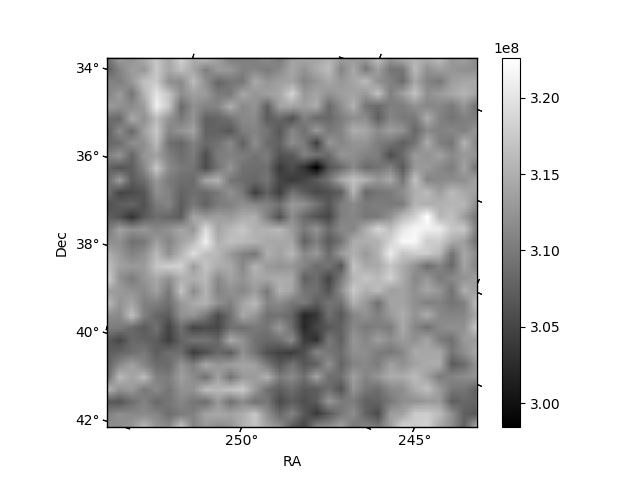
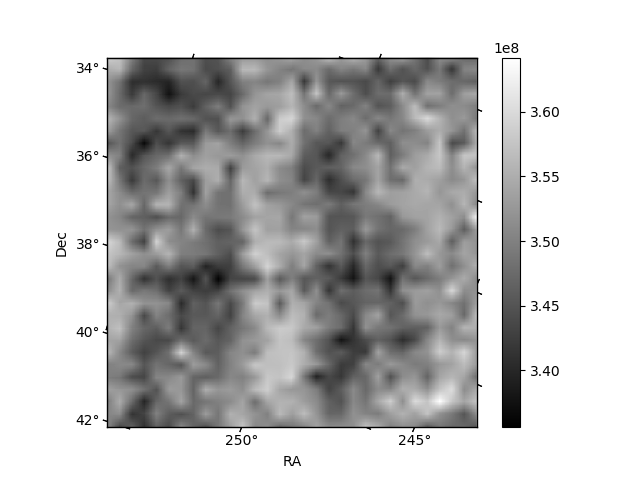
Histogram calculated using DETX and DETY for each event in the final _common_clean file
| Quadrant A | 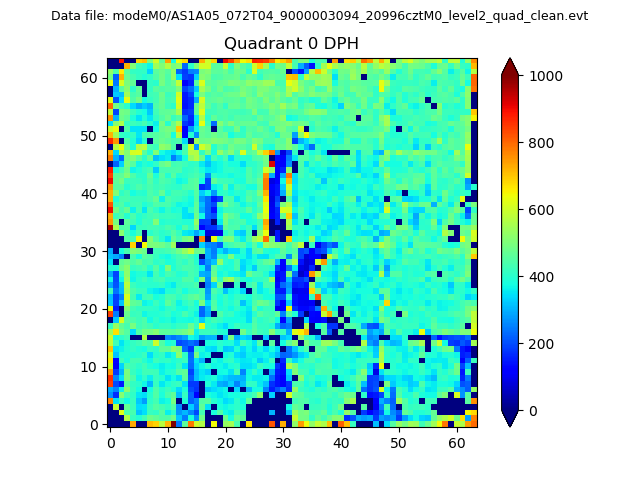 |
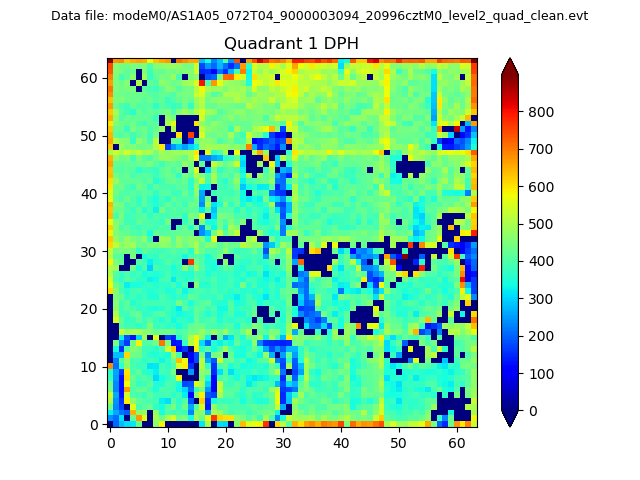 |
Quadrant B |
|---|---|---|---|
| Quadrant D | 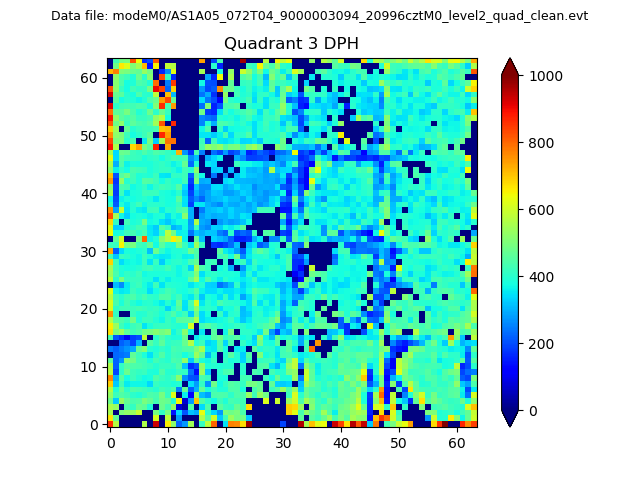 |
 |
Quadrant C |
| Plot type | Count rate plots | Images |
|---|---|---|
| Comparison with Poisson distribution Blue bars denote a histogram of data divided into 1 sec bins. Red curve is a Poisson curve with rate = median count rate of data. |
 |
 |
| Quadrant-wise count rates Data is divided into 100 sec bins |
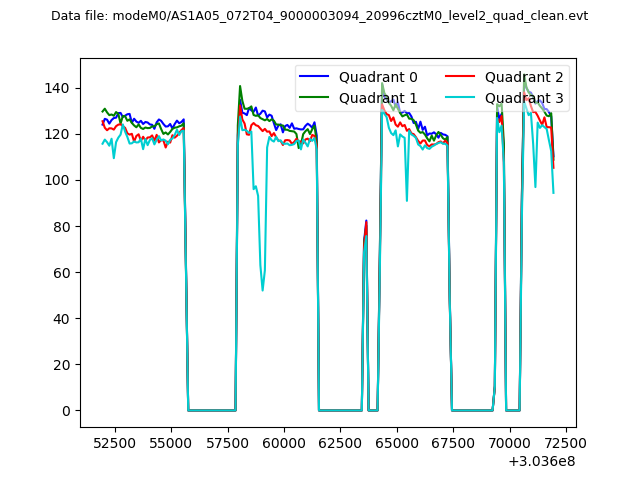 |
|
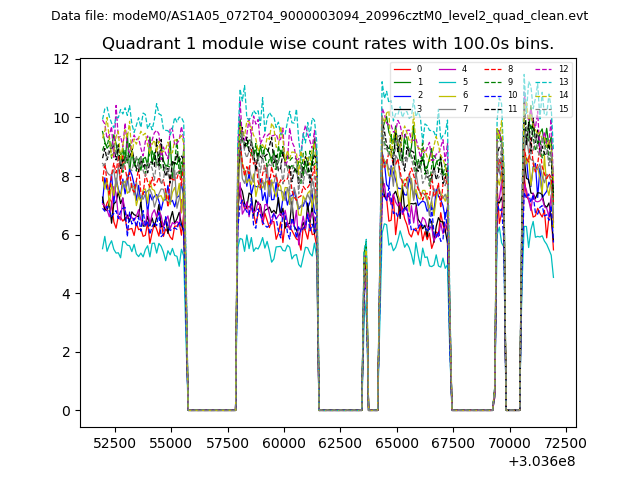
| Module-wise count rates for Quadrant A Data is divided into 100 sec bins |
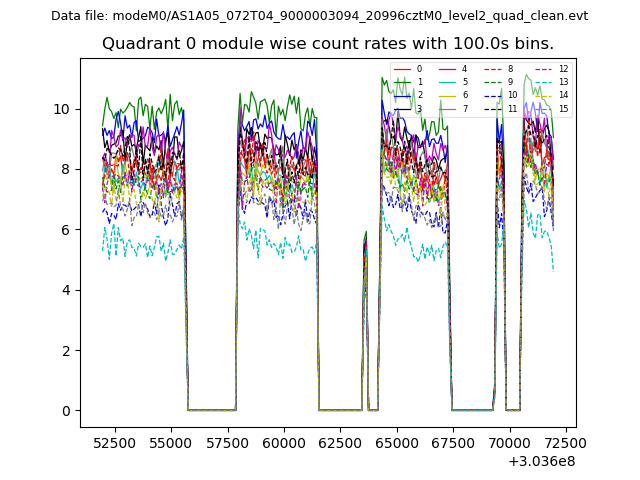 |
 |
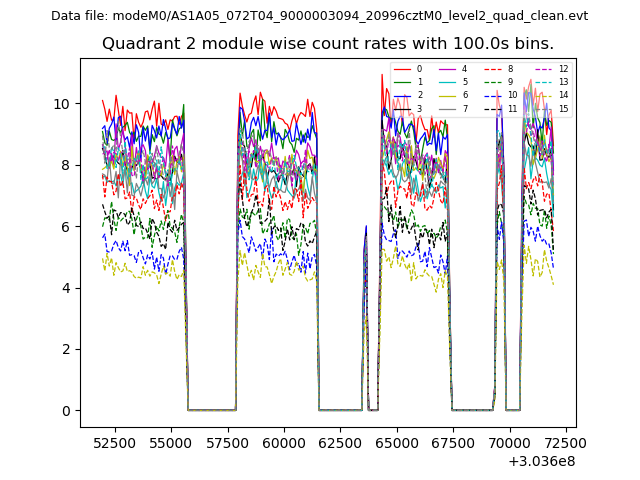
| Module-wise count rates for Quadrant B Data is divided into 100 sec bins |
 |
 |
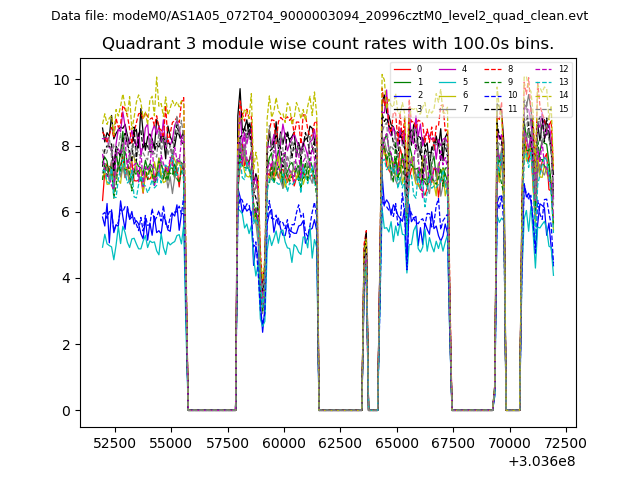
| Module-wise count rates for Quadrant C Data is divided into 100 sec bins |
 |
 |
| Module-wise count rates for Quadrant D Data is divided into 100 sec bins |
 |
 |
| Parameter | Plot |
|---|---|
| CZT HV Monitor | 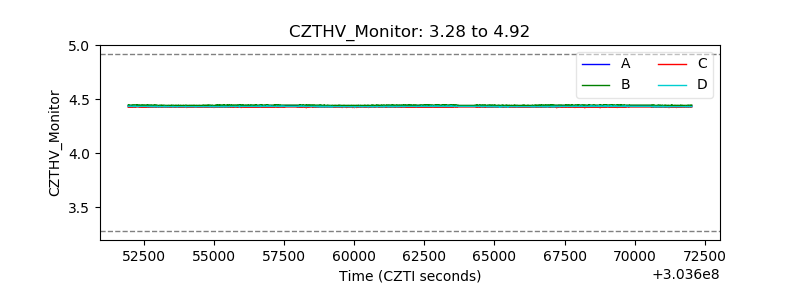 |
| D_VDD | 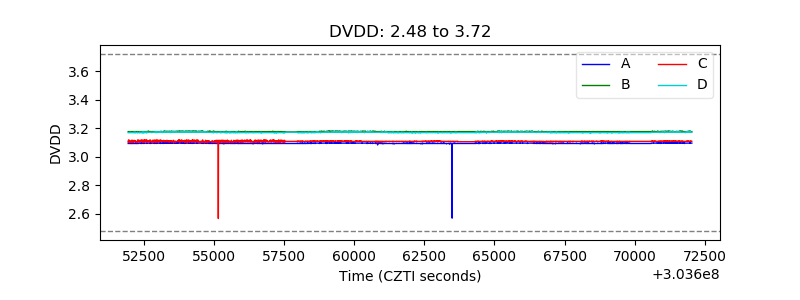 |
| Temperature 1 | 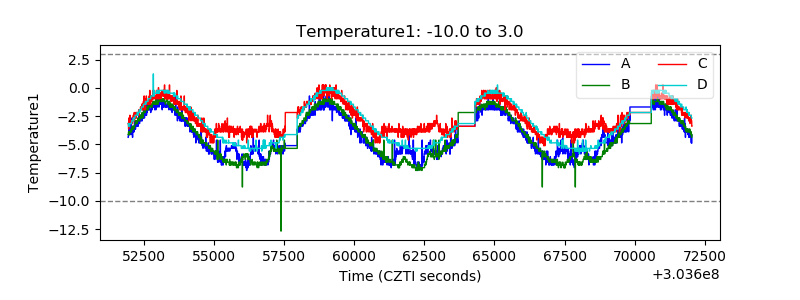 |
| Veto HV Monitor | 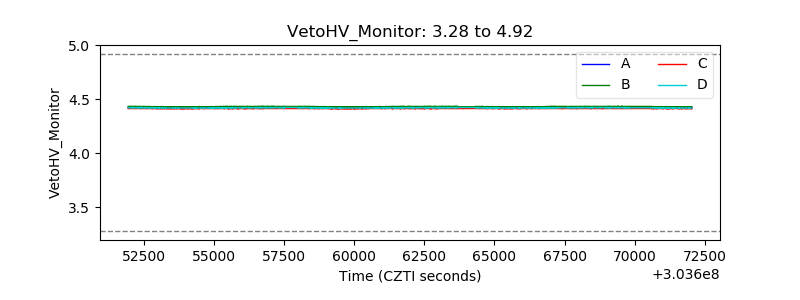 |
| Veto LLD | 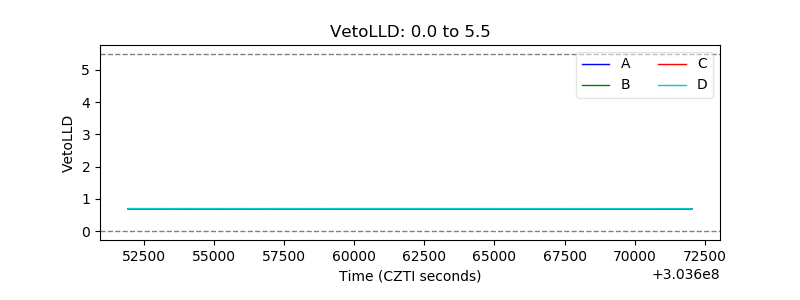 |
| Alpha Counter | 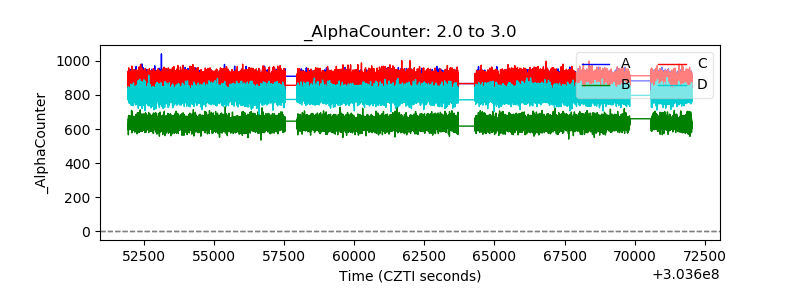 |
| _CPM_Rate | 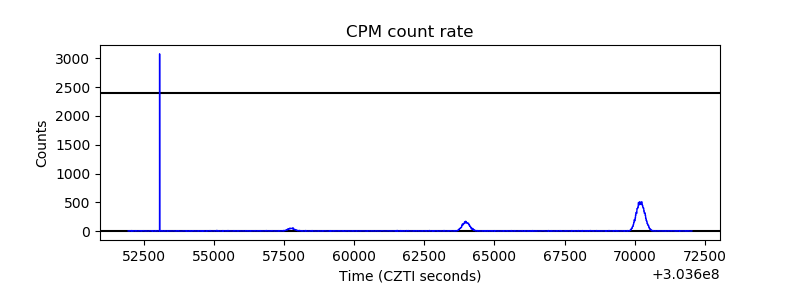 |
| CZT Counter | 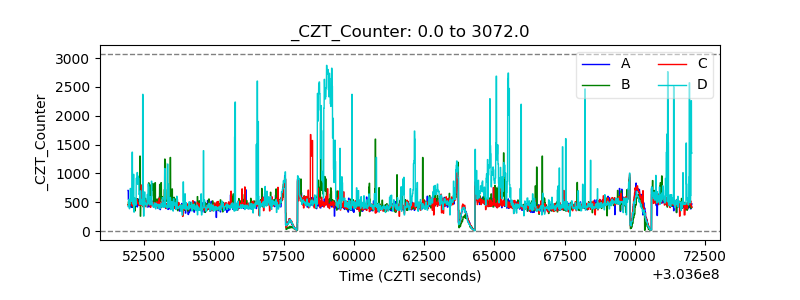 |
| +2.5 Volts monitor |  |
| +5 Volts monitor | 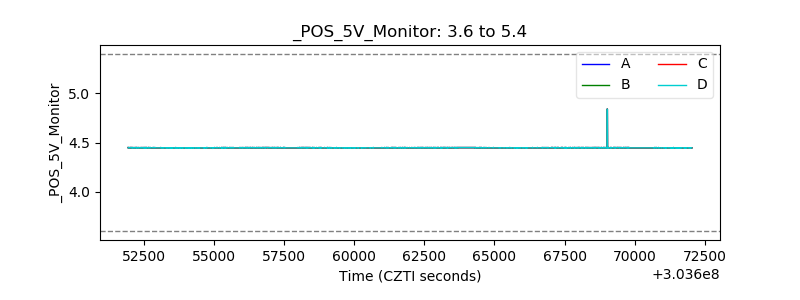 |
| _ROLL_ROT | 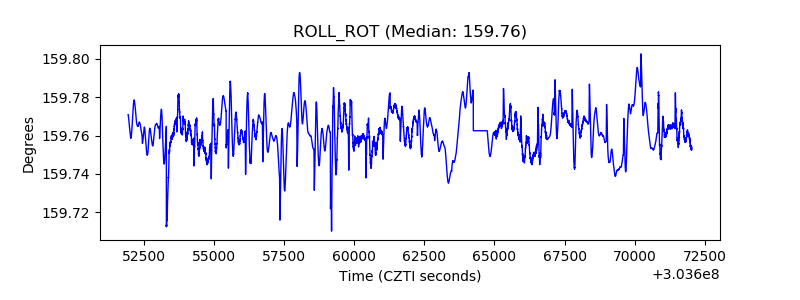 |
| _Roll_DEC | 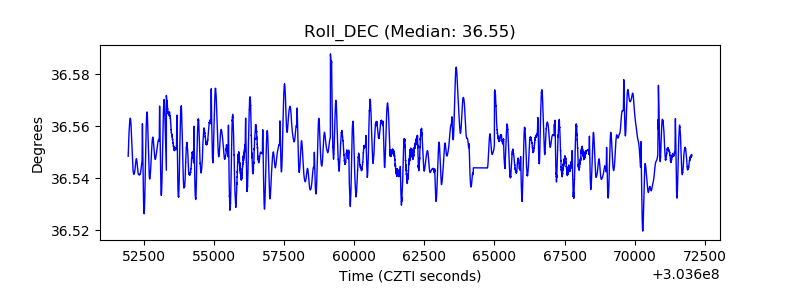 |
| _Roll_RA | 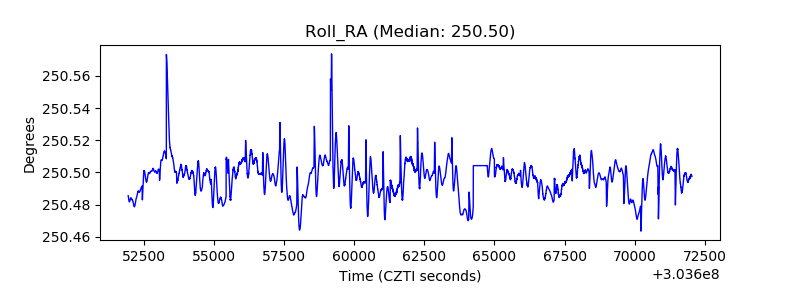 |
| Veto Counter | 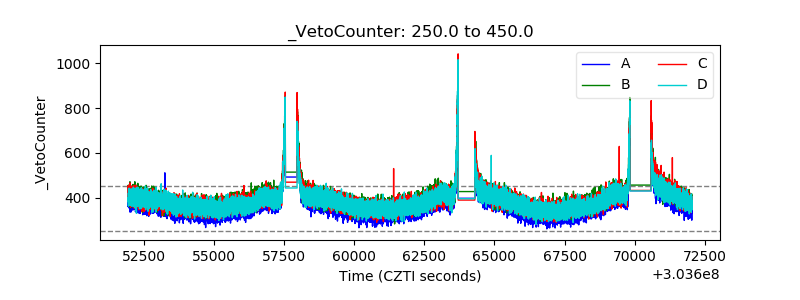 |