| Param | Original file | Final file |
|---|---|---|
| Filename | modeM0/AS1A05_072T04_9000003094_20997cztM0_level2.evt | modeM0/AS1A05_072T04_9000003094_20997cztM0_level2_quad_clean.evt |
| Size (bytes) | 458,988,480 | 94,988,160 |
| Size | 437.7 MB | 90.6 MB |
| Events in quadrant A | 3,103,765 | 621,162 |
| Events in quadrant B | 3,398,006 | 616,371 |
| Events in quadrant C | 3,242,163 | 595,627 |
| Events in quadrant D | 3,700,558 | 575,724 |
| Mode M9 | |||
|---|---|---|---|
| Quadrant | BADHDUFLAG | Total packets | Discarded packets |
| A | 0 | 14 | 0 |
| B | 0 | 15 | 0 |
| C | 0 | 15 | 0 |
| D | 0 | 15 | 0 |
| Mode SS | |||
|---|---|---|---|
| Quadrant | BADHDUFLAG | Total packets | Discarded packets |
| A | 0 | 136 | 0 |
| B | 0 | 136 | 0 |
| C | 0 | 136 | 0 |
| D | 0 | 136 | 0 |
| Mode M0 | |||
|---|---|---|---|
| Quadrant | BADHDUFLAG | Total packets | Discarded packets |
| A | 0 | 13759 | 2 |
| B | 0 | 14524 | 2 |
| C | 0 | 13989 | 2 |
| D | 0 | 15535 | 3 |
| Quadrant | Total seconds | Saturated seconds | Saturation percentage |
|---|---|---|---|
| A | 6711 | 38 | 0.566235% |
| B | 6711 | 81 | 1.206974% |
| C | 6711 | 73 | 1.087766% |
| D | 6710 | 166 | 2.473920% |
Noise dominated data is calculated using 1-second bins in cleaned event files. If a bin has >2000 counts, and if more than 50% of those come from <1% of pixels, then it is considered to be noise-dominated and hence unusable.
| Quadrant | # 1 sec bins | Bins with >0 counts | Bins with >2000 counts | High rate bins dominated by noise | Noise dominated (total time) | Noise dominated (detector-on time) | Marked lightcurve |
|---|---|---|---|---|---|---|---|
| A | 7616 | 6712 | 0 | 0 | 0.00% | 0.00% | 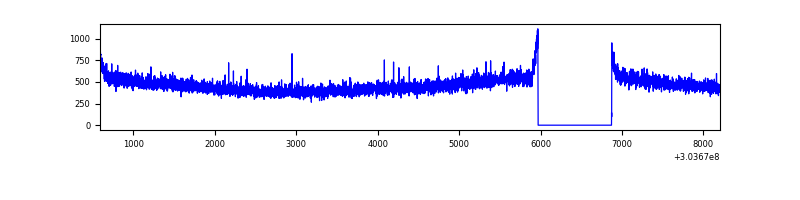 |
| B | 7616 | 6712 | 31 | 31 | 0.41% | 0.46% | 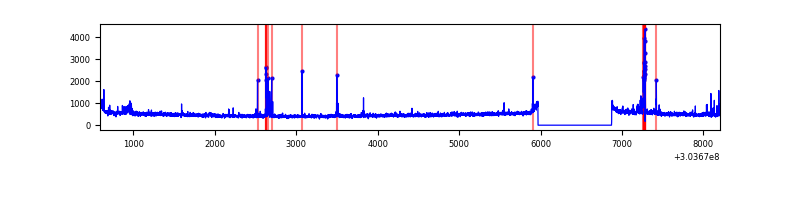 |
| C | 7616 | 6712 | 3 | 3 | 0.04% | 0.04% | 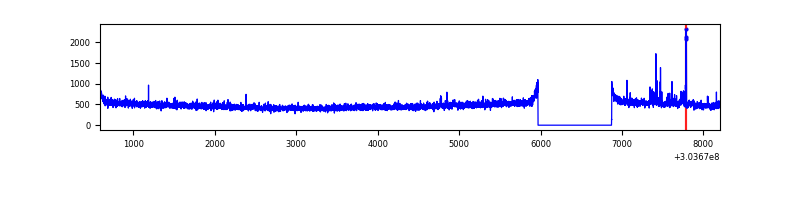 |
| D | 7615 | 6711 | 115 | 115 | 1.51% | 1.71% | 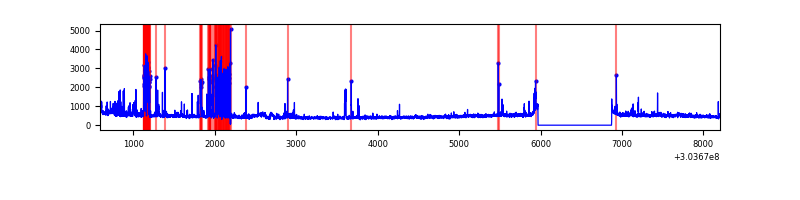 |
Top three noisy pixels from each quadrant. If the there are fewer than three noisy pixels in the level2.evt file, extra rows are filled as -1
| Pixel properties | Quadrant properties | ||||||
|---|---|---|---|---|---|---|---|
| Quadrant | DetID | PixID | Counts | Sigma | Mean | Median | Sigma |
| A | 0 | 226 | 7043 | 38.36 | 807 | 788 | 163.1 |
| A | 3 | 137 | 6454 | 34.74 | 807 | 788 | 163.1 |
| A | 12 | 194 | 5795 | 30.7 | 807 | 788 | 163.1 |
| B | 3 | 64 | 74092 | 479.99 | 802 | 780 | 152.7 |
| B | 7 | 220 | 55682 | 359.45 | 802 | 780 | 152.7 |
| B | 4 | 216 | 32502 | 207.69 | 802 | 780 | 152.7 |
| C | 14 | 238 | 121589 | 656.54 | 779 | 783 | 184.0 |
| C | 9 | 54 | 59630 | 319.81 | 779 | 783 | 184.0 |
| C | 3 | 233 | 11588 | 58.72 | 779 | 783 | 184.0 |
| D | 1 | 52 | 442575 | 2360.55 | 781 | 759 | 187.2 |
| D | 7 | 38 | 117154 | 621.88 | 781 | 759 | 187.2 |
| D | 2 | 234 | 31913 | 166.45 | 781 | 759 | 187.2 |
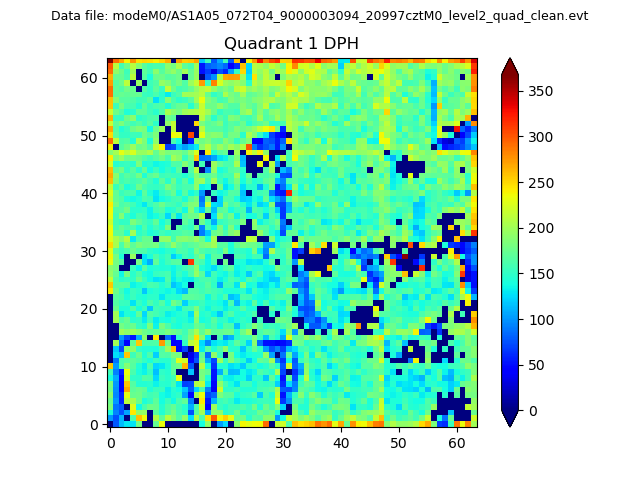
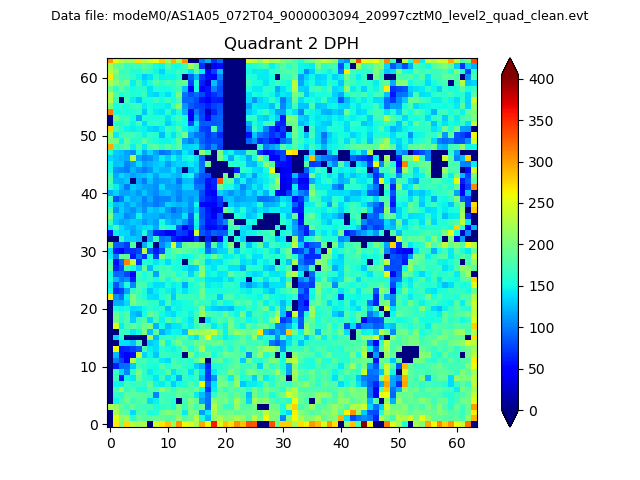
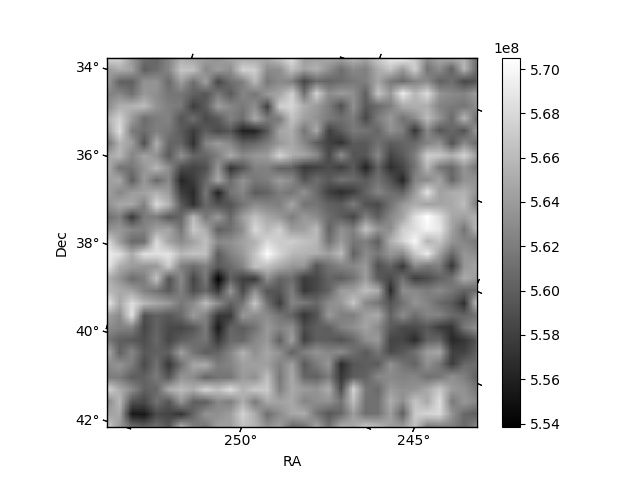
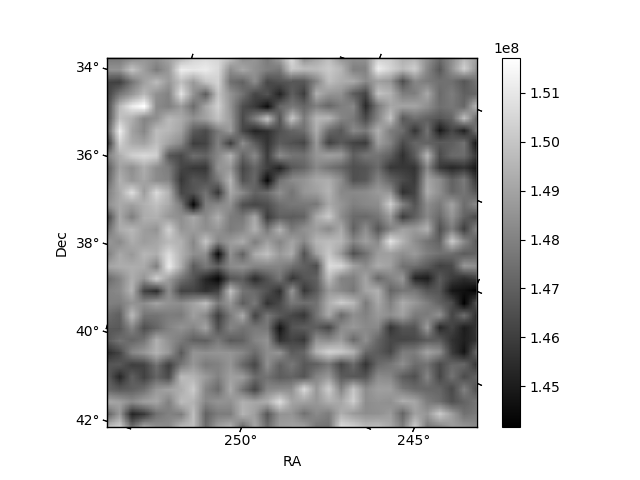
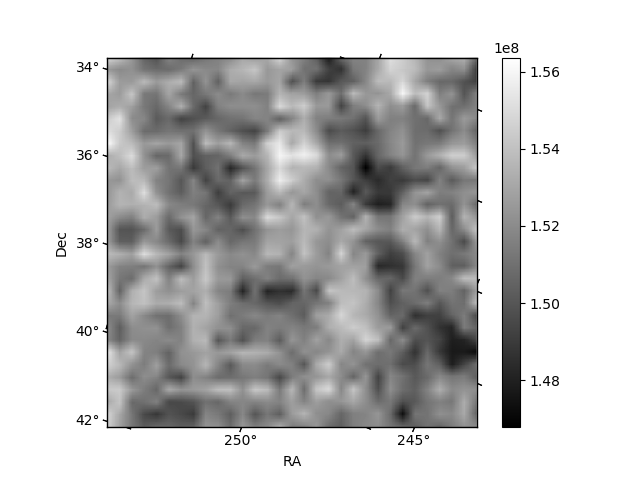
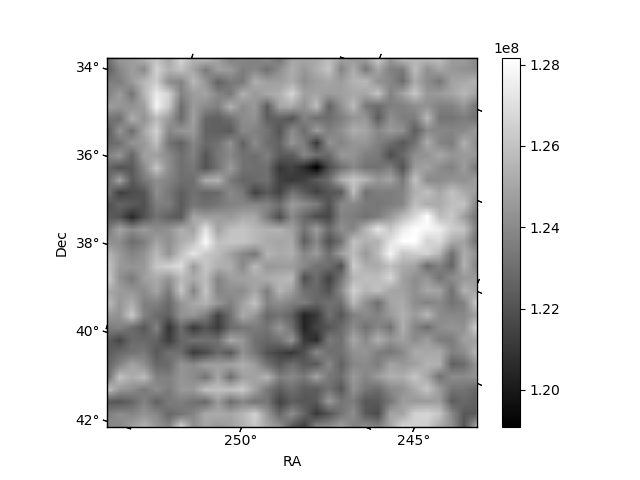
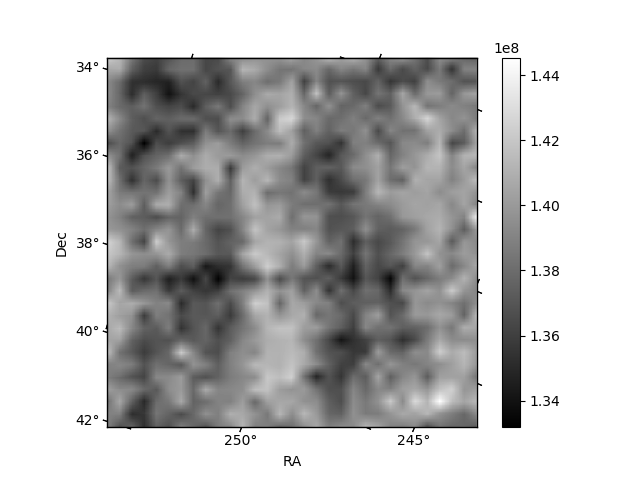
Histogram calculated using DETX and DETY for each event in the final _common_clean file
| Quadrant A |  |
 |
Quadrant B |
|---|---|---|---|
| Quadrant D | 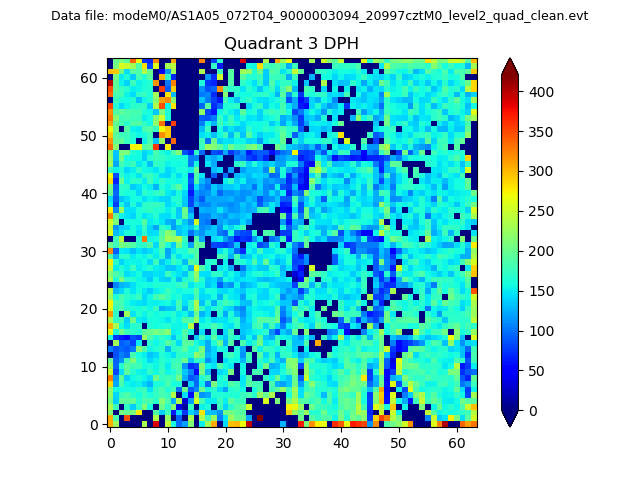 |
 |
Quadrant C |
| Plot type | Count rate plots | Images |
|---|---|---|
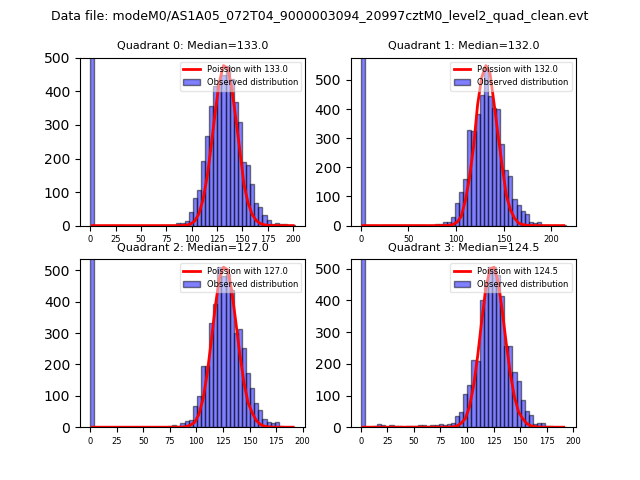
| Comparison with Poisson distribution Blue bars denote a histogram of data divided into 1 sec bins. Red curve is a Poisson curve with rate = median count rate of data. |
 |
 |
| Quadrant-wise count rates Data is divided into 100 sec bins |
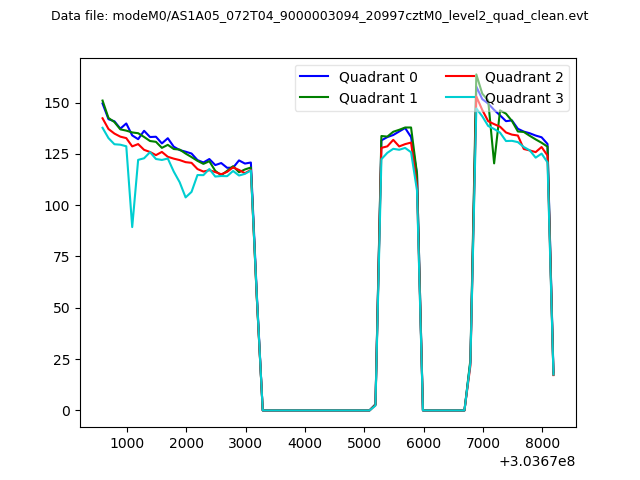 |
|
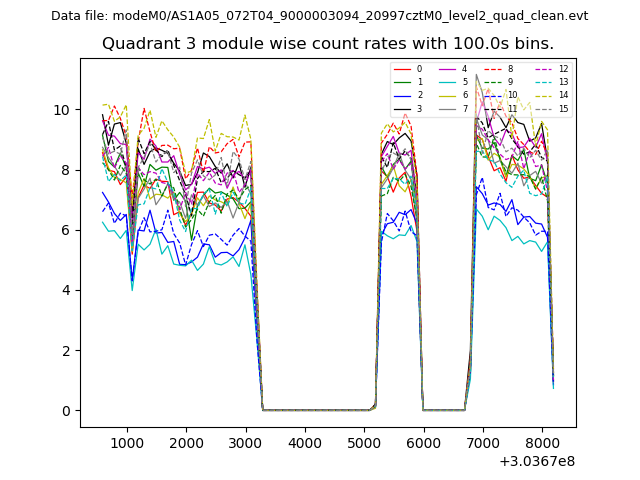
| Module-wise count rates for Quadrant A Data is divided into 100 sec bins |
 |
 |
| Module-wise count rates for Quadrant B Data is divided into 100 sec bins |
 |
 |
| Module-wise count rates for Quadrant C Data is divided into 100 sec bins |
 |
 |
| Module-wise count rates for Quadrant D Data is divided into 100 sec bins |
 |
 |
| Parameter | Plot |
|---|---|
| CZT HV Monitor | 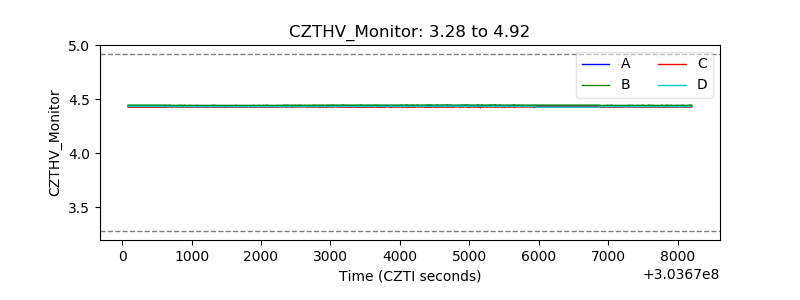 |
| D_VDD | 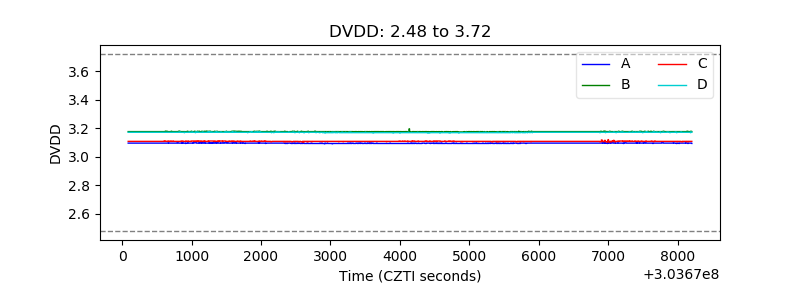 |
| Temperature 1 | 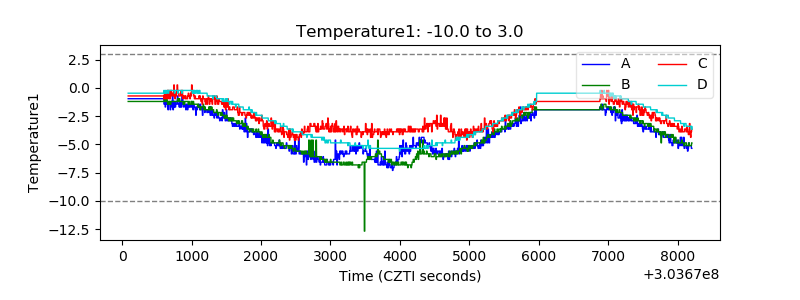 |
| Veto HV Monitor | 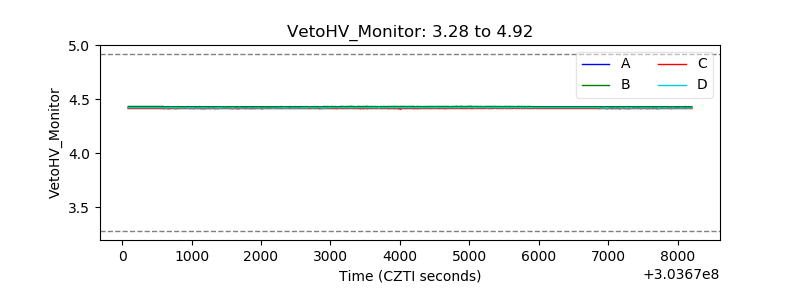 |
| Veto LLD | 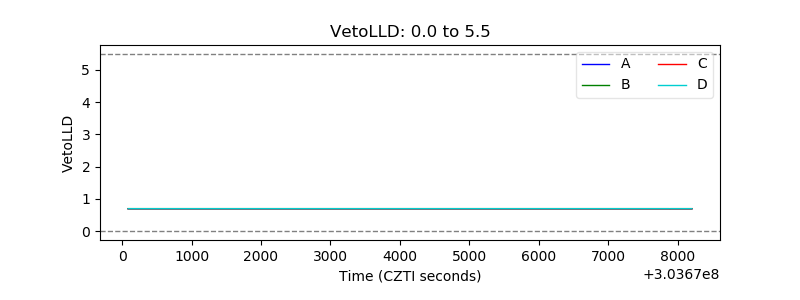 |
| Alpha Counter | 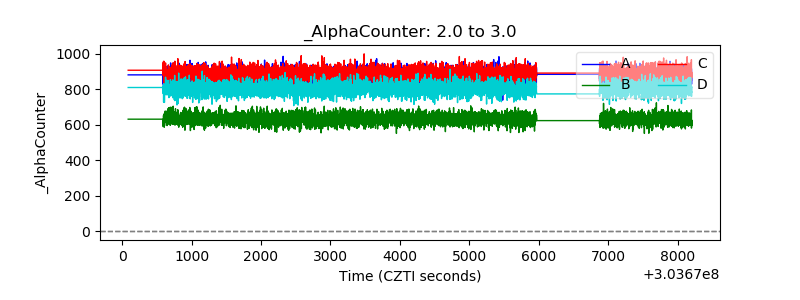 |
| _CPM_Rate | 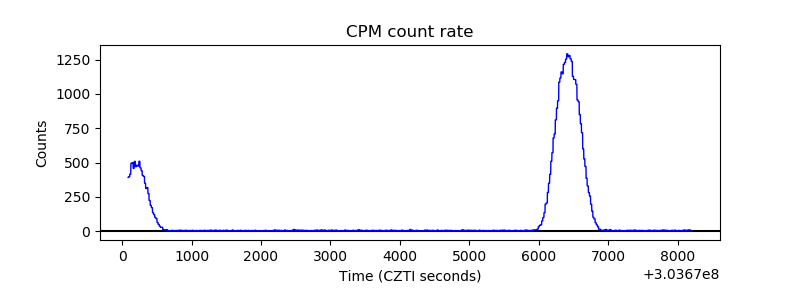 |
| CZT Counter | 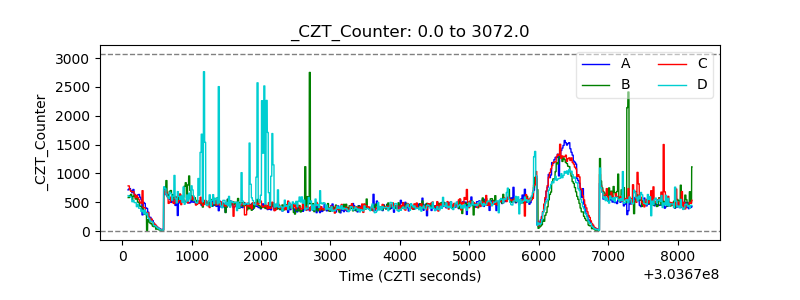 |
| +2.5 Volts monitor |  |
| +5 Volts monitor | 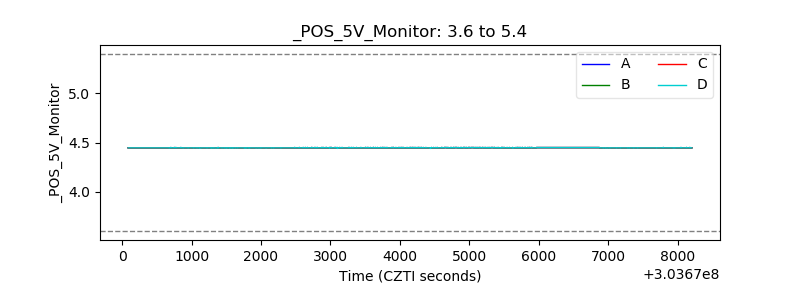 |
| _ROLL_ROT | 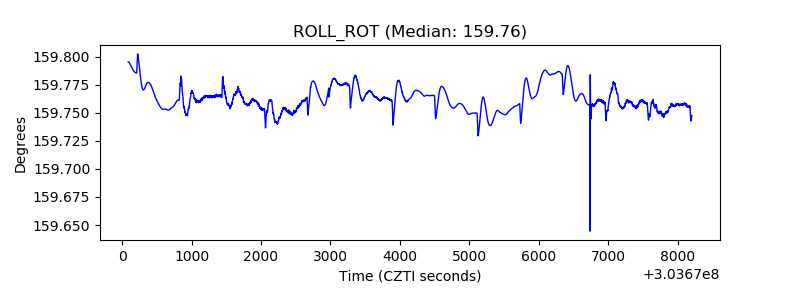 |
| _Roll_DEC | 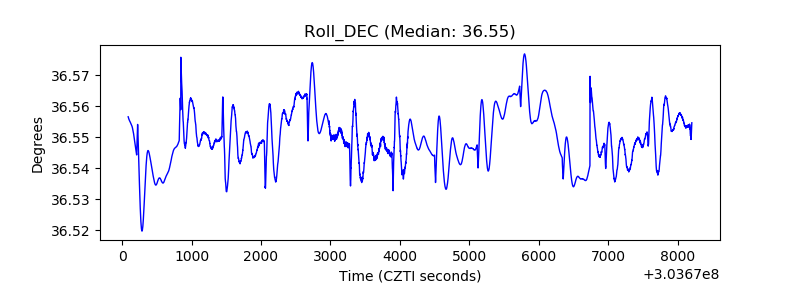 |
| _Roll_RA | 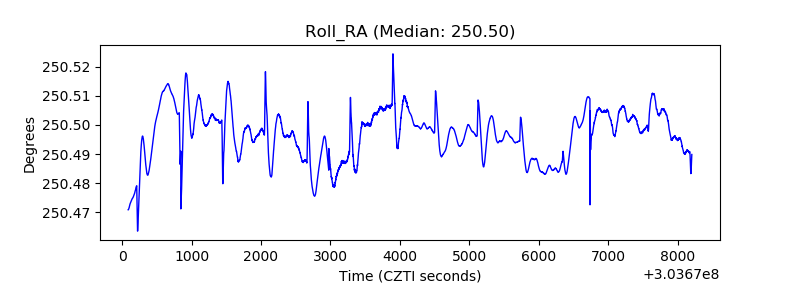 |
| Veto Counter | 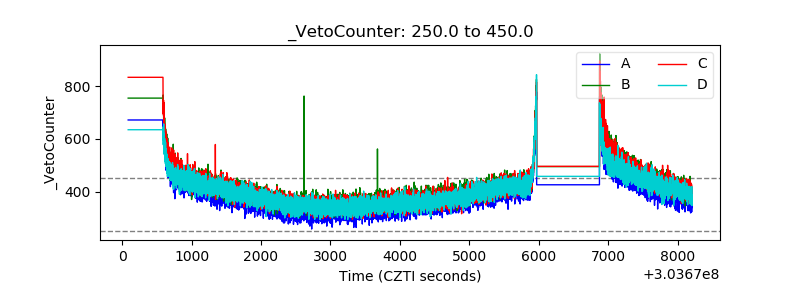 |