| Param | Original file | Final file |
|---|---|---|
| Filename | modeM0/AS1A05_072T04_9000003094_20998cztM0_level2.evt | modeM0/AS1A05_072T04_9000003094_20998cztM0_level2_quad_clean.evt |
| Size (bytes) | 437,469,120 | 95,929,920 |
| Size | 417.2 MB | 91.5 MB |
| Events in quadrant A | 3,060,157 | 626,162 |
| Events in quadrant B | 3,398,582 | 628,762 |
| Events in quadrant C | 3,217,492 | 602,328 |
| Events in quadrant D | 3,125,504 | 589,682 |
| Mode M9 | |||
|---|---|---|---|
| Quadrant | BADHDUFLAG | Total packets | Discarded packets |
| A | 0 | 10 | 0 |
| B | 0 | 10 | 0 |
| C | 0 | 10 | 0 |
| D | 0 | 10 | 0 |
| Mode SS | |||
|---|---|---|---|
| Quadrant | BADHDUFLAG | Total packets | Discarded packets |
| A | 0 | 136 | 0 |
| B | 0 | 136 | 0 |
| C | 0 | 136 | 0 |
| D | 0 | 136 | 0 |
| Mode M0 | |||
|---|---|---|---|
| Quadrant | BADHDUFLAG | Total packets | Discarded packets |
| A | 0 | 13463 | 3 |
| B | 0 | 14382 | 2 |
| C | 0 | 13803 | 2 |
| D | 0 | 13817 | 2 |
| Quadrant | Total seconds | Saturated seconds | Saturation percentage |
|---|---|---|---|
| A | 6563 | 21 | 0.319976% |
| B | 6564 | 87 | 1.325411% |
| C | 6564 | 58 | 0.883608% |
| D | 6564 | 31 | 0.472273% |
Noise dominated data is calculated using 1-second bins in cleaned event files. If a bin has >2000 counts, and if more than 50% of those come from <1% of pixels, then it is considered to be noise-dominated and hence unusable.
| Quadrant | # 1 sec bins | Bins with >0 counts | Bins with >2000 counts | High rate bins dominated by noise | Noise dominated (total time) | Noise dominated (detector-on time) | Marked lightcurve |
|---|---|---|---|---|---|---|---|
| A | 7613 | 6564 | 0 | 0 | 0.00% | 0.00% | 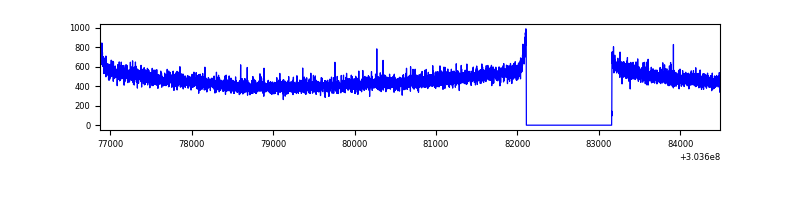 |
| B | 7614 | 6565 | 25 | 25 | 0.33% | 0.38% | 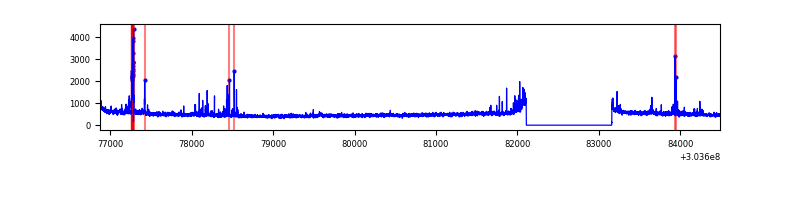 |
| C | 7614 | 6565 | 3 | 3 | 0.04% | 0.05% | 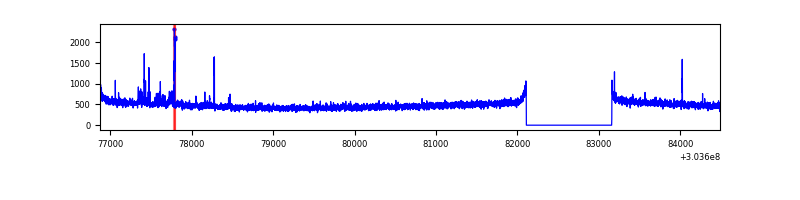 |
| D | 7614 | 6565 | 10 | 10 | 0.13% | 0.15% | 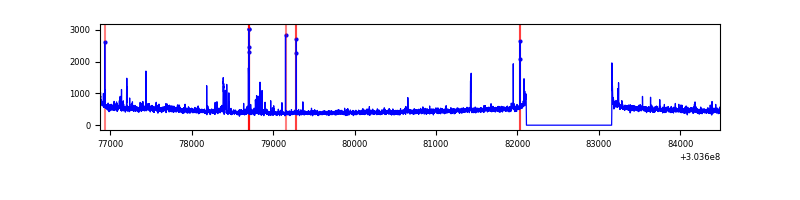 |
Top three noisy pixels from each quadrant. If the there are fewer than three noisy pixels in the level2.evt file, extra rows are filled as -1
| Pixel properties | Quadrant properties | ||||||
|---|---|---|---|---|---|---|---|
| Quadrant | DetID | PixID | Counts | Sigma | Mean | Median | Sigma |
| A | 0 | 226 | 6975 | 38.64 | 796 | 778 | 160.4 |
| A | 3 | 137 | 6341 | 34.69 | 796 | 778 | 160.4 |
| A | 12 | 194 | 5709 | 30.75 | 796 | 778 | 160.4 |
| B | 7 | 220 | 74301 | 487.91 | 794 | 772 | 150.7 |
| B | 3 | 64 | 72818 | 478.07 | 794 | 772 | 150.7 |
| B | 0 | 189 | 36769 | 238.86 | 794 | 772 | 150.7 |
| C | 14 | 238 | 120948 | 660.11 | 771 | 777 | 182.0 |
| C | 9 | 54 | 79266 | 431.14 | 771 | 777 | 182.0 |
| C | 13 | 61 | 5333 | 25.03 | 771 | 777 | 182.0 |
| D | 7 | 238 | 43538 | 227.08 | 776 | 754 | 188.4 |
| D | 12 | 235 | 30109 | 155.81 | 776 | 754 | 188.4 |
| D | 2 | 234 | 28720 | 148.44 | 776 | 754 | 188.4 |
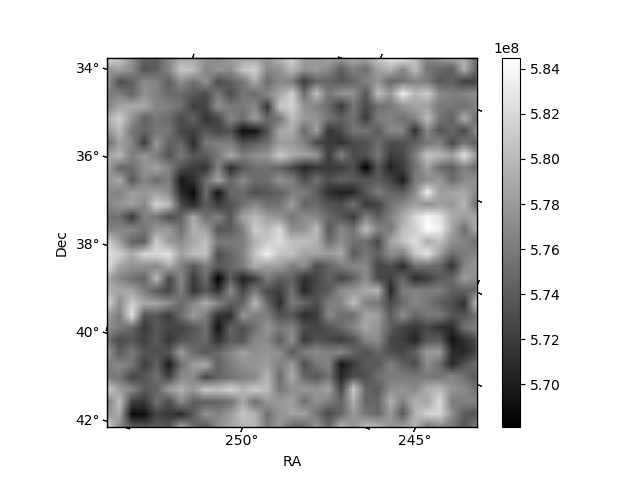
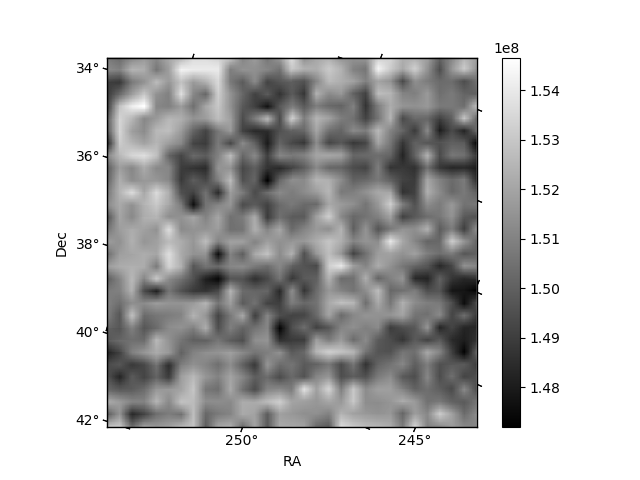
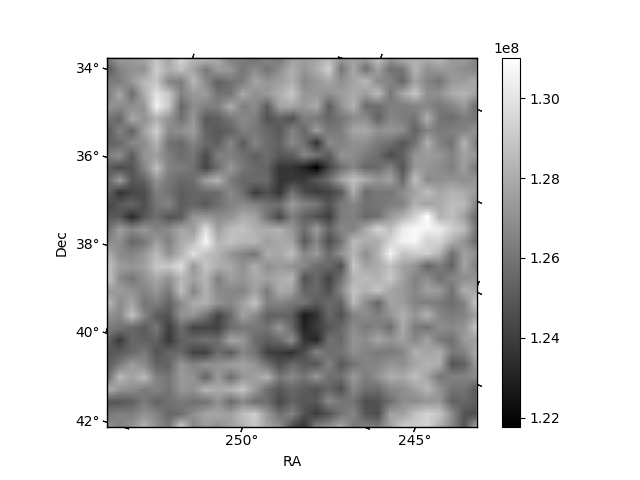
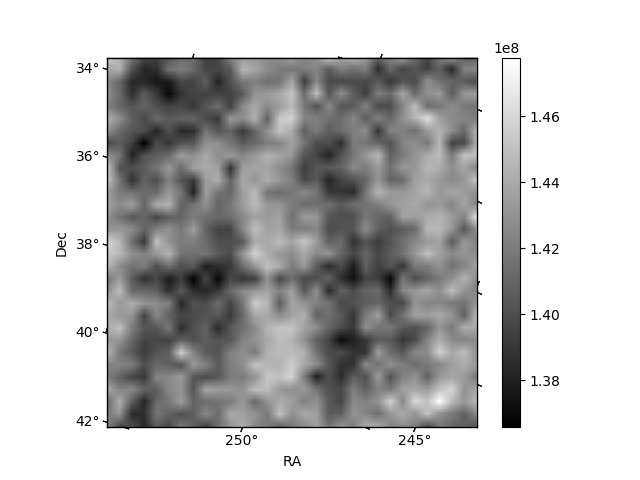
Histogram calculated using DETX and DETY for each event in the final _common_clean file
| Quadrant A | 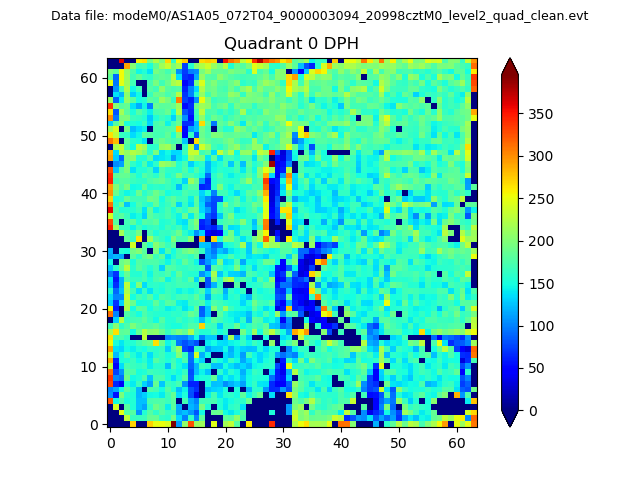 |
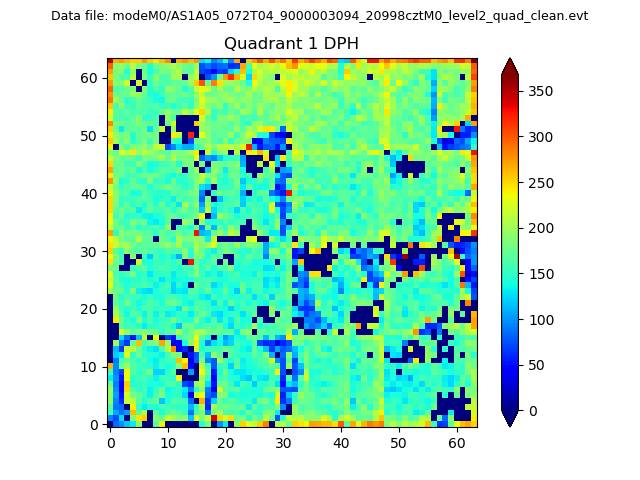 |
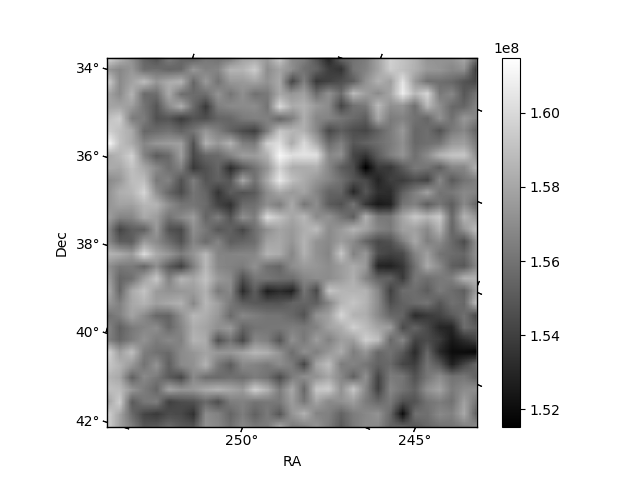
Quadrant B |
|---|---|---|---|
| Quadrant D | 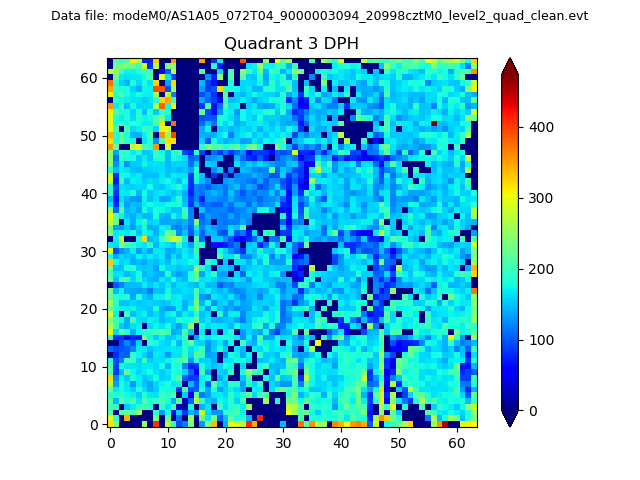 |
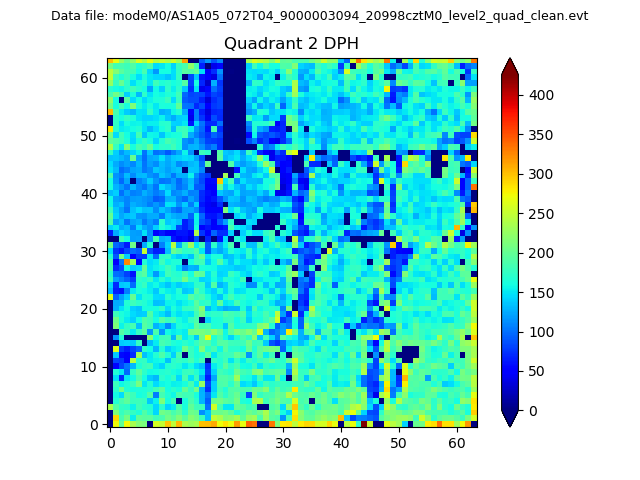 |
Quadrant C |
| Plot type | Count rate plots | Images |
|---|---|---|
| Comparison with Poisson distribution Blue bars denote a histogram of data divided into 1 sec bins. Red curve is a Poisson curve with rate = median count rate of data. |
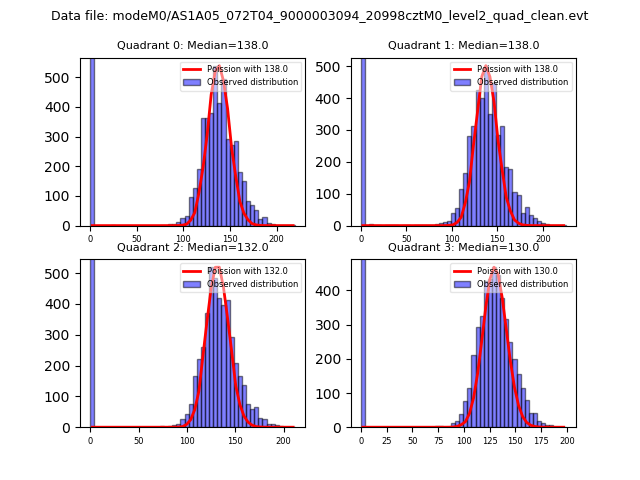 |
 |
| Quadrant-wise count rates Data is divided into 100 sec bins |
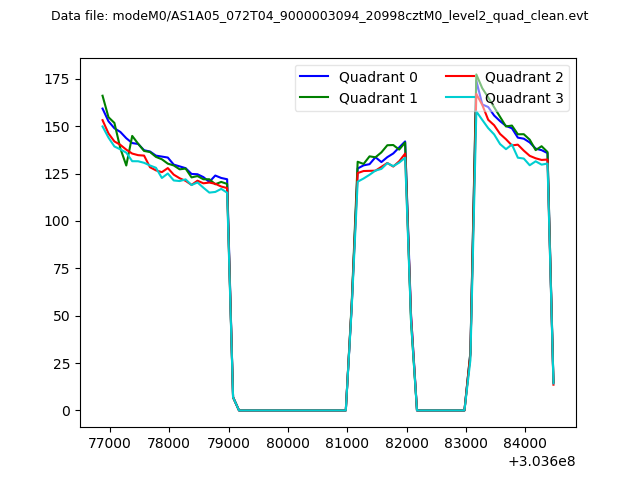 |
|
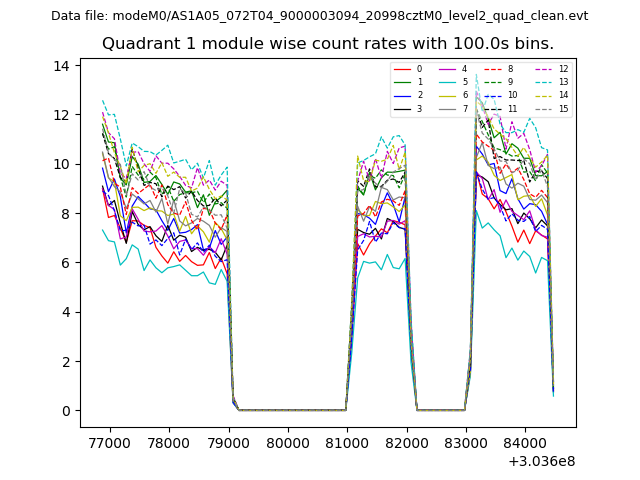
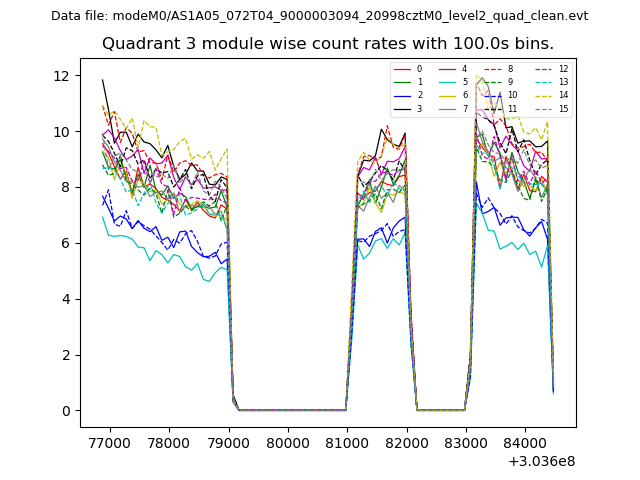
| Module-wise count rates for Quadrant A Data is divided into 100 sec bins |
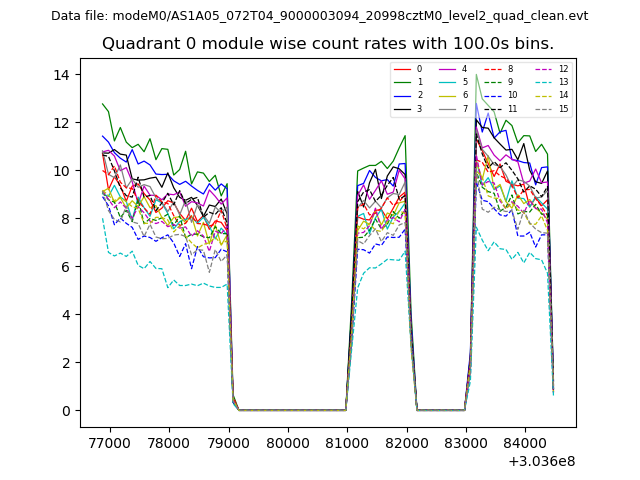 |
 |
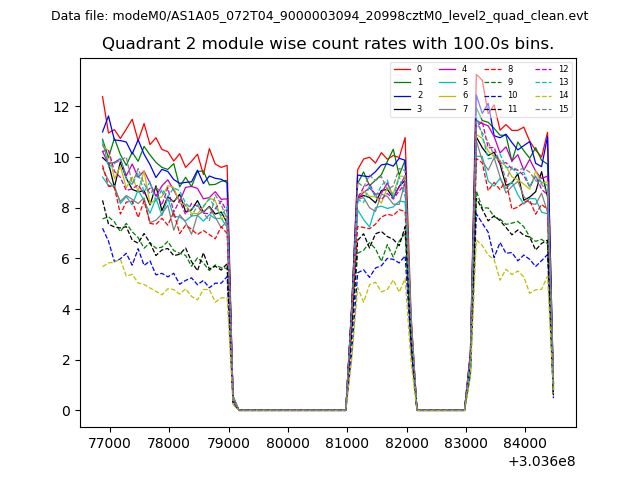
| Module-wise count rates for Quadrant B Data is divided into 100 sec bins |
 |
 |
| Module-wise count rates for Quadrant C Data is divided into 100 sec bins |
 |
 |
| Module-wise count rates for Quadrant D Data is divided into 100 sec bins |
 |
 |
| Parameter | Plot |
|---|---|
| CZT HV Monitor | 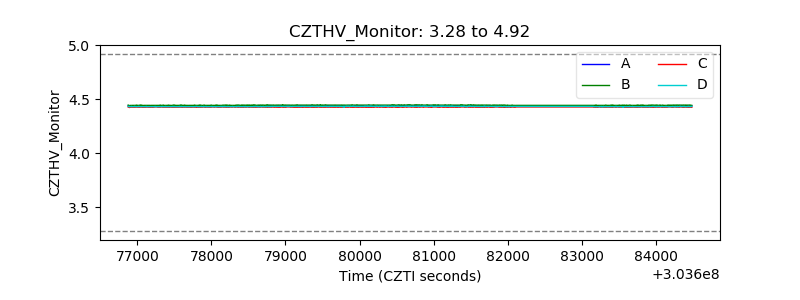 |
| D_VDD | 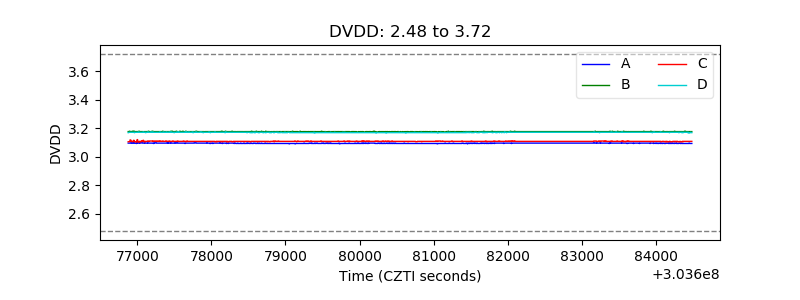 |
| Temperature 1 | 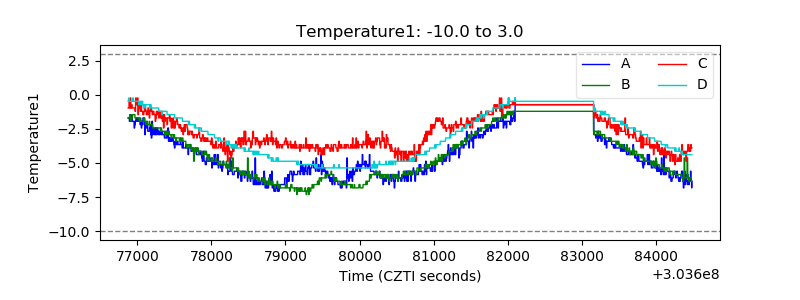 |
| Veto HV Monitor | 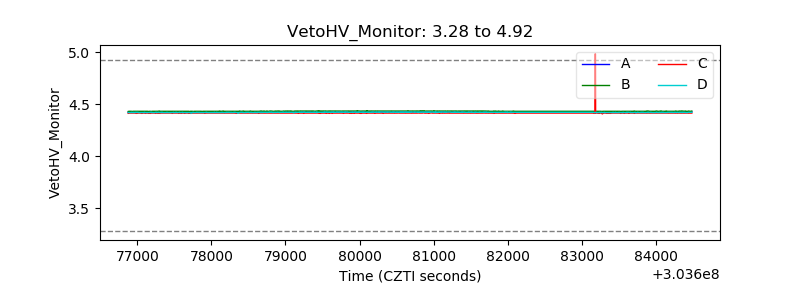 |
| Veto LLD | 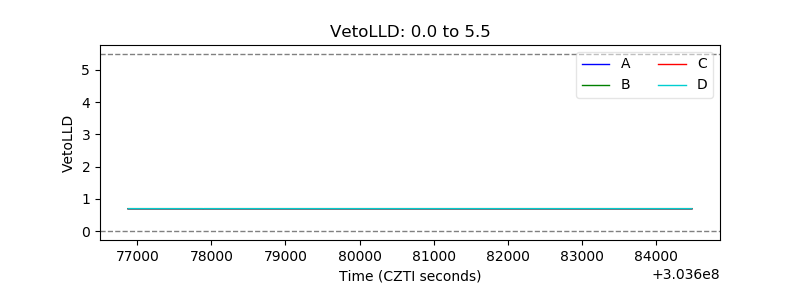 |
| Alpha Counter | 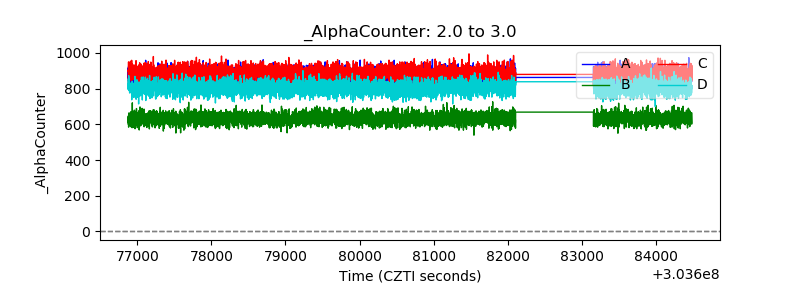 |
| _CPM_Rate | 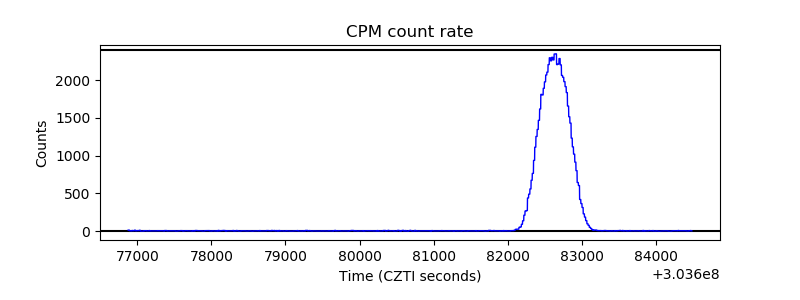 |
| CZT Counter | 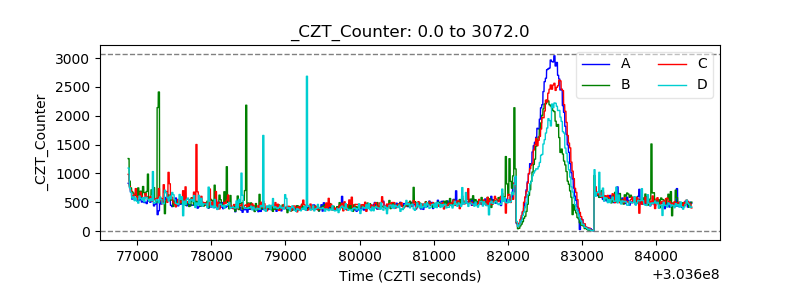 |
| +2.5 Volts monitor |  |
| +5 Volts monitor |  |
| _ROLL_ROT | 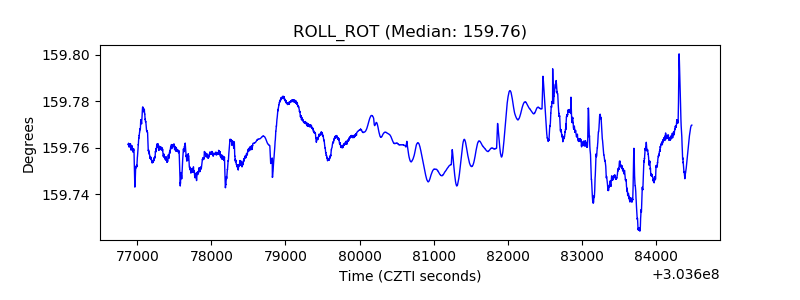 |
| _Roll_DEC | 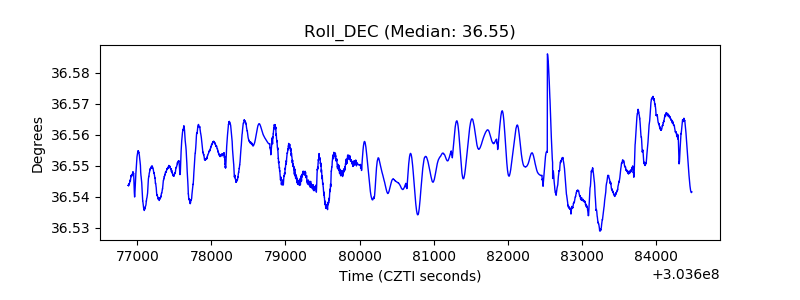 |
| _Roll_RA | 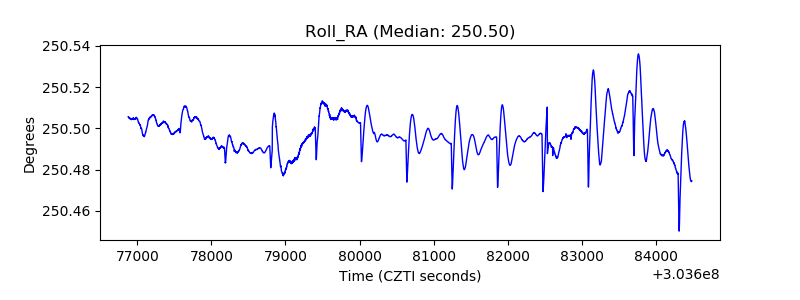 |
| Veto Counter | 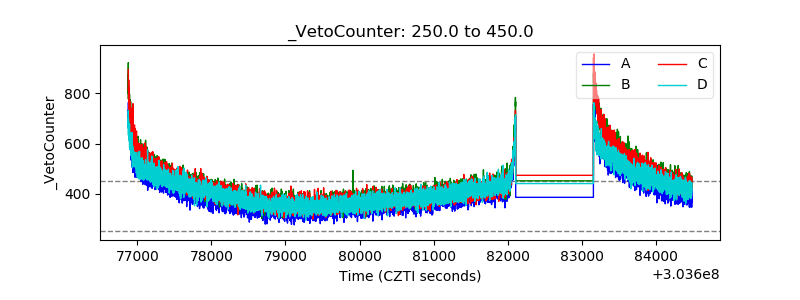 |