| Param | Original file | Final file |
|---|---|---|
| Filename | modeM0/AS1A05_072T04_9000003094_21001cztM0_level2.evt | modeM0/AS1A05_072T04_9000003094_21001cztM0_level2_quad_clean.evt |
| Size (bytes) | 428,587,200 | 90,766,080 |
| Size | 408.7 MB | 86.6 MB |
| Events in quadrant A | 3,070,992 | 589,340 |
| Events in quadrant B | 3,317,185 | 604,104 |
| Events in quadrant C | 3,135,838 | 568,201 |
| Events in quadrant D | 3,029,302 | 549,222 |
| Mode M9 | |||
|---|---|---|---|
| Quadrant | BADHDUFLAG | Total packets | Discarded packets |
| A | 0 | 22 | 0 |
| B | 0 | 23 | 0 |
| C | 0 | 23 | 0 |
| D | 0 | 23 | 0 |
| Mode SS | |||
|---|---|---|---|
| Quadrant | BADHDUFLAG | Total packets | Discarded packets |
| A | 0 | 128 | 0 |
| B | 0 | 128 | 0 |
| C | 0 | 128 | 0 |
| D | 0 | 128 | 0 |
| Mode M0 | |||
|---|---|---|---|
| Quadrant | BADHDUFLAG | Total packets | Discarded packets |
| A | 0 | 13018 | 2 |
| B | 0 | 13789 | 2 |
| C | 0 | 13144 | 2 |
| D | 0 | 13200 | 2 |
| Quadrant | Total seconds | Saturated seconds | Saturation percentage |
|---|---|---|---|
| A | 6271 | 9 | 0.143518% |
| B | 6271 | 36 | 0.574071% |
| C | 6271 | 44 | 0.701642% |
| D | 6271 | 14 | 0.223250% |
Noise dominated data is calculated using 1-second bins in cleaned event files. If a bin has >2000 counts, and if more than 50% of those come from <1% of pixels, then it is considered to be noise-dominated and hence unusable.
| Quadrant | # 1 sec bins | Bins with >0 counts | Bins with >2000 counts | High rate bins dominated by noise | Noise dominated (total time) | Noise dominated (detector-on time) | Marked lightcurve |
|---|---|---|---|---|---|---|---|
| A | 7566 | 6272 | 0 | 0 | 0.00% | 0.00% | 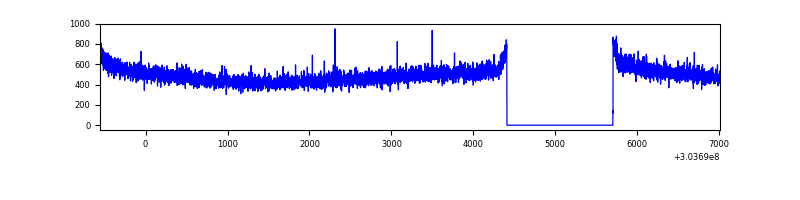 |
| B | 7566 | 6272 | 3 | 3 | 0.04% | 0.05% | 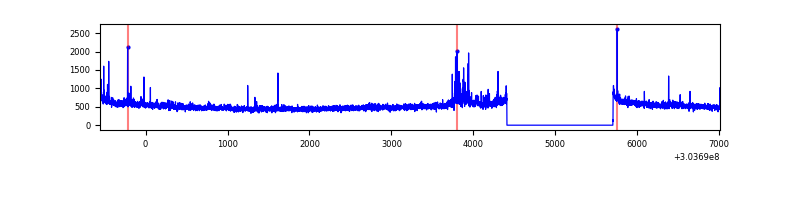 |
| C | 7566 | 6272 | 0 | 0 | 0.00% | 0.00% | 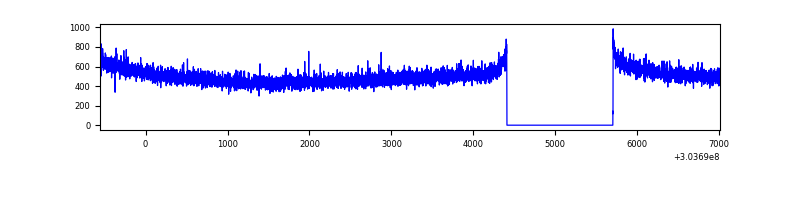 |
| D | 7566 | 6272 | 6 | 6 | 0.08% | 0.10% | 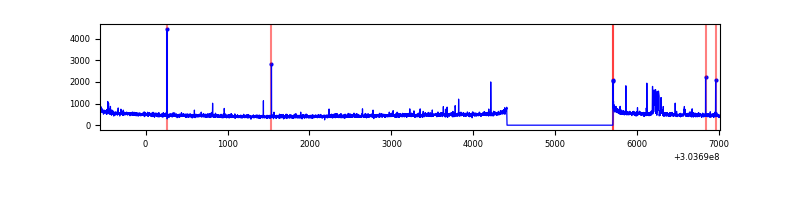 |
Top three noisy pixels from each quadrant. If the there are fewer than three noisy pixels in the level2.evt file, extra rows are filled as -1
| Pixel properties | Quadrant properties | ||||||
|---|---|---|---|---|---|---|---|
| Quadrant | DetID | PixID | Counts | Sigma | Mean | Median | Sigma |
| A | 0 | 226 | 6999 | 38.94 | 799 | 783 | 159.6 |
| A | 3 | 137 | 6127 | 33.48 | 799 | 783 | 159.6 |
| A | 12 | 194 | 5588 | 30.1 | 799 | 783 | 159.6 |
| B | 7 | 220 | 66854 | 437.49 | 806 | 787 | 151.0 |
| B | 0 | 189 | 31869 | 205.82 | 806 | 787 | 151.0 |
| B | 0 | 229 | 30956 | 199.78 | 806 | 787 | 151.0 |
| C | 14 | 238 | 121769 | 676.69 | 771 | 779 | 178.8 |
| C | 13 | 61 | 5377 | 25.72 | 771 | 779 | 178.8 |
| C | 3 | 233 | 3281 | 13.99 | 771 | 779 | 178.8 |
| D | 15 | 0 | 65025 | 346.5 | 770 | 750 | 185.5 |
| D | 2 | 234 | 27291 | 143.08 | 770 | 750 | 185.5 |
| D | 1 | 52 | 14639 | 74.88 | 770 | 750 | 185.5 |
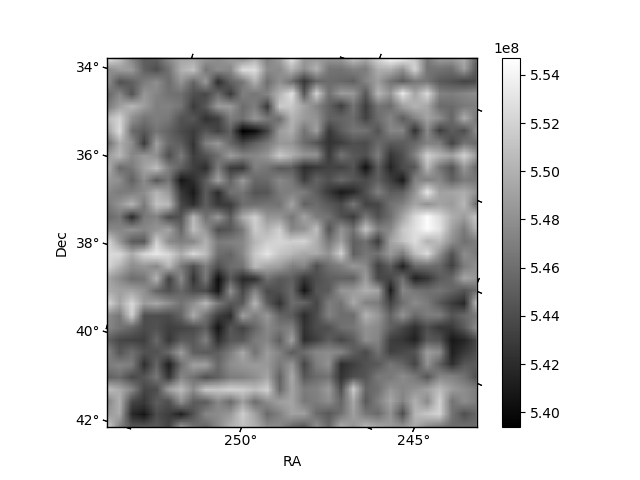
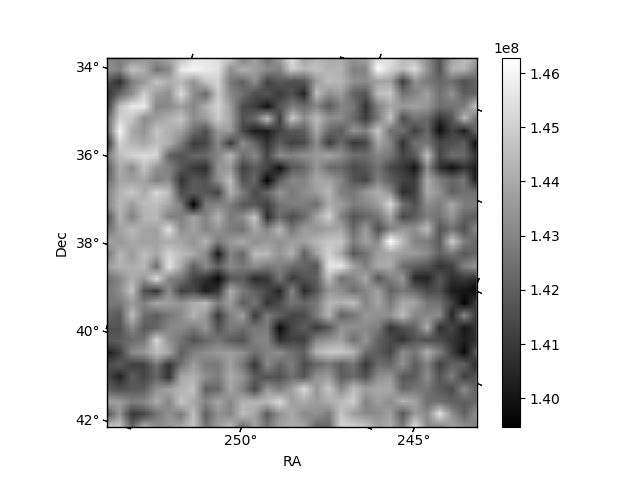
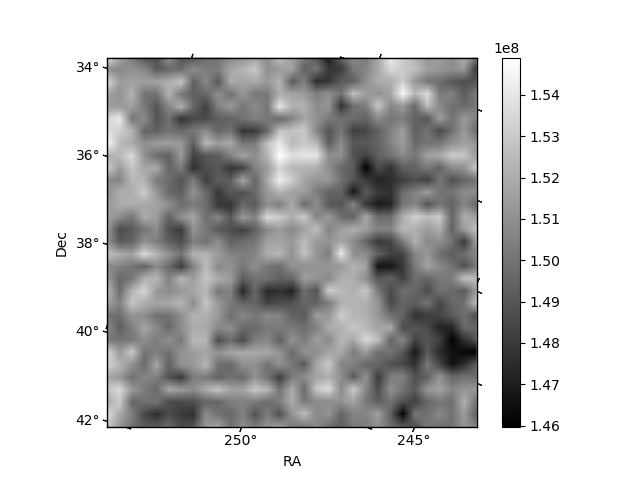
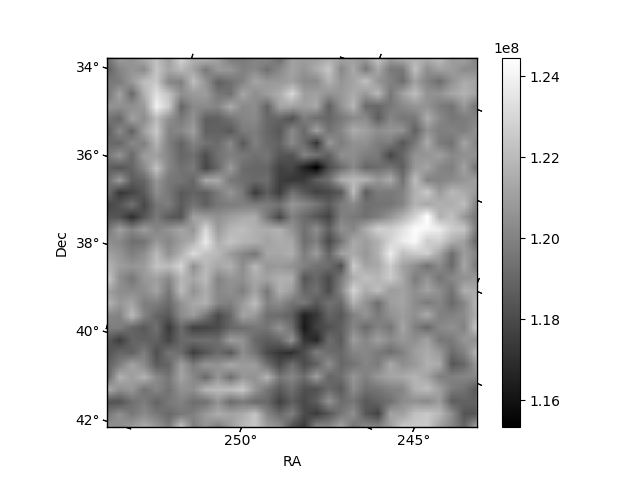
Histogram calculated using DETX and DETY for each event in the final _common_clean file
| Quadrant A | 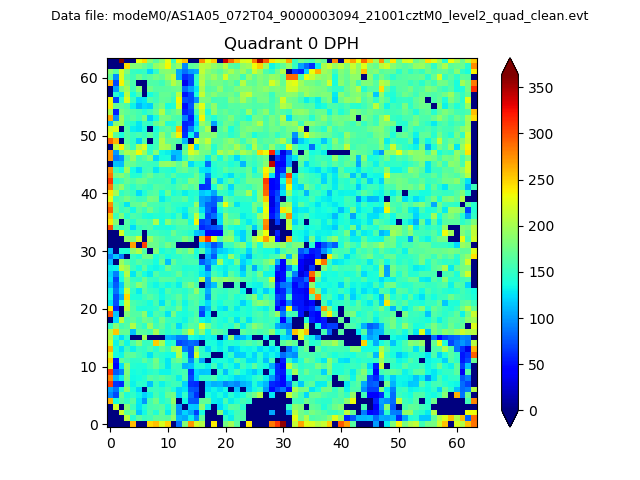 |
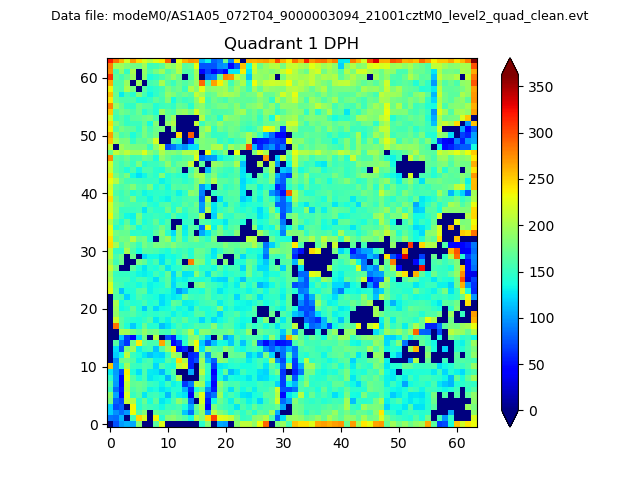 |
Quadrant B |
|---|---|---|---|
| Quadrant D |  |
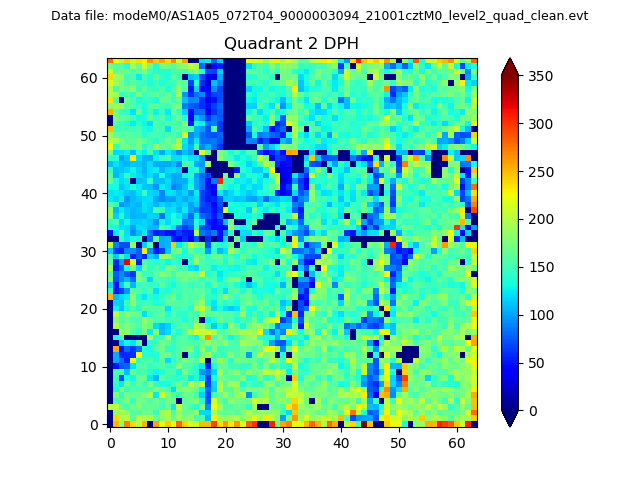 |
Quadrant C |
| Plot type | Count rate plots | Images |
|---|---|---|
| Comparison with Poisson distribution Blue bars denote a histogram of data divided into 1 sec bins. Red curve is a Poisson curve with rate = median count rate of data. |
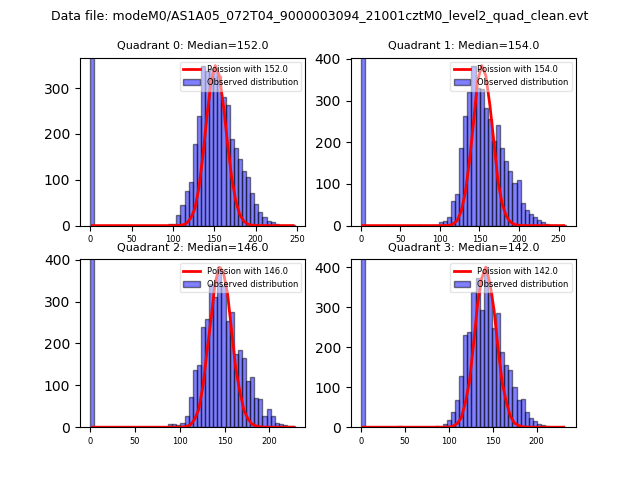 |
 |
| Quadrant-wise count rates Data is divided into 100 sec bins |
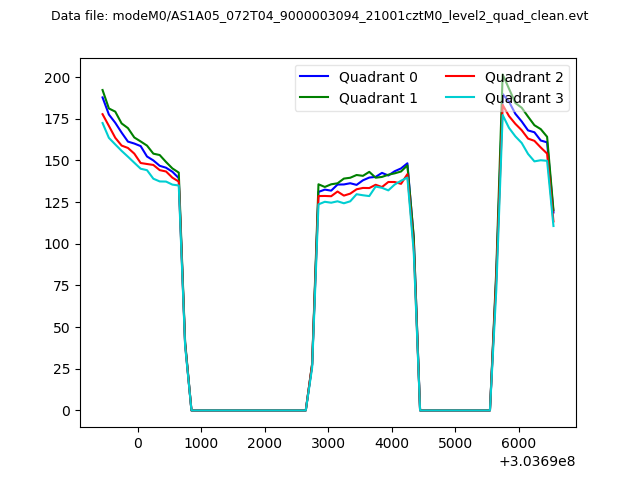 |
|
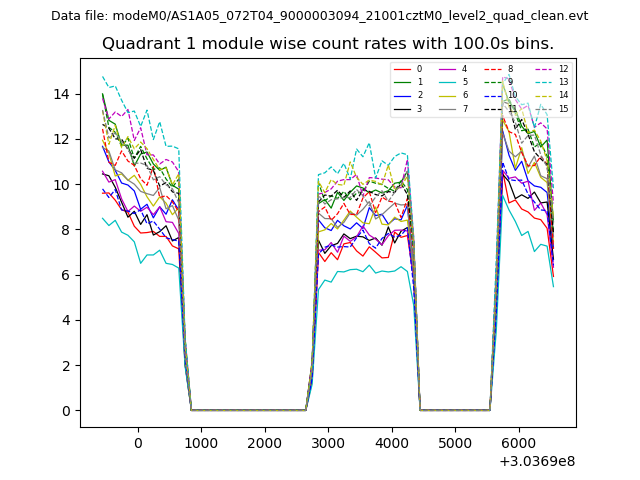
| Module-wise count rates for Quadrant A Data is divided into 100 sec bins |
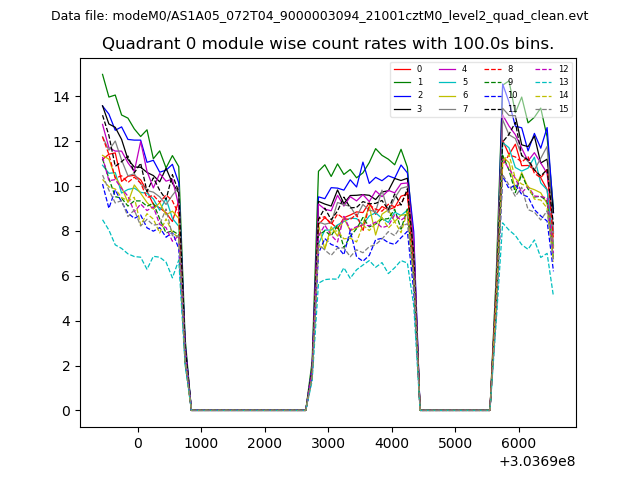 |
 |
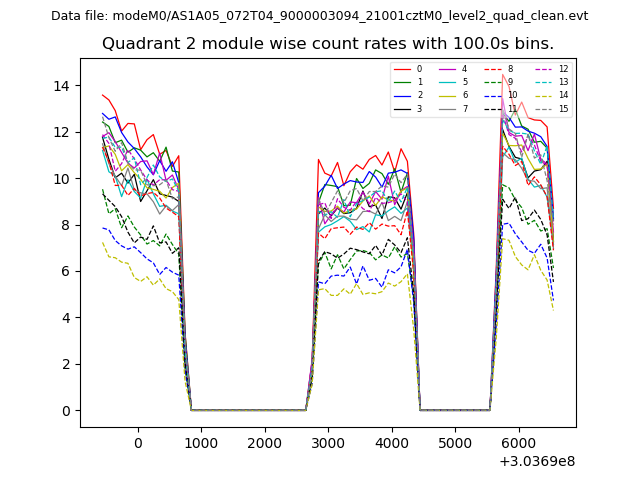
| Module-wise count rates for Quadrant B Data is divided into 100 sec bins |
 |
 |
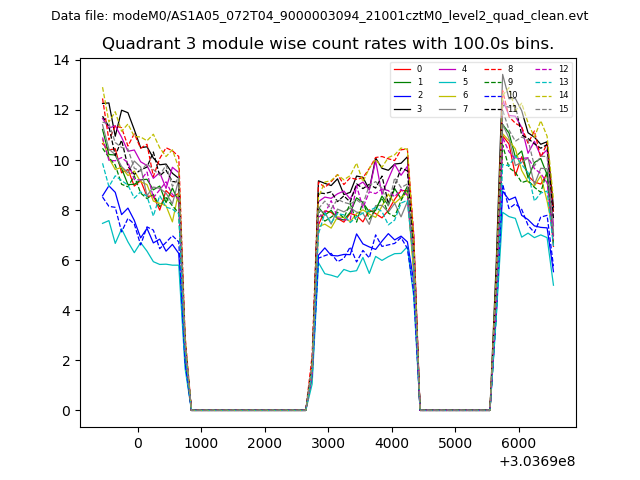
| Module-wise count rates for Quadrant C Data is divided into 100 sec bins |
 |
 |
| Module-wise count rates for Quadrant D Data is divided into 100 sec bins |
 |
 |
| Parameter | Plot |
|---|---|
| CZT HV Monitor | 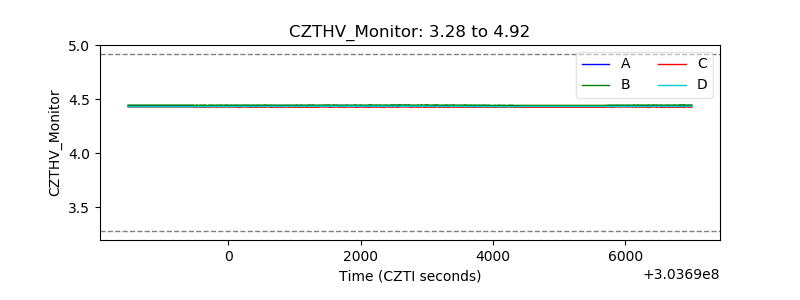 |
| D_VDD | 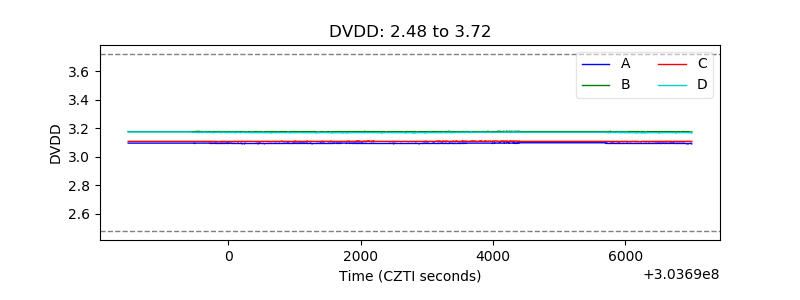 |
| Temperature 1 |  |
| Veto HV Monitor | 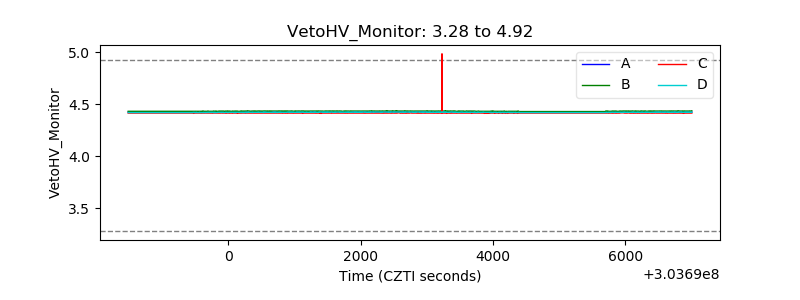 |
| Veto LLD | 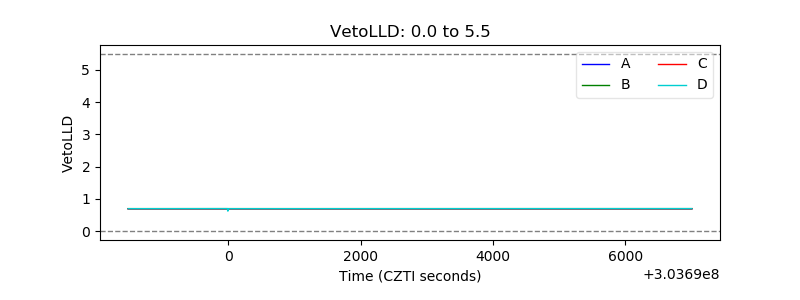 |
| Alpha Counter | 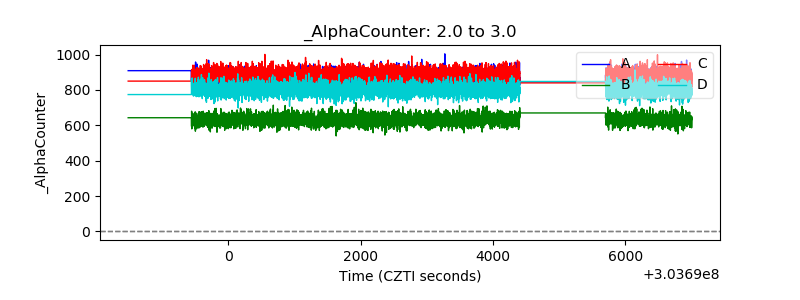 |
| _CPM_Rate | 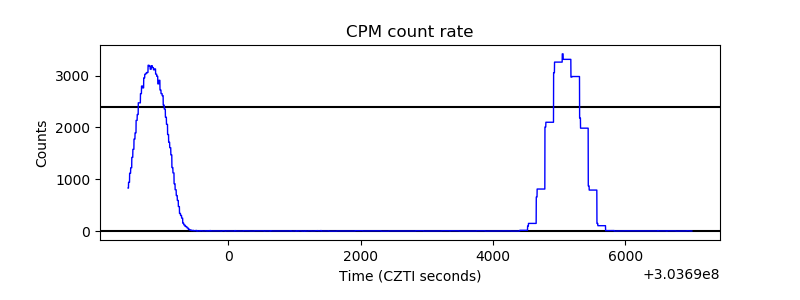 |
| CZT Counter | 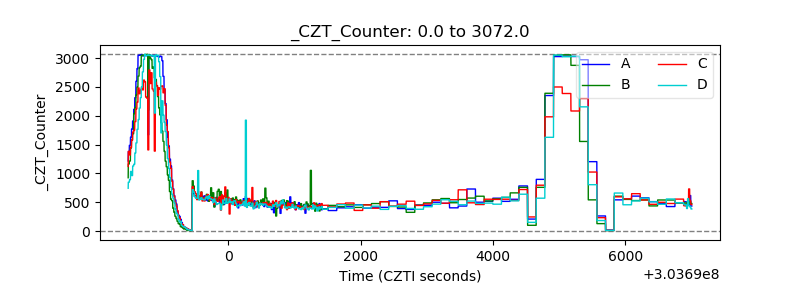 |
| +2.5 Volts monitor |  |
| +5 Volts monitor |  |
| _ROLL_ROT |  |
| _Roll_DEC |  |
| _Roll_RA | 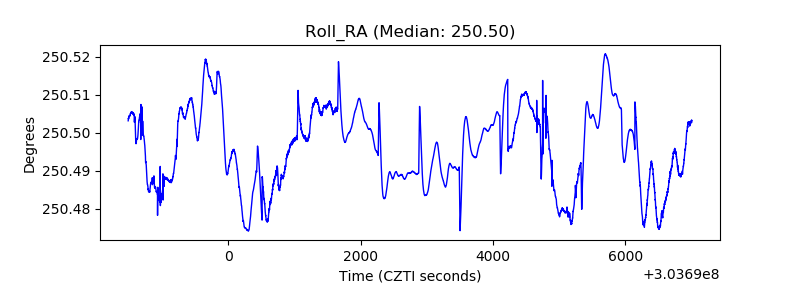 |
| Veto Counter |  |