| Param | Original file | Final file |
|---|---|---|
| Filename | modeM0/AS1A05_072T04_9000003094_21002cztM0_level2.evt | modeM0/AS1A05_072T04_9000003094_21002cztM0_level2_quad_clean.evt |
| Size (bytes) | 467,755,200 | 82,713,600 |
| Size | 446.1 MB | 78.9 MB |
| Events in quadrant A | 3,265,592 | 527,440 |
| Events in quadrant B | 3,667,366 | 537,309 |
| Events in quadrant C | 3,318,381 | 502,915 |
| Events in quadrant D | 3,473,430 | 483,882 |
| Mode M9 | |||
|---|---|---|---|
| Quadrant | BADHDUFLAG | Total packets | Discarded packets |
| A | 0 | 18 | 0 |
| B | 0 | 19 | 0 |
| C | 0 | 19 | 0 |
| D | 0 | 19 | 0 |
| Mode SS | |||
|---|---|---|---|
| Quadrant | BADHDUFLAG | Total packets | Discarded packets |
| A | 0 | 132 | 0 |
| B | 0 | 132 | 0 |
| C | 0 | 132 | 0 |
| D | 0 | 132 | 0 |
| Mode M0 | |||
|---|---|---|---|
| Quadrant | BADHDUFLAG | Total packets | Discarded packets |
| A | 0 | 13575 | 2 |
| B | 0 | 14879 | 2 |
| C | 0 | 13675 | 2 |
| D | 0 | 14639 | 2 |
| Quadrant | Total seconds | Saturated seconds | Saturation percentage |
|---|---|---|---|
| A | 6498 | 13 | 0.200062% |
| B | 6497 | 48 | 0.738803% |
| C | 6497 | 48 | 0.738803% |
| D | 6497 | 70 | 1.077420% |
Noise dominated data is calculated using 1-second bins in cleaned event files. If a bin has >2000 counts, and if more than 50% of those come from <1% of pixels, then it is considered to be noise-dominated and hence unusable.
| Quadrant | # 1 sec bins | Bins with >0 counts | Bins with >2000 counts | High rate bins dominated by noise | Noise dominated (total time) | Noise dominated (detector-on time) | Marked lightcurve |
|---|---|---|---|---|---|---|---|
| A | 7863 | 6499 | 0 | 0 | 0.00% | 0.00% | 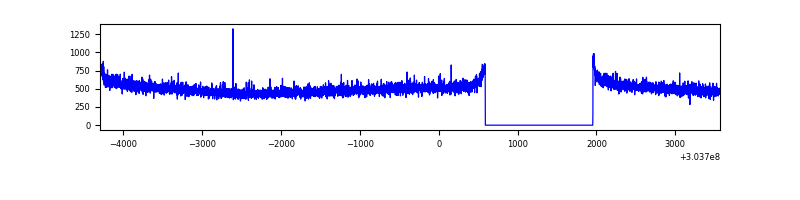 |
| B | 7862 | 6498 | 4 | 4 | 0.05% | 0.06% | 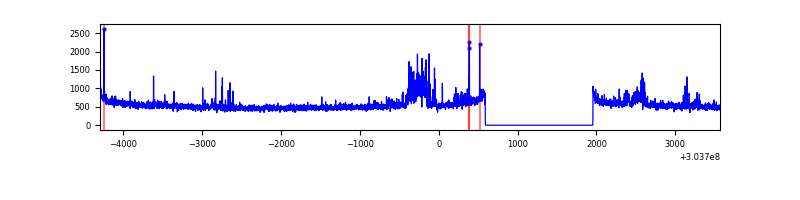 |
| C | 7862 | 6498 | 0 | 0 | 0.00% | 0.00% | 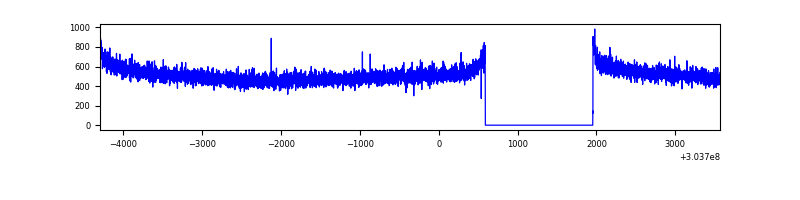 |
| D | 7862 | 6498 | 47 | 47 | 0.60% | 0.72% | 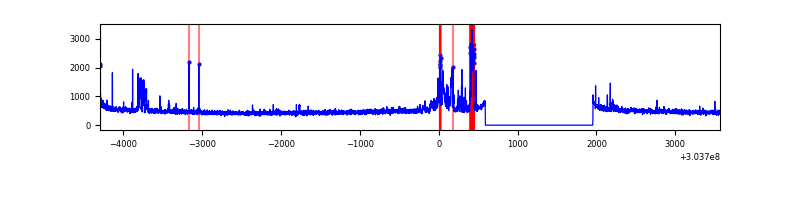 |
Top three noisy pixels from each quadrant. If the there are fewer than three noisy pixels in the level2.evt file, extra rows are filled as -1
| Pixel properties | Quadrant properties | ||||||
|---|---|---|---|---|---|---|---|
| Quadrant | DetID | PixID | Counts | Sigma | Mean | Median | Sigma |
| A | 0 | 226 | 7338 | 38.65 | 850 | 832 | 168.3 |
| A | 3 | 137 | 6222 | 32.02 | 850 | 832 | 168.3 |
| A | 12 | 194 | 5930 | 30.29 | 850 | 832 | 168.3 |
| B | 0 | 189 | 172986 | 1094.19 | 856 | 839 | 157.3 |
| B | 7 | 220 | 49721 | 310.7 | 856 | 839 | 157.3 |
| B | 4 | 216 | 36908 | 229.26 | 856 | 839 | 157.3 |
| C | 14 | 238 | 132223 | 692.32 | 815 | 822 | 189.8 |
| C | 10 | 91 | 7702 | 36.25 | 815 | 822 | 189.8 |
| C | 13 | 61 | 5695 | 25.67 | 815 | 822 | 189.8 |
| D | 15 | 0 | 368802 | 1885.15 | 810 | 789 | 195.2 |
| D | 2 | 234 | 25397 | 126.05 | 810 | 789 | 195.2 |
| D | 1 | 20 | 14124 | 68.31 | 810 | 789 | 195.2 |
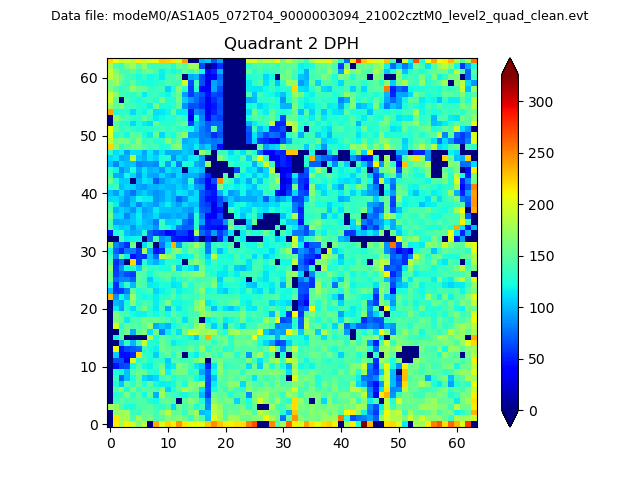
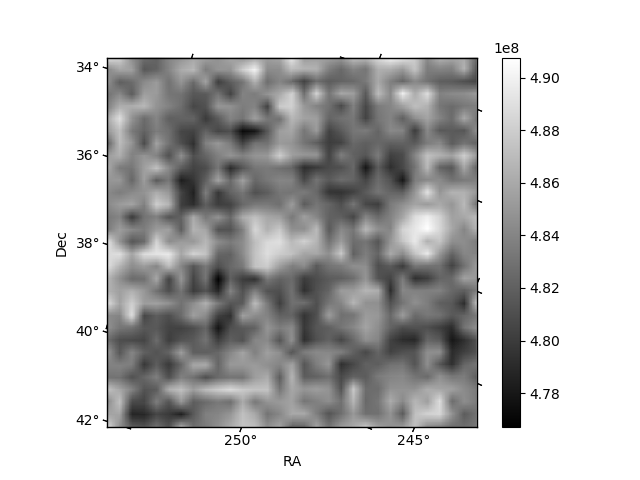
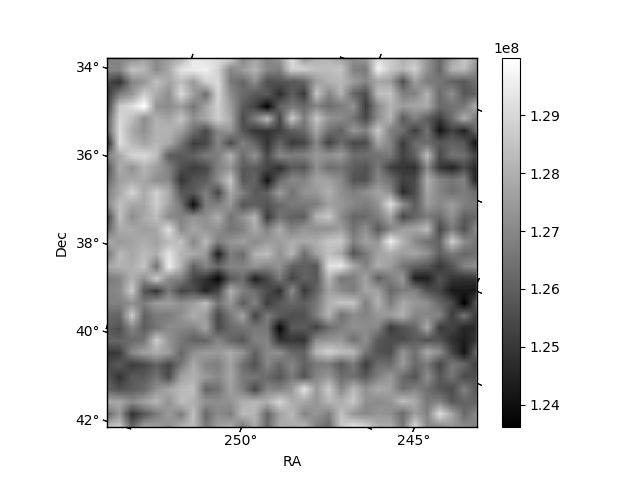
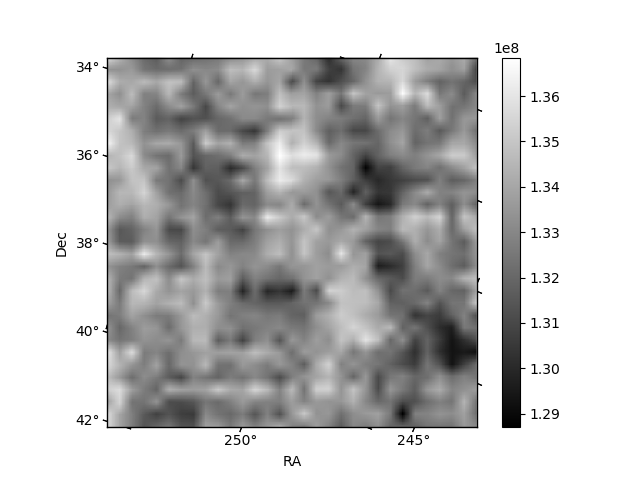
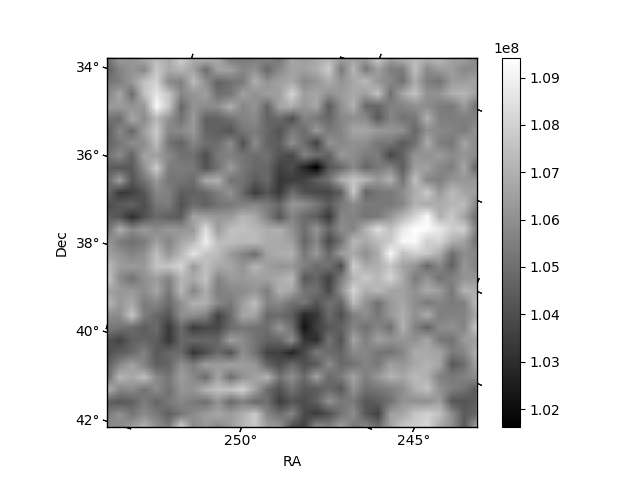
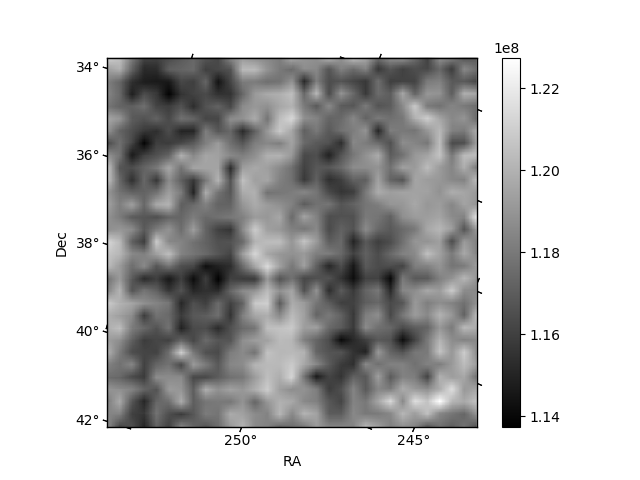
Histogram calculated using DETX and DETY for each event in the final _common_clean file
| Quadrant A | 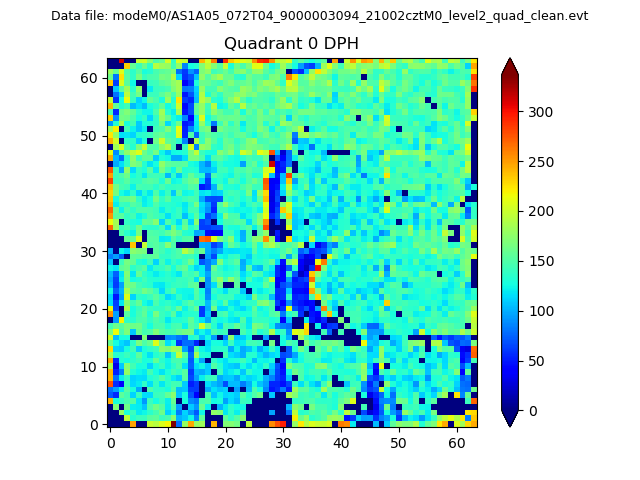 |
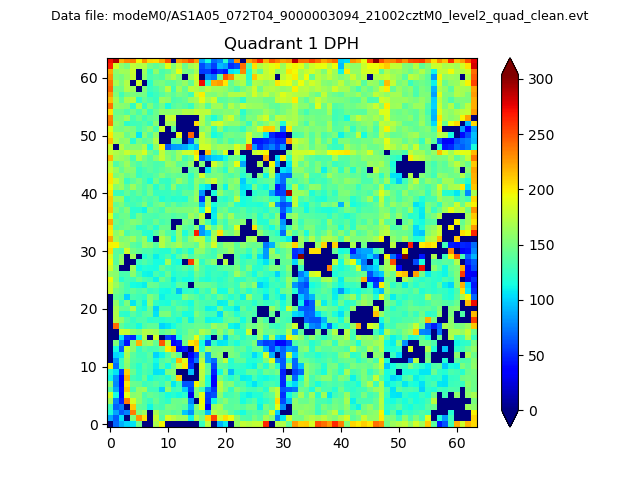 |
Quadrant B |
|---|---|---|---|
| Quadrant D | 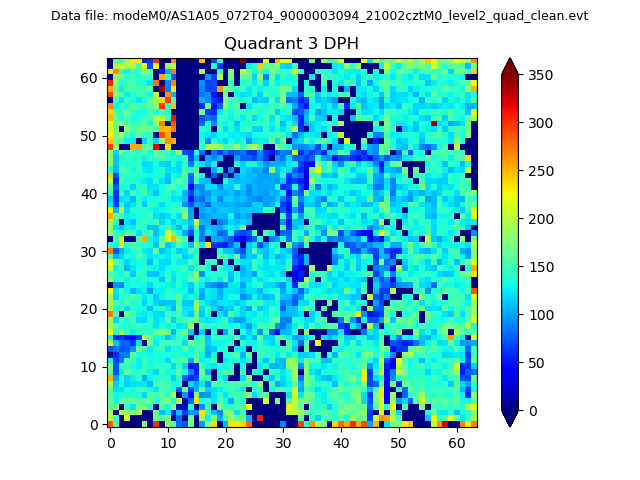 |
 |
Quadrant C |
| Plot type | Count rate plots | Images |
|---|---|---|
| Comparison with Poisson distribution Blue bars denote a histogram of data divided into 1 sec bins. Red curve is a Poisson curve with rate = median count rate of data. |
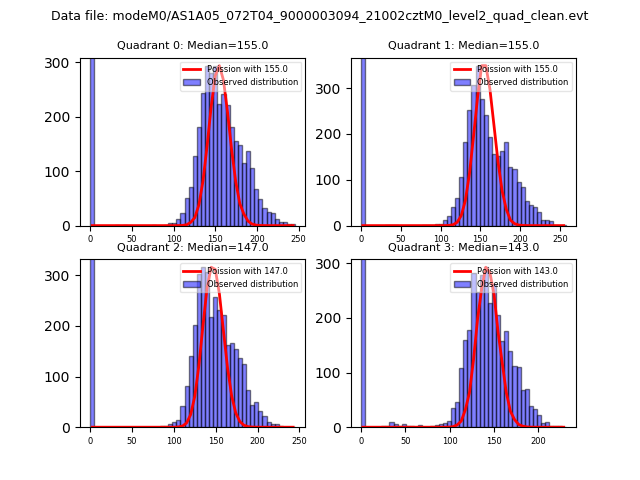 |
 |
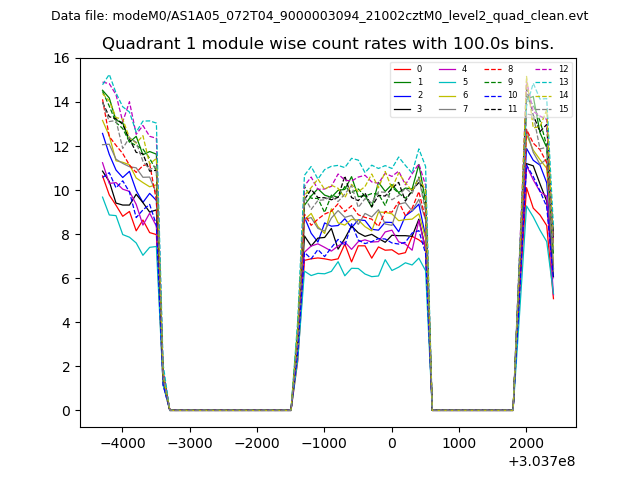
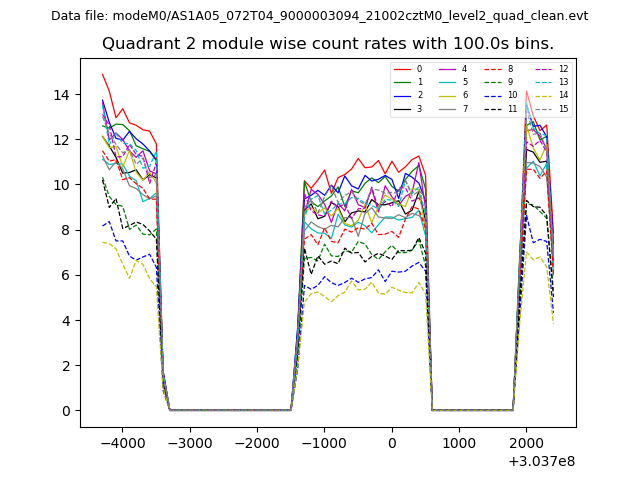
| Quadrant-wise count rates Data is divided into 100 sec bins |
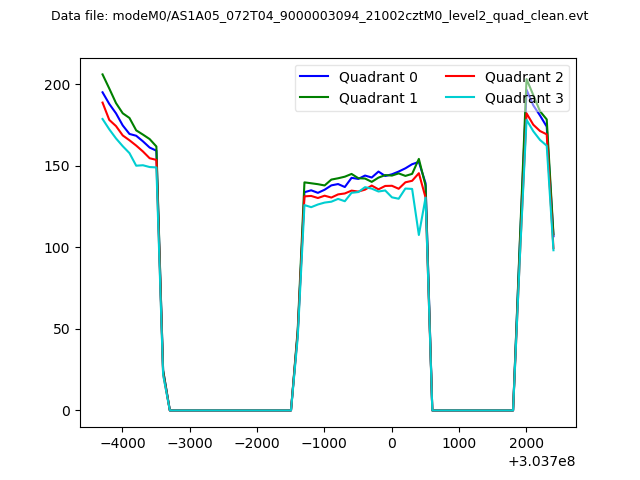 |
|
| Module-wise count rates for Quadrant A Data is divided into 100 sec bins |
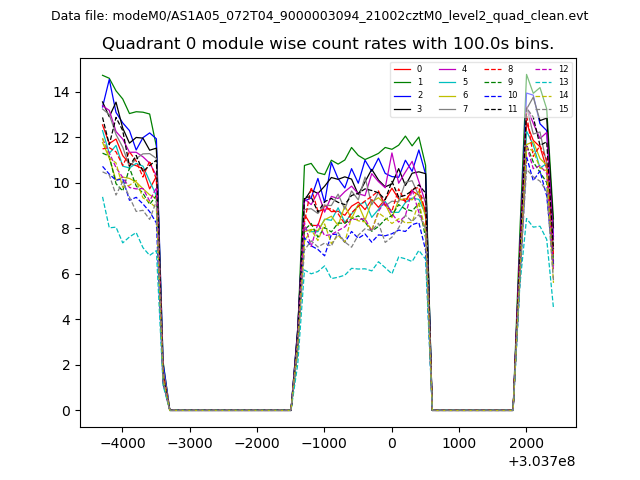 |
 |
| Module-wise count rates for Quadrant B Data is divided into 100 sec bins |
 |
 |
| Module-wise count rates for Quadrant C Data is divided into 100 sec bins |
 |
 |
| Module-wise count rates for Quadrant D Data is divided into 100 sec bins |
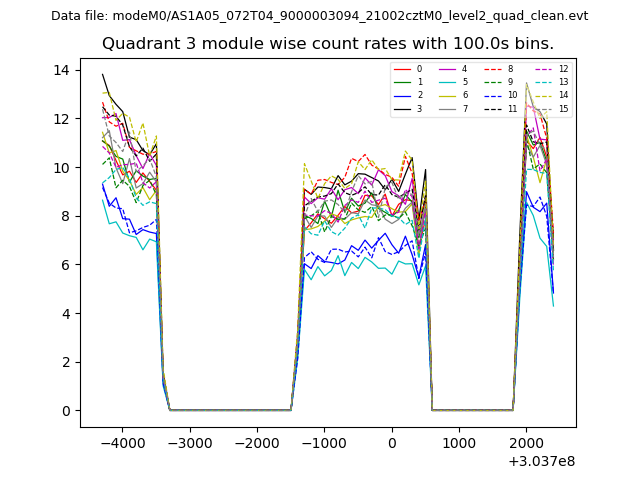 |
 |
| Parameter | Plot |
|---|---|
| CZT HV Monitor | 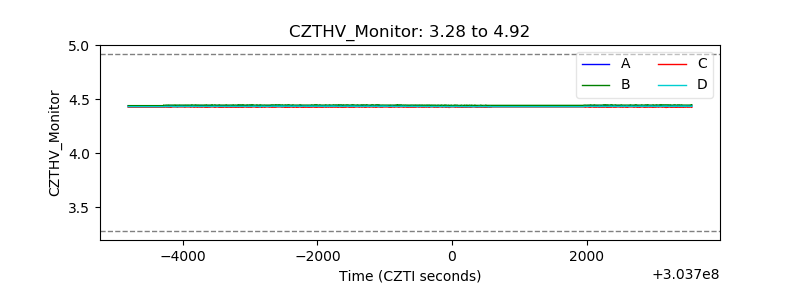 |
| D_VDD | 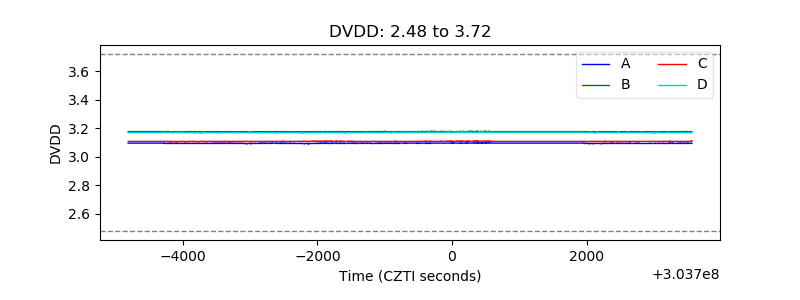 |
| Temperature 1 | 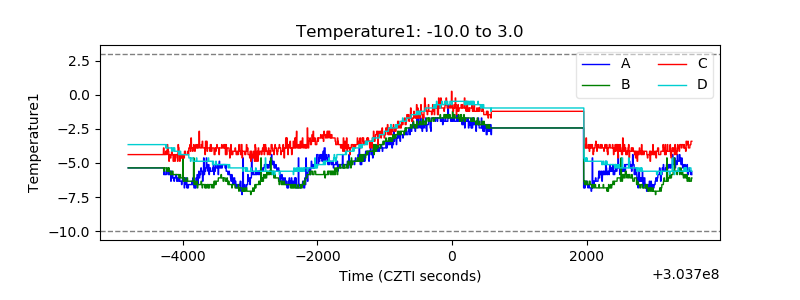 |
| Veto HV Monitor | 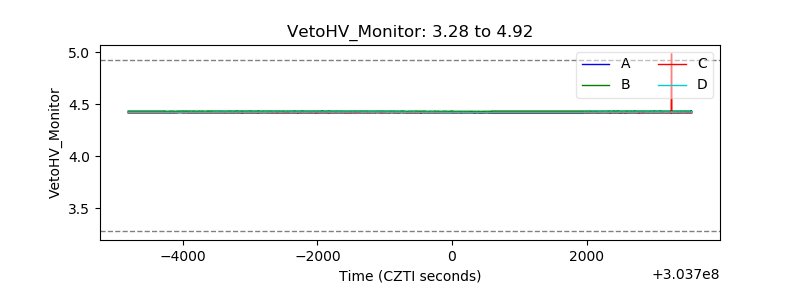 |
| Veto LLD | 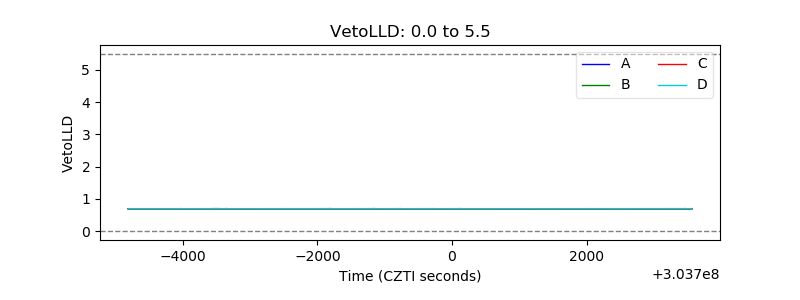 |
| Alpha Counter | 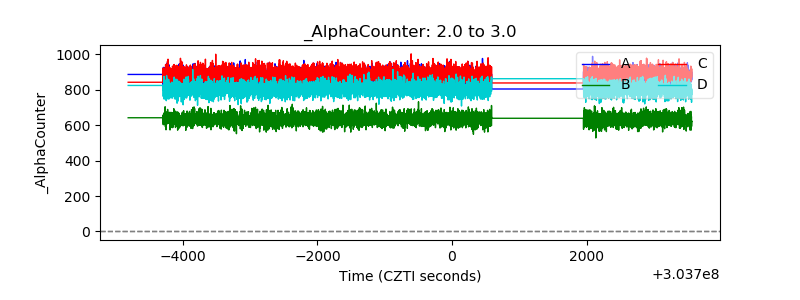 |
| _CPM_Rate | 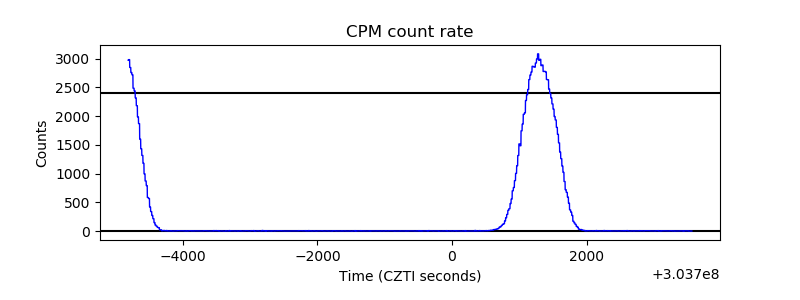 |
| CZT Counter | 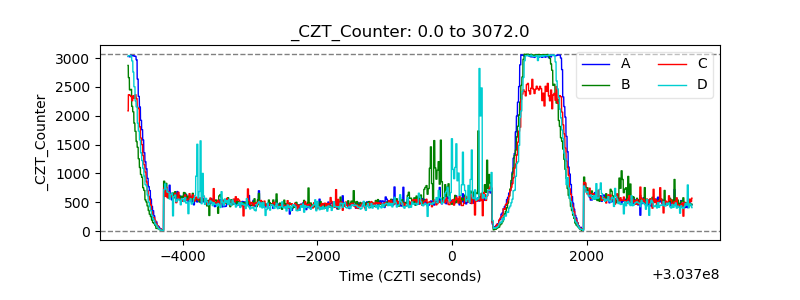 |
| +2.5 Volts monitor | 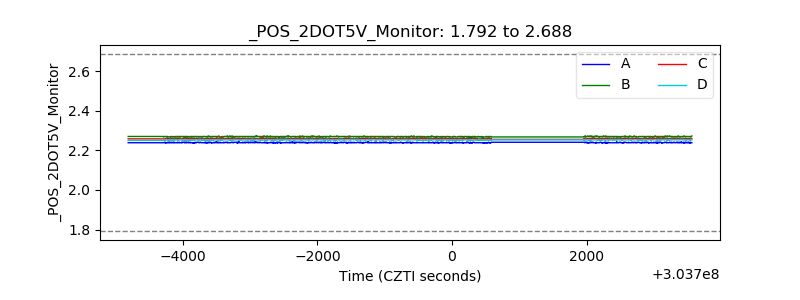 |
| +5 Volts monitor |  |
| _ROLL_ROT | 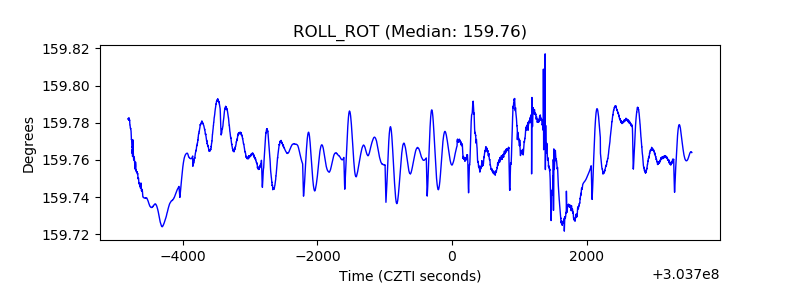 |
| _Roll_DEC | 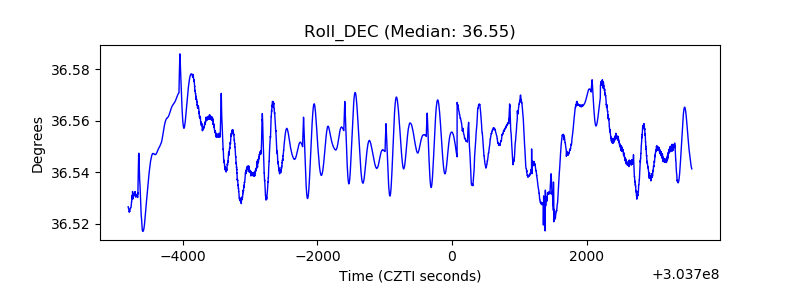 |
| _Roll_RA | 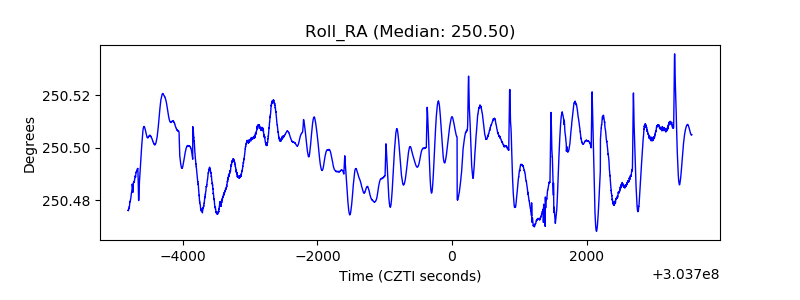 |
| Veto Counter | 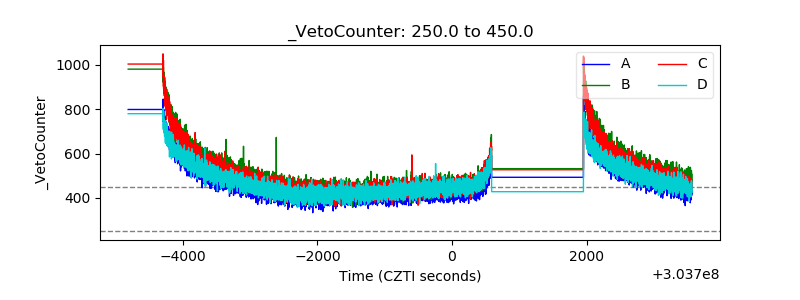 |