| Param | Original file | Final file |
|---|---|---|
| Filename | modeM0/AS1A05_072T04_9000003094_21003cztM0_level2.evt | modeM0/AS1A05_072T04_9000003094_21003cztM0_level2_quad_clean.evt |
| Size (bytes) | 462,032,640 | 72,109,440 |
| Size | 440.6 MB | 68.8 MB |
| Events in quadrant A | 3,251,092 | 446,117 |
| Events in quadrant B | 3,735,790 | 450,557 |
| Events in quadrant C | 3,351,389 | 422,281 |
| Events in quadrant D | 3,217,138 | 415,409 |
| Mode M9 | |||
|---|---|---|---|
| Quadrant | BADHDUFLAG | Total packets | Discarded packets |
| A | 0 | 14 | 0 |
| B | 0 | 14 | 0 |
| C | 0 | 14 | 0 |
| D | 0 | 14 | 0 |
| Mode SS | |||
|---|---|---|---|
| Quadrant | BADHDUFLAG | Total packets | Discarded packets |
| A | 0 | 130 | 0 |
| B | 0 | 130 | 0 |
| C | 0 | 130 | 0 |
| D | 0 | 130 | 0 |
| Mode M0 | |||
|---|---|---|---|
| Quadrant | BADHDUFLAG | Total packets | Discarded packets |
| A | 0 | 13382 | 2 |
| B | 0 | 15018 | 2 |
| C | 0 | 13700 | 2 |
| D | 0 | 13729 | 2 |
| Quadrant | Total seconds | Saturated seconds | Saturation percentage |
|---|---|---|---|
| A | 6439 | 20 | 0.310607% |
| B | 6440 | 95 | 1.475155% |
| C | 6440 | 55 | 0.854037% |
| D | 6440 | 20 | 0.310559% |
Noise dominated data is calculated using 1-second bins in cleaned event files. If a bin has >2000 counts, and if more than 50% of those come from <1% of pixels, then it is considered to be noise-dominated and hence unusable.
| Quadrant | # 1 sec bins | Bins with >0 counts | Bins with >2000 counts | High rate bins dominated by noise | Noise dominated (total time) | Noise dominated (detector-on time) | Marked lightcurve |
|---|---|---|---|---|---|---|---|
| A | 7819 | 6440 | 0 | 0 | 0.00% | 0.00% | 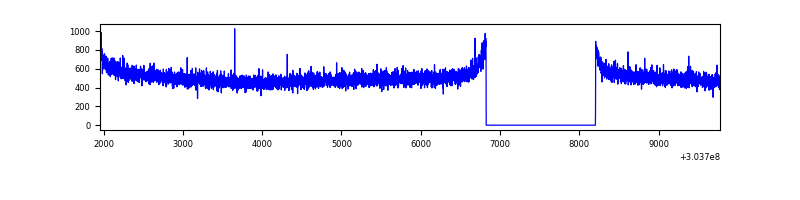 |
| B | 7820 | 6441 | 33 | 33 | 0.42% | 0.51% | 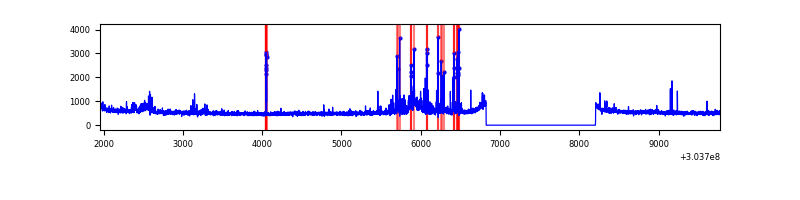 |
| C | 7820 | 6441 | 0 | 0 | 0.00% | 0.00% | 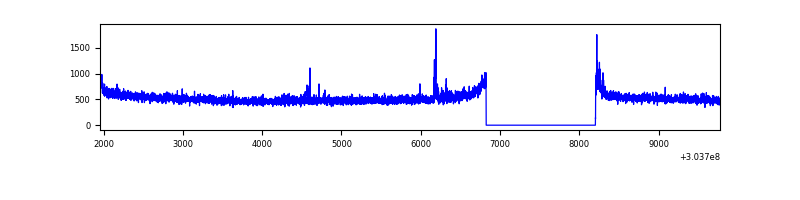 |
| D | 7820 | 6441 | 11 | 11 | 0.14% | 0.17% | 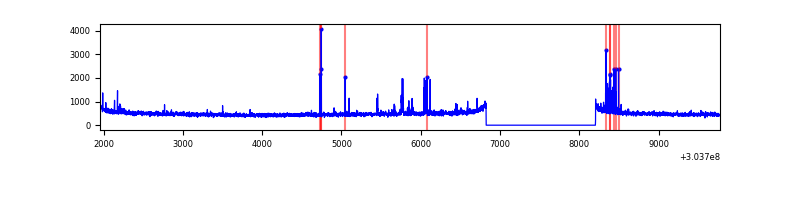 |
Top three noisy pixels from each quadrant. If the there are fewer than three noisy pixels in the level2.evt file, extra rows are filled as -1
| Pixel properties | Quadrant properties | ||||||
|---|---|---|---|---|---|---|---|
| Quadrant | DetID | PixID | Counts | Sigma | Mean | Median | Sigma |
| A | 0 | 226 | 7265 | 38.36 | 846 | 832 | 167.7 |
| A | 3 | 137 | 6324 | 32.75 | 846 | 832 | 167.7 |
| A | 12 | 194 | 5820 | 29.74 | 846 | 832 | 167.7 |
| B | 7 | 220 | 173612 | 1105.06 | 849 | 831 | 156.4 |
| B | 0 | 189 | 152910 | 972.65 | 849 | 831 | 156.4 |
| B | 3 | 64 | 36107 | 225.62 | 849 | 831 | 156.4 |
| C | 14 | 238 | 130604 | 697.69 | 806 | 813 | 186.0 |
| C | 9 | 54 | 56346 | 298.52 | 806 | 813 | 186.0 |
| C | 10 | 91 | 21253 | 109.87 | 806 | 813 | 186.0 |
| D | 13 | 104 | 88875 | 454.68 | 809 | 787 | 193.7 |
| D | 2 | 234 | 30198 | 151.81 | 809 | 787 | 193.7 |
| D | 7 | 238 | 16565 | 81.44 | 809 | 787 | 193.7 |
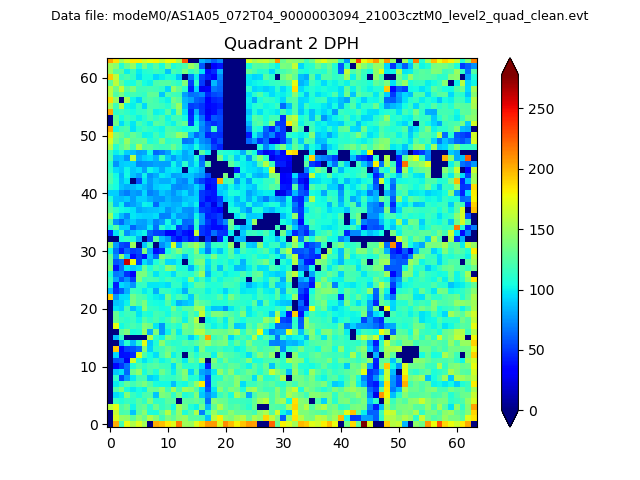
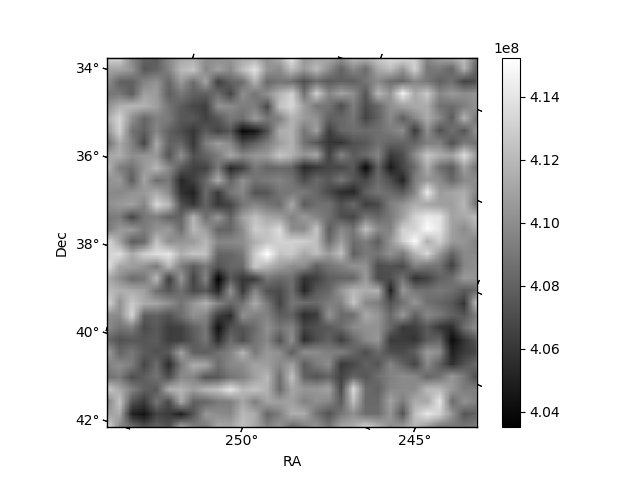
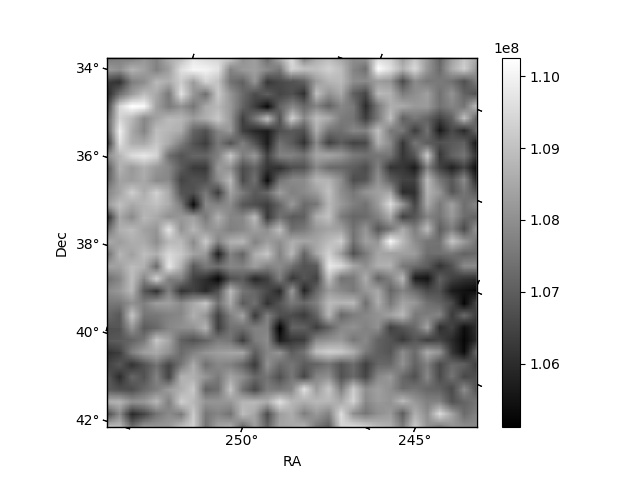
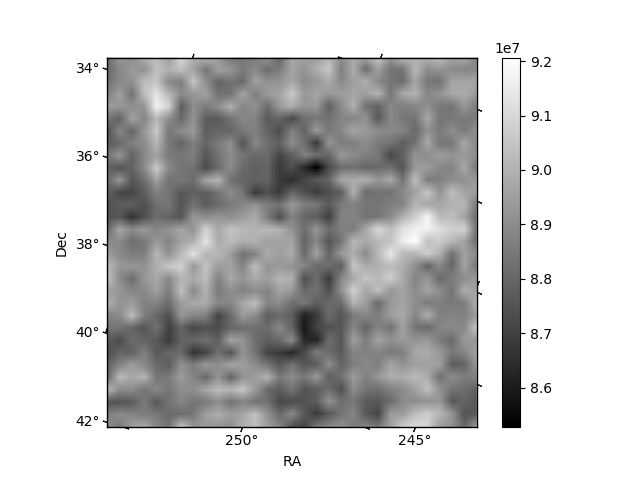
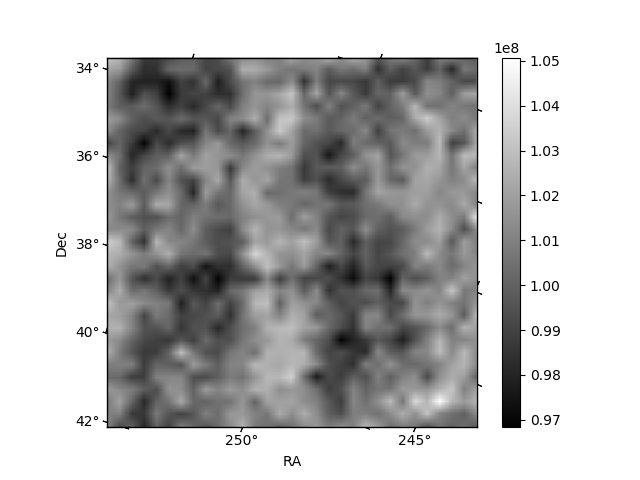
Histogram calculated using DETX and DETY for each event in the final _common_clean file
| Quadrant A | 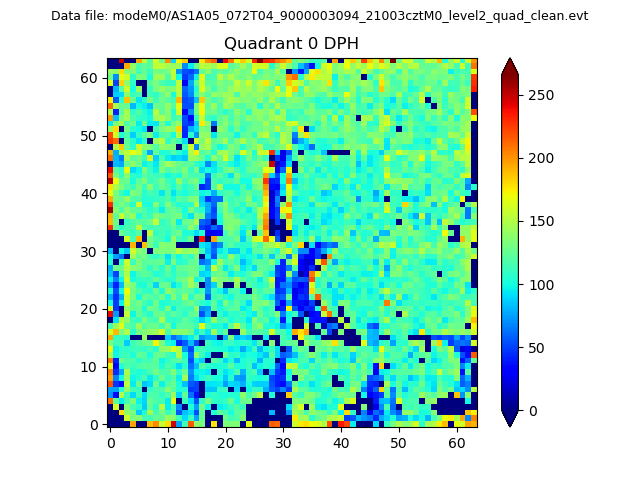 |
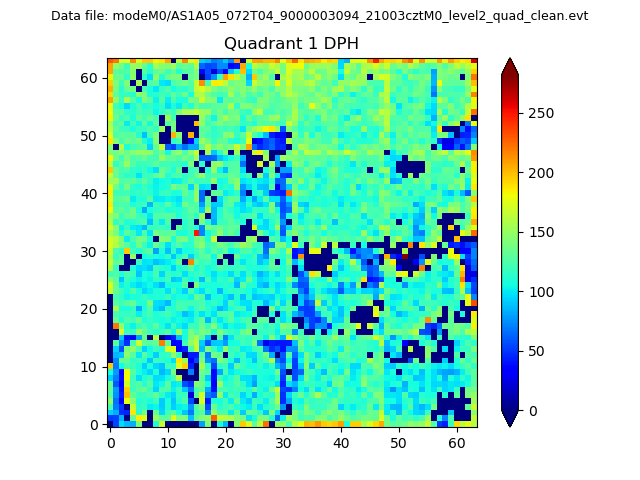 |
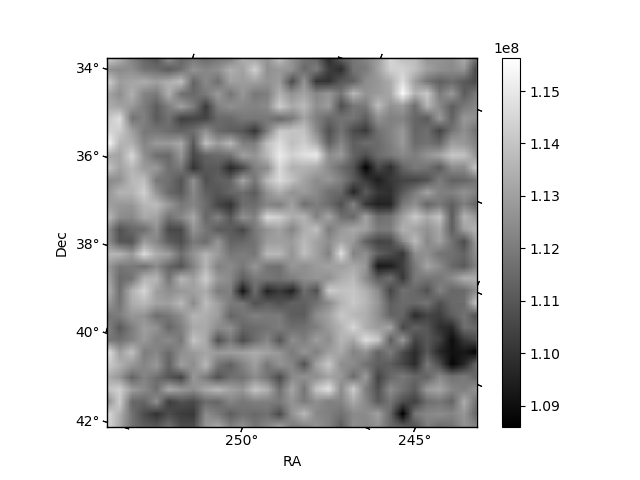
Quadrant B |
|---|---|---|---|
| Quadrant D | 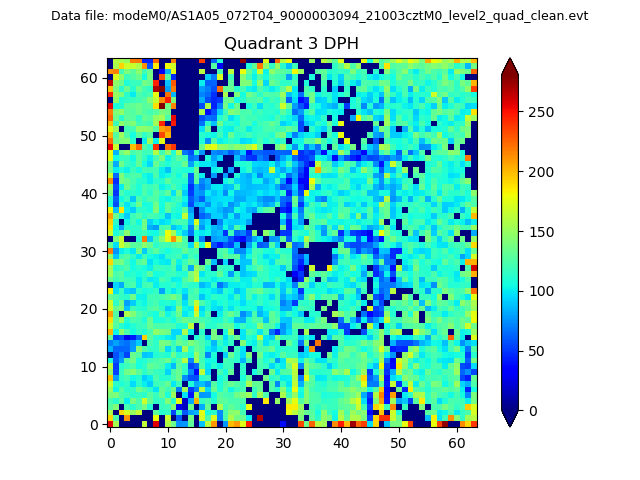 |
 |
Quadrant C |
| Plot type | Count rate plots | Images |
|---|---|---|
| Comparison with Poisson distribution Blue bars denote a histogram of data divided into 1 sec bins. Red curve is a Poisson curve with rate = median count rate of data. |
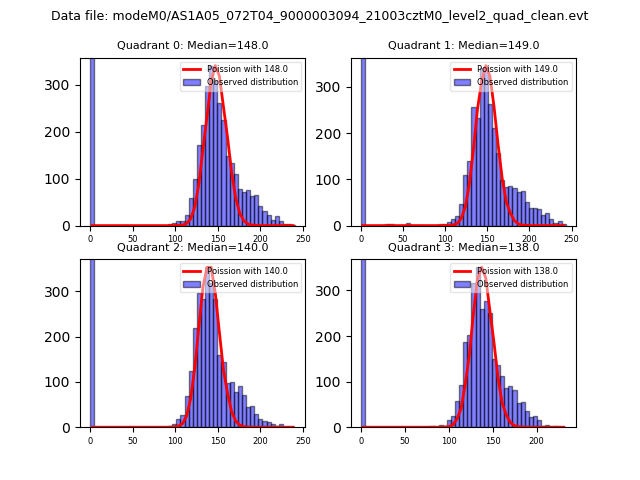 |
 |
| Quadrant-wise count rates Data is divided into 100 sec bins |
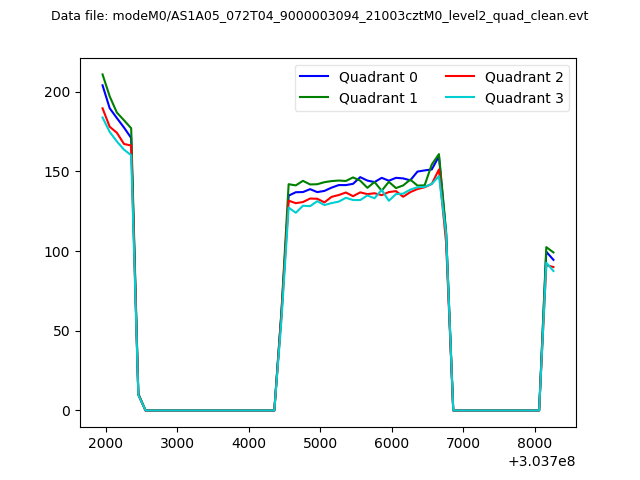 |
|
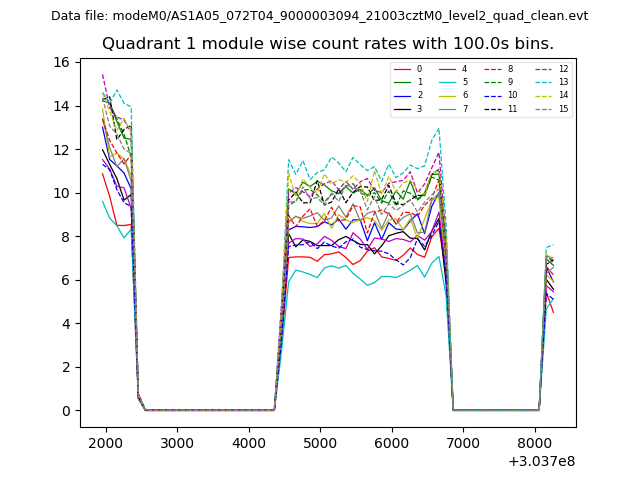
| Module-wise count rates for Quadrant A Data is divided into 100 sec bins |
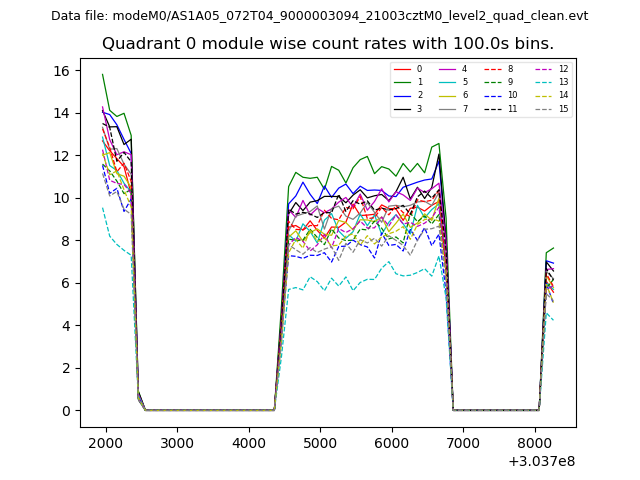 |
 |
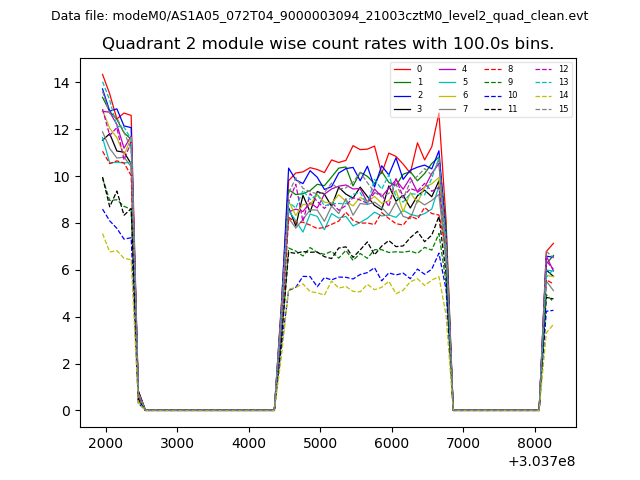
| Module-wise count rates for Quadrant B Data is divided into 100 sec bins |
 |
 |
| Module-wise count rates for Quadrant C Data is divided into 100 sec bins |
 |
 |
| Module-wise count rates for Quadrant D Data is divided into 100 sec bins |
 |
 |
| Parameter | Plot |
|---|---|
| CZT HV Monitor | 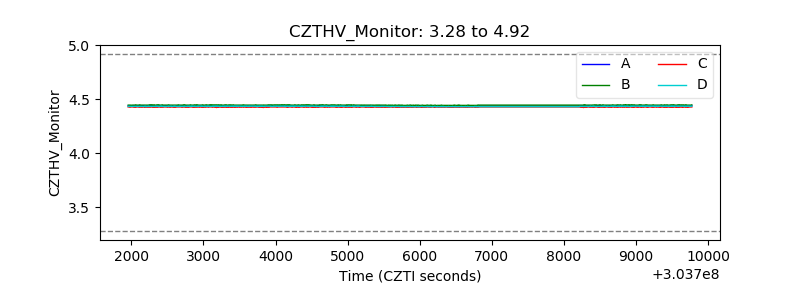 |
| D_VDD | 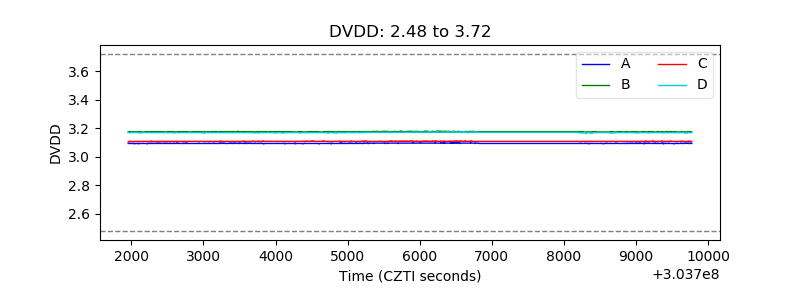 |
| Temperature 1 | 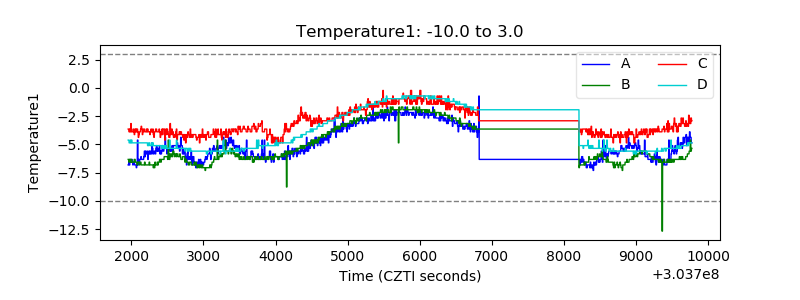 |
| Veto HV Monitor | 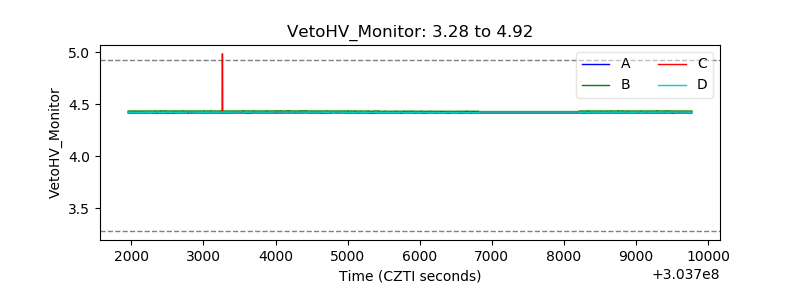 |
| Veto LLD |  |
| Alpha Counter | 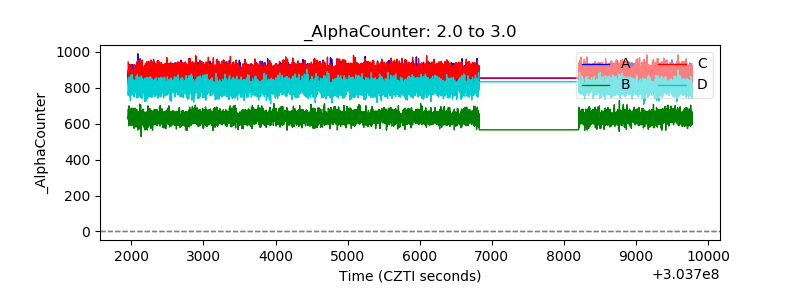 |
| _CPM_Rate | 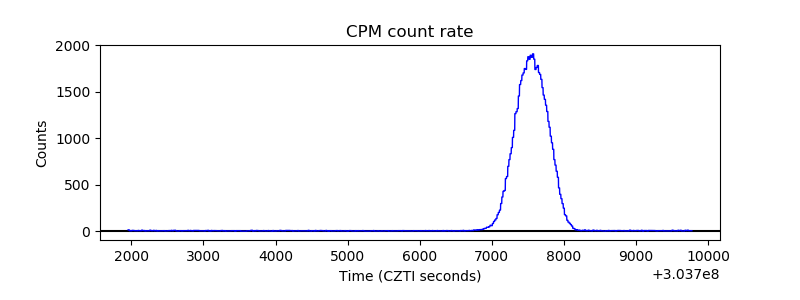 |
| CZT Counter | 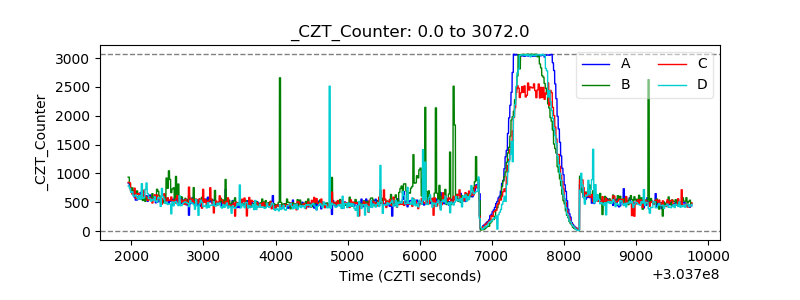 |
| +2.5 Volts monitor |  |
| +5 Volts monitor |  |
| _ROLL_ROT | 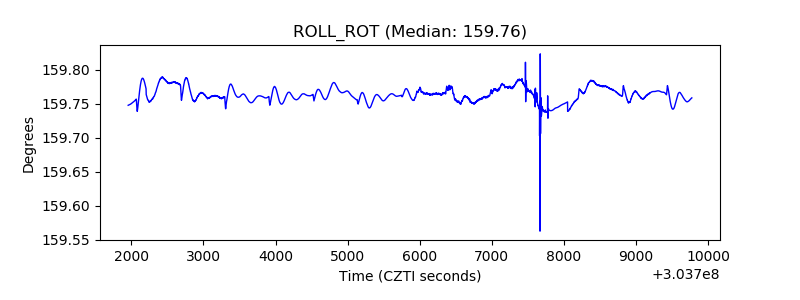 |
| _Roll_DEC | 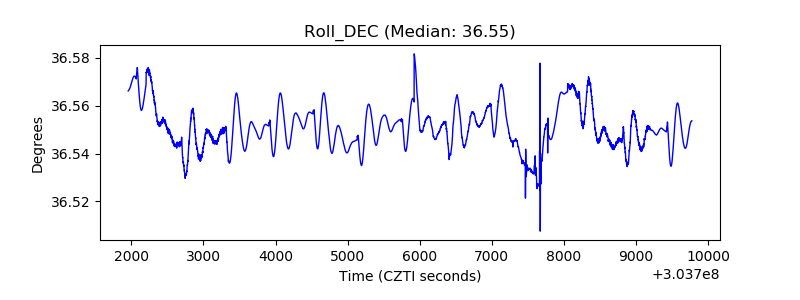 |
| _Roll_RA | 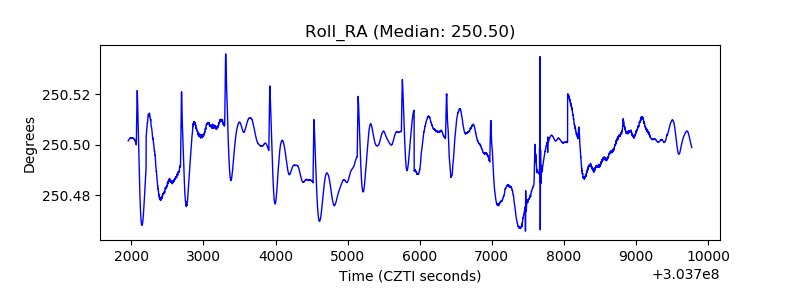 |
| Veto Counter | 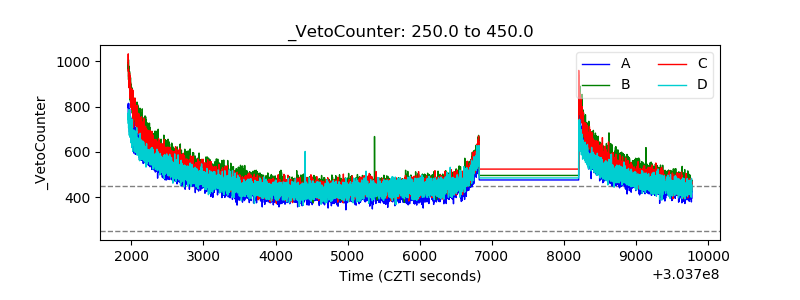 |