| Param | Original file | Final file |
|---|---|---|
| Filename | modeM0/AS1A05_072T04_9000003094_21004cztM0_level2.evt | modeM0/AS1A05_072T04_9000003094_21004cztM0_level2_quad_clean.evt |
| Size (bytes) | 458,444,160 | 65,805,120 |
| Size | 437.2 MB | 62.8 MB |
| Events in quadrant A | 3,047,720 | 406,879 |
| Events in quadrant B | 3,456,635 | 404,861 |
| Events in quadrant C | 3,825,291 | 372,695 |
| Events in quadrant D | 3,138,327 | 380,226 |
| Mode M9 | |||
|---|---|---|---|
| Quadrant | BADHDUFLAG | Total packets | Discarded packets |
| A | 0 | 12 | 0 |
| B | 0 | 12 | 0 |
| C | 0 | 12 | 0 |
| D | 0 | 12 | 0 |
| Mode SS | |||
|---|---|---|---|
| Quadrant | BADHDUFLAG | Total packets | Discarded packets |
| A | 0 | 124 | 0 |
| B | 0 | 124 | 0 |
| C | 0 | 124 | 0 |
| D | 0 | 124 | 0 |
| Mode M0 | |||
|---|---|---|---|
| Quadrant | BADHDUFLAG | Total packets | Discarded packets |
| A | 0 | 12680 | 1 |
| B | 0 | 13845 | 1 |
| C | 0 | 15080 | 1 |
| D | 0 | 13147 | 1 |
| Quadrant | Total seconds | Saturated seconds | Saturation percentage |
|---|---|---|---|
| A | 6125 | 88 | 1.436735% |
| B | 6126 | 179 | 2.921972% |
| C | 6126 | 311 | 5.076722% |
| D | 6126 | 58 | 0.946784% |
Noise dominated data is calculated using 1-second bins in cleaned event files. If a bin has >2000 counts, and if more than 50% of those come from <1% of pixels, then it is considered to be noise-dominated and hence unusable.
| Quadrant | # 1 sec bins | Bins with >0 counts | Bins with >2000 counts | High rate bins dominated by noise | Noise dominated (total time) | Noise dominated (detector-on time) | Marked lightcurve |
|---|---|---|---|---|---|---|---|
| A | 7320 | 6126 | 0 | 0 | 0.00% | 0.00% | 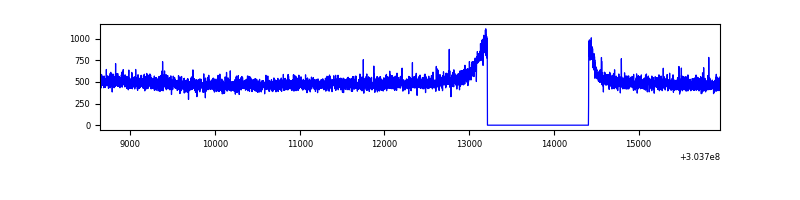 |
| B | 7321 | 6127 | 30 | 30 | 0.41% | 0.49% | 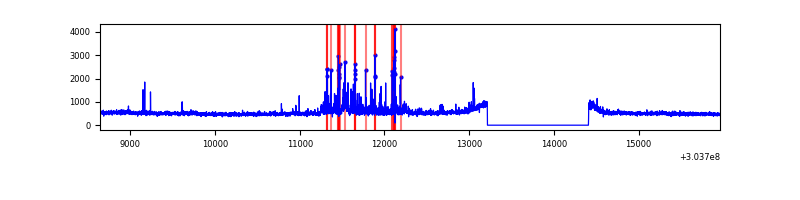 |
| C | 7321 | 6127 | 103 | 103 | 1.41% | 1.68% | 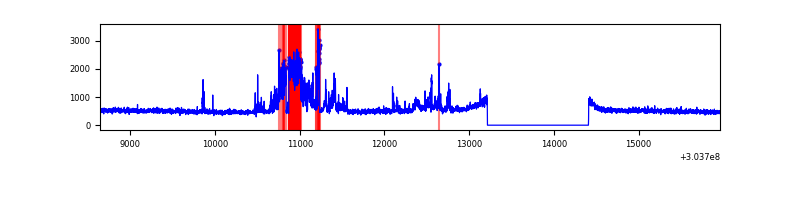 |
| D | 7321 | 6127 | 17 | 17 | 0.23% | 0.28% | 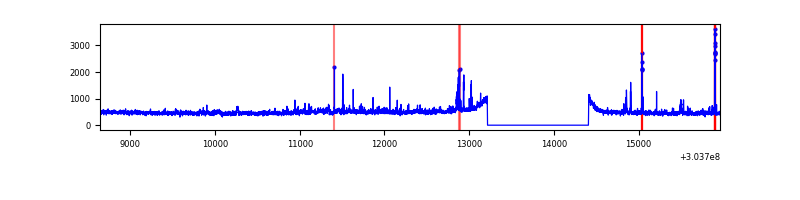 |
Top three noisy pixels from each quadrant. If the there are fewer than three noisy pixels in the level2.evt file, extra rows are filled as -1
| Pixel properties | Quadrant properties | ||||||
|---|---|---|---|---|---|---|---|
| Quadrant | DetID | PixID | Counts | Sigma | Mean | Median | Sigma |
| A | 0 | 226 | 6679 | 37.07 | 793 | 777 | 159.2 |
| A | 3 | 137 | 6341 | 34.95 | 793 | 777 | 159.2 |
| A | 12 | 194 | 5591 | 30.24 | 793 | 777 | 159.2 |
| B | 7 | 220 | 230440 | 1541.6 | 789 | 772 | 149.0 |
| B | 0 | 189 | 84913 | 564.78 | 789 | 772 | 149.0 |
| B | 4 | 216 | 17566 | 112.73 | 789 | 772 | 149.0 |
| C | 9 | 54 | 765895 | 4450.15 | 744 | 747 | 171.9 |
| C | 14 | 238 | 118859 | 686.95 | 744 | 747 | 171.9 |
| C | 10 | 91 | 39182 | 223.54 | 744 | 747 | 171.9 |
| D | 1 | 52 | 170174 | 910.64 | 760 | 737 | 186.1 |
| D | 13 | 104 | 36935 | 194.55 | 760 | 737 | 186.1 |
| D | 7 | 238 | 32083 | 168.47 | 760 | 737 | 186.1 |
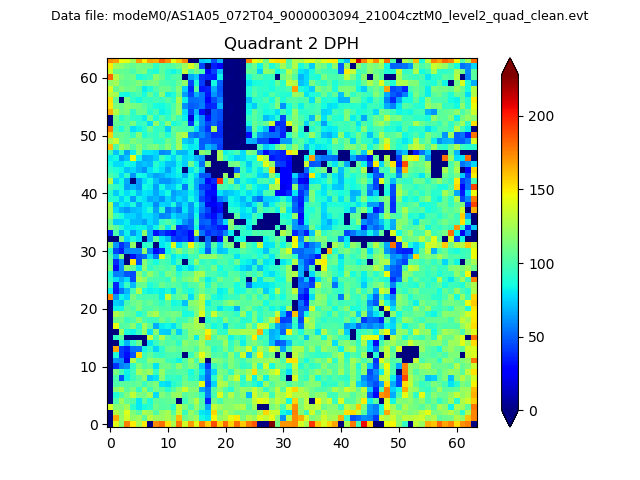
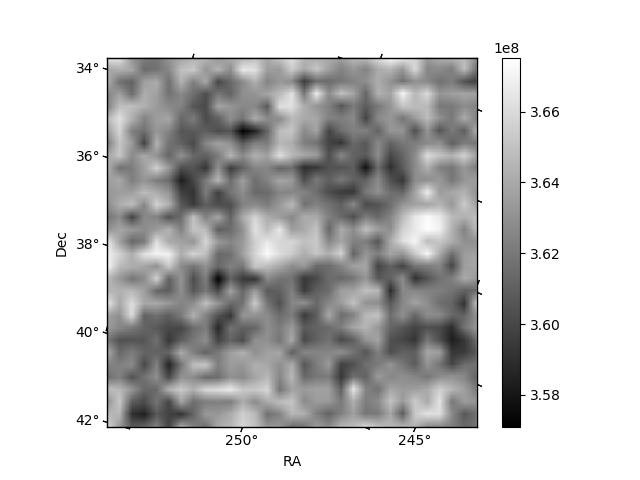
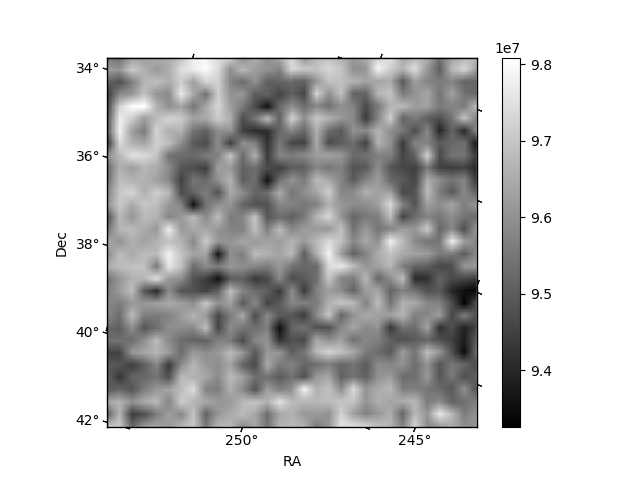
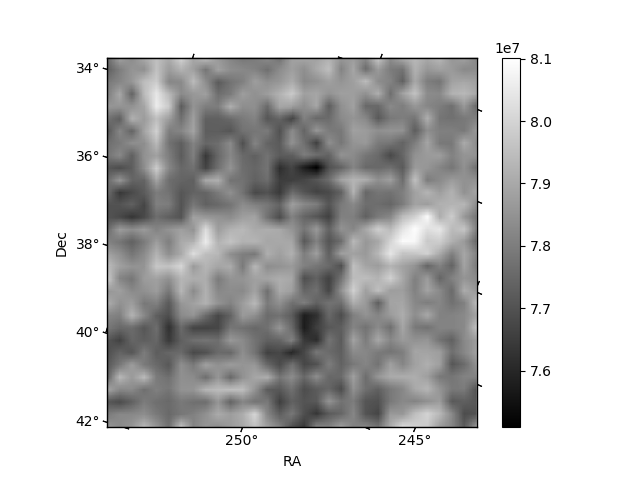
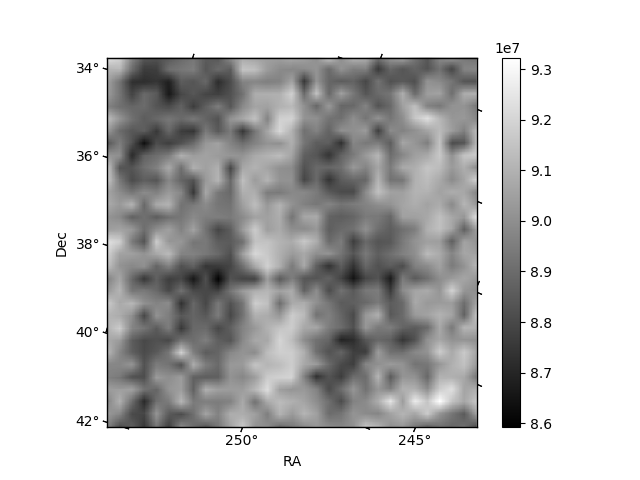
Histogram calculated using DETX and DETY for each event in the final _common_clean file
| Quadrant A | 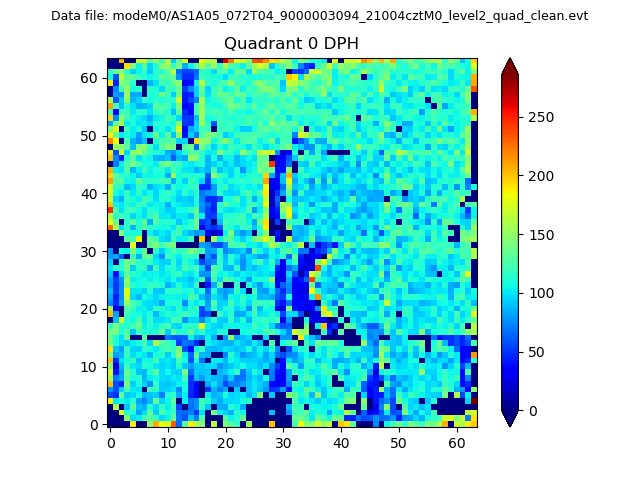 |
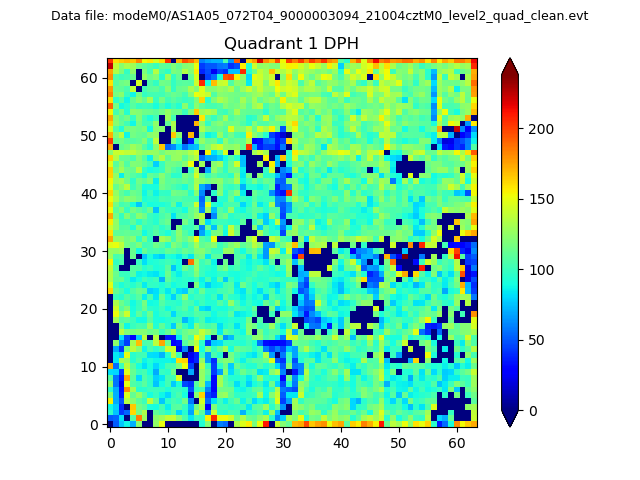 |
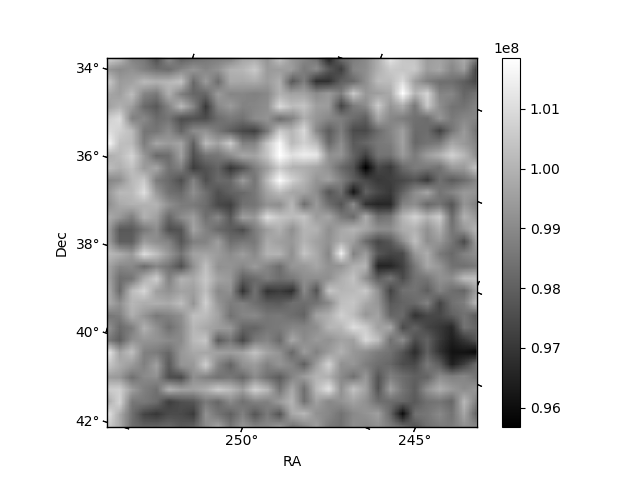
Quadrant B |
|---|---|---|---|
| Quadrant D | 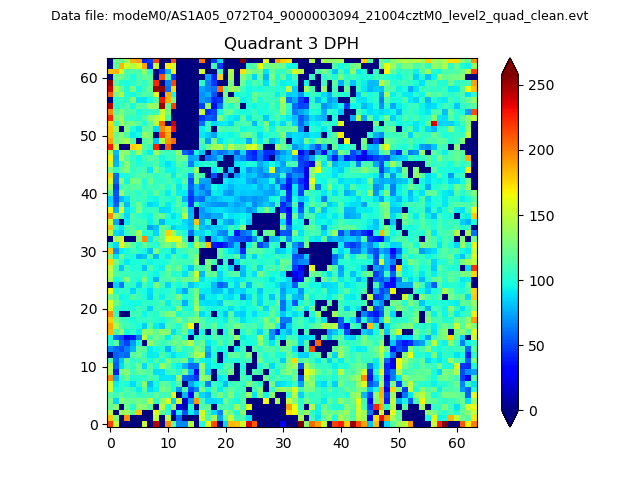 |
 |
Quadrant C |
| Plot type | Count rate plots | Images |
|---|---|---|
| Comparison with Poisson distribution Blue bars denote a histogram of data divided into 1 sec bins. Red curve is a Poisson curve with rate = median count rate of data. |
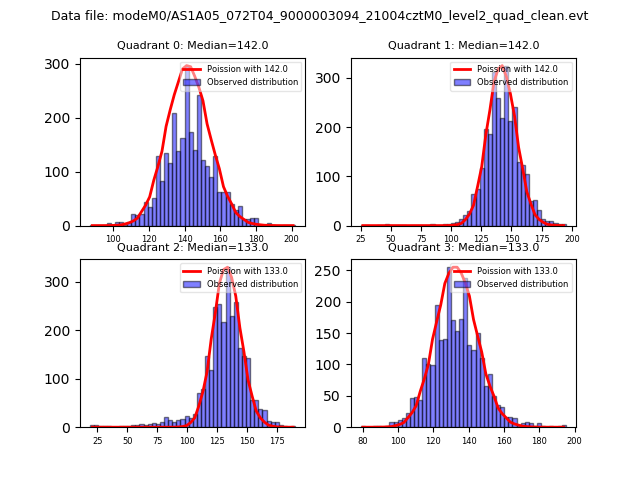 |
 |
| Quadrant-wise count rates Data is divided into 100 sec bins |
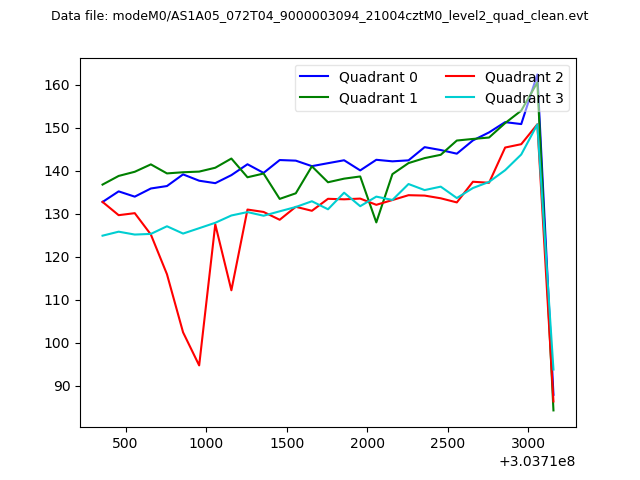 |
|
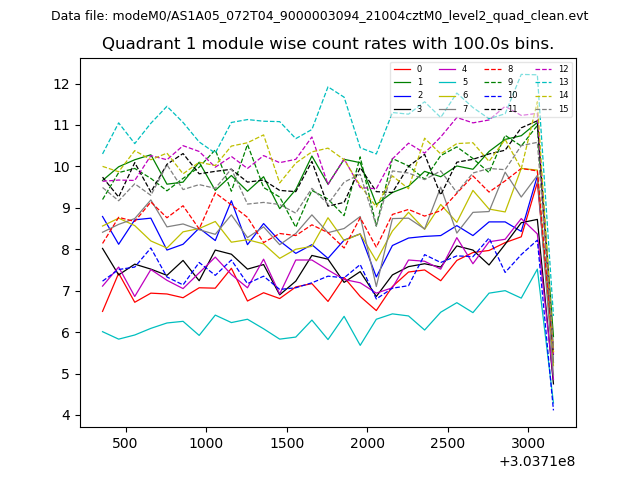
| Module-wise count rates for Quadrant A Data is divided into 100 sec bins |
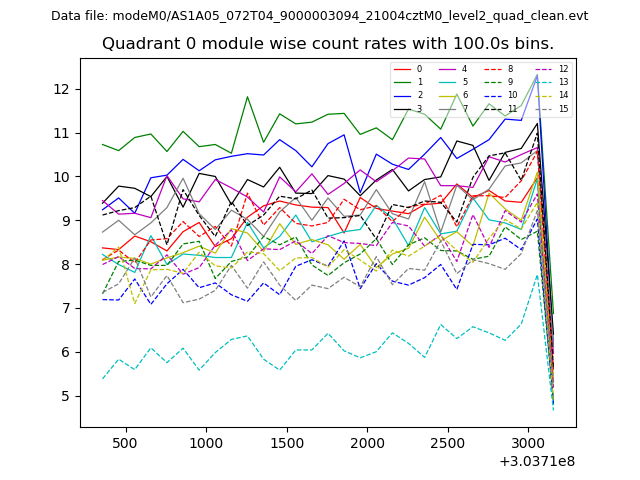 |
 |
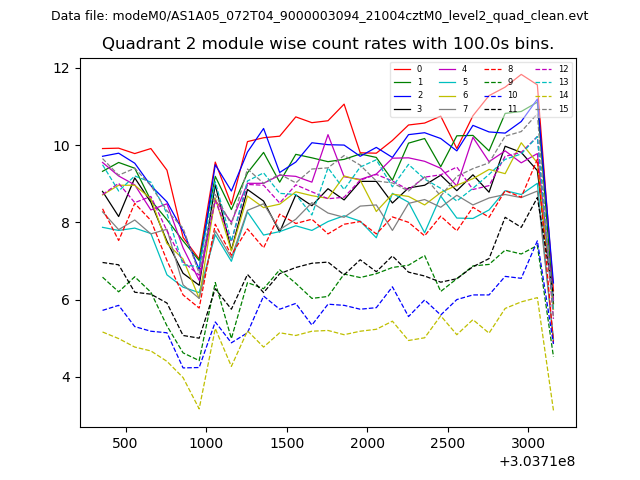
| Module-wise count rates for Quadrant B Data is divided into 100 sec bins |
 |
 |
| Module-wise count rates for Quadrant C Data is divided into 100 sec bins |
 |
 |
| Module-wise count rates for Quadrant D Data is divided into 100 sec bins |
 |
 |
| Parameter | Plot |
|---|---|
| CZT HV Monitor | 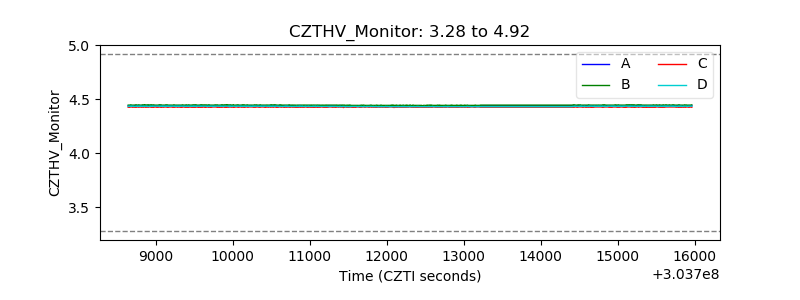 |
| D_VDD | 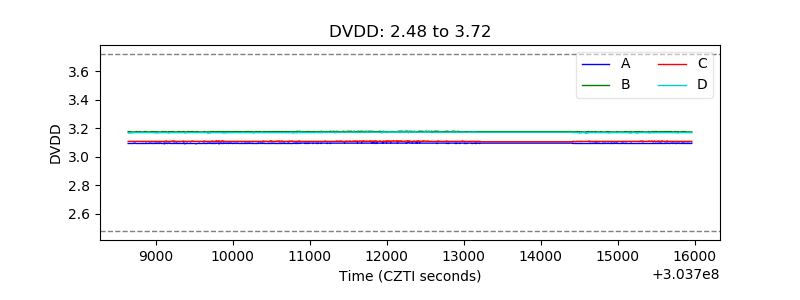 |
| Temperature 1 | 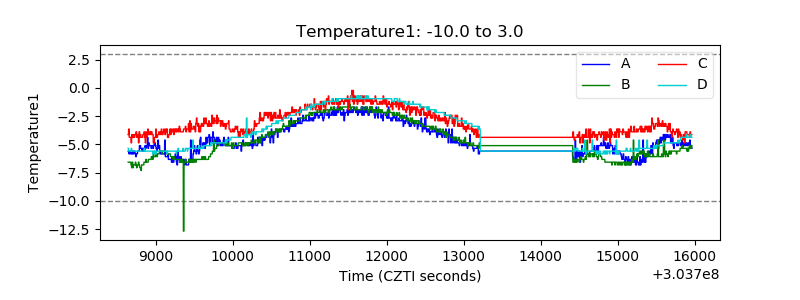 |
| Veto HV Monitor | 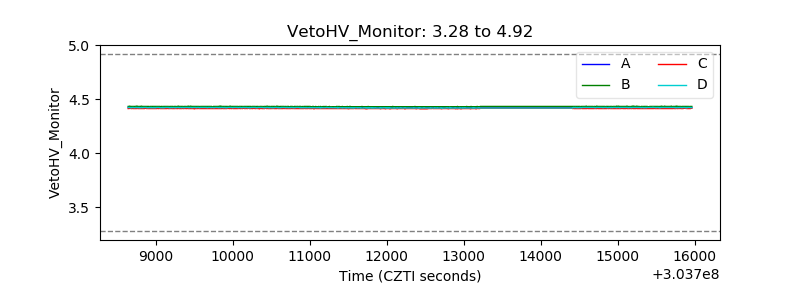 |
| Veto LLD |  |
| Alpha Counter | 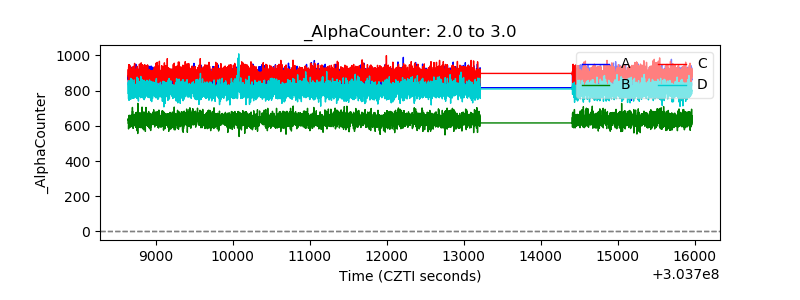 |
| _CPM_Rate | 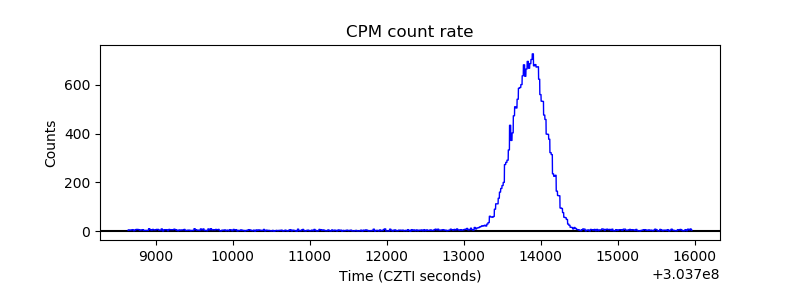 |
| CZT Counter | 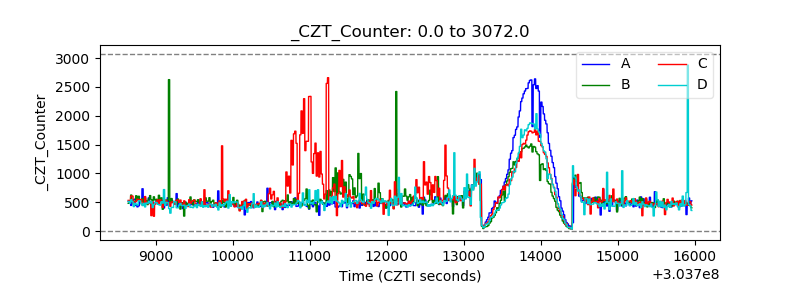 |
| +2.5 Volts monitor |  |
| +5 Volts monitor |  |
| _ROLL_ROT | 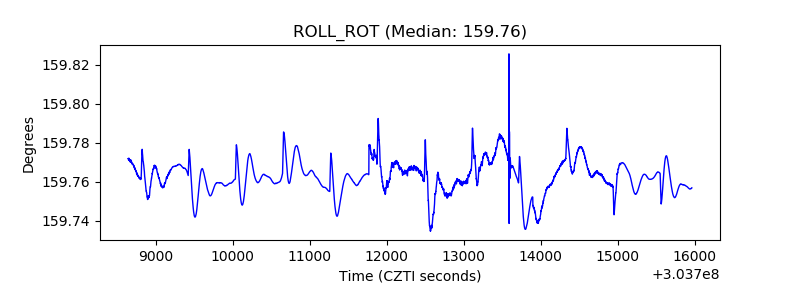 |
| _Roll_DEC | 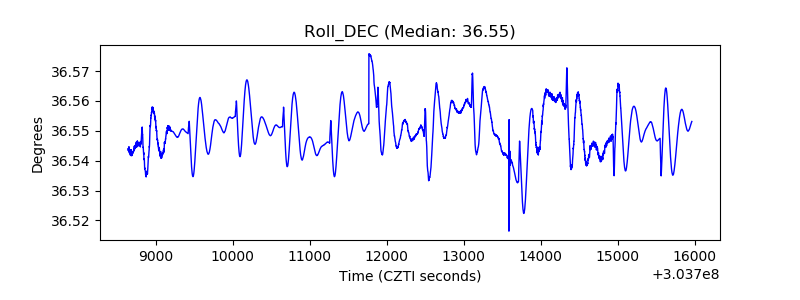 |
| _Roll_RA | 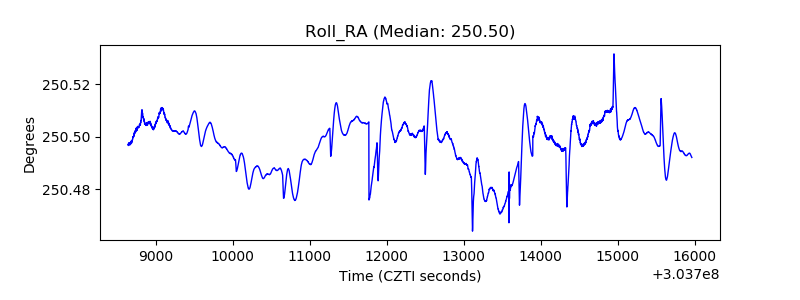 |
| Veto Counter |  |