| Param | Original file | Final file |
|---|---|---|
| Filename | modeM0/AS1A05_072T04_9000003094_21005cztM0_level2.evt | modeM0/AS1A05_072T04_9000003094_21005cztM0_level2_quad_clean.evt |
| Size (bytes) | 313,145,280 | 58,527,360 |
| Size | 298.6 MB | 55.8 MB |
| Events in quadrant A | 2,168,667 | 373,651 |
| Events in quadrant B | 2,482,978 | 374,669 |
| Events in quadrant C | 2,185,269 | 354,997 |
| Events in quadrant D | 2,335,448 | 348,015 |
| Mode M9 | |||
|---|---|---|---|
| Quadrant | BADHDUFLAG | Total packets | Discarded packets |
| A | 1 | 139664606456712 | 46 |
| B | 1 | -1 | -1 |
| C | 1 | -1 | -1 |
| D | 1 | -1 | -1 |
| Mode SS | |||
|---|---|---|---|
| Quadrant | BADHDUFLAG | Total packets | Discarded packets |
| A | 0 | 90 | 0 |
| B | 0 | 90 | 0 |
| C | 0 | 90 | 0 |
| D | 0 | 90 | 0 |
| Mode M0 | |||
|---|---|---|---|
| Quadrant | BADHDUFLAG | Total packets | Discarded packets |
| A | 0 | 9272 | 1 |
| B | 0 | 10161 | 1 |
| C | 0 | 9297 | 1 |
| D | 0 | 9952 | 1 |
| Quadrant | Total seconds | Saturated seconds | Saturation percentage |
|---|---|---|---|
| A | 4565 | 37 | 0.810515% |
| B | 4565 | 73 | 1.599124% |
| C | 4565 | 42 | 0.920044% |
| D | 4565 | 77 | 1.686747% |
Noise dominated data is calculated using 1-second bins in cleaned event files. If a bin has >2000 counts, and if more than 50% of those come from <1% of pixels, then it is considered to be noise-dominated and hence unusable.
| Quadrant | # 1 sec bins | Bins with >0 counts | Bins with >2000 counts | High rate bins dominated by noise | Noise dominated (total time) | Noise dominated (detector-on time) | Marked lightcurve |
|---|---|---|---|---|---|---|---|
| A | 4565 | 4565 | 0 | 0 | 0.00% | 0.00% | 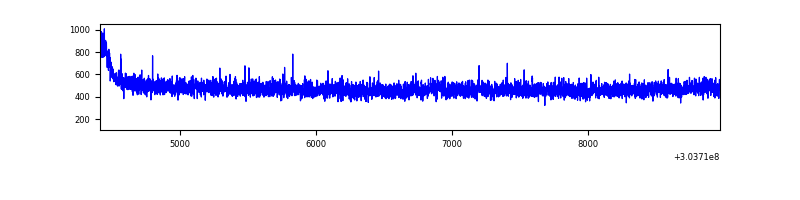 |
| B | 4565 | 4565 | 14 | 14 | 0.31% | 0.31% | 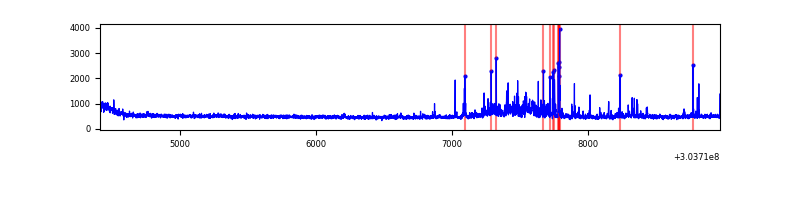 |
| C | 4565 | 4565 | 0 | 0 | 0.00% | 0.00% | 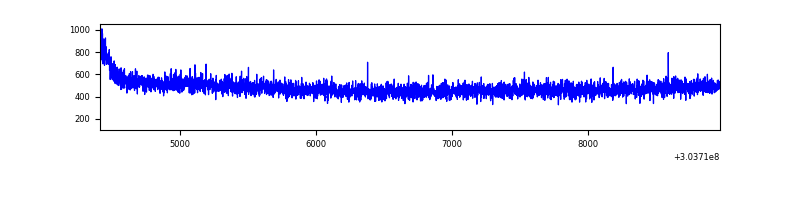 |
| D | 4565 | 4565 | 44 | 44 | 0.96% | 0.96% | 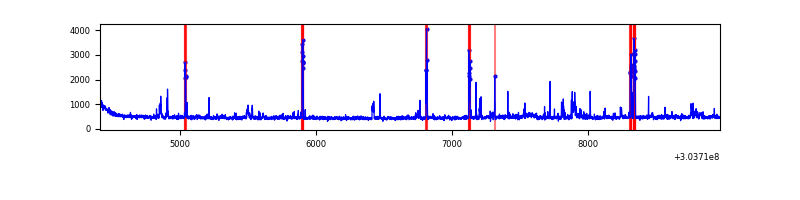 |
Top three noisy pixels from each quadrant. If the there are fewer than three noisy pixels in the level2.evt file, extra rows are filled as -1
| Pixel properties | Quadrant properties | ||||||
|---|---|---|---|---|---|---|---|
| Quadrant | DetID | PixID | Counts | Sigma | Mean | Median | Sigma |
| A | 0 | 226 | 4861 | 37.82 | 564 | 553 | 113.9 |
| A | 3 | 137 | 4483 | 34.51 | 564 | 553 | 113.9 |
| A | 12 | 194 | 3986 | 30.14 | 564 | 553 | 113.9 |
| B | 7 | 220 | 153056 | 1443.44 | 557 | 544 | 105.7 |
| B | 0 | 189 | 118724 | 1118.51 | 557 | 544 | 105.7 |
| B | 12 | 111 | 12087 | 109.25 | 557 | 544 | 105.7 |
| C | 14 | 238 | 84777 | 671.96 | 534 | 536 | 125.4 |
| C | 10 | 91 | 16067 | 123.89 | 534 | 536 | 125.4 |
| C | 7 | 247 | 3767 | 25.77 | 534 | 536 | 125.4 |
| D | 13 | 104 | 76566 | 592.86 | 538 | 524 | 128.3 |
| D | 1 | 52 | 71091 | 550.17 | 538 | 524 | 128.3 |
| D | 2 | 120 | 55622 | 429.57 | 538 | 524 | 128.3 |
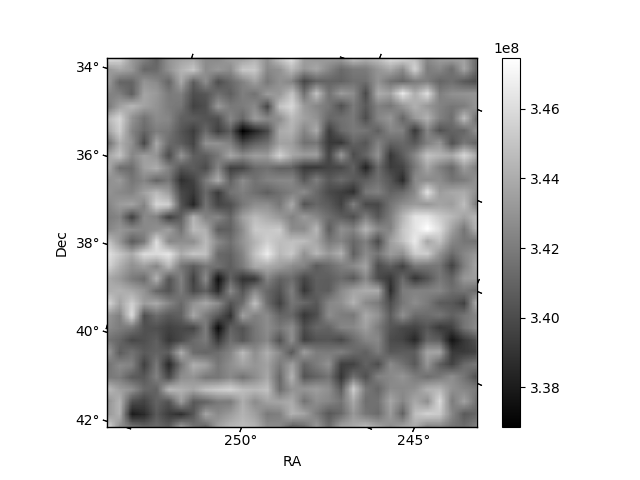
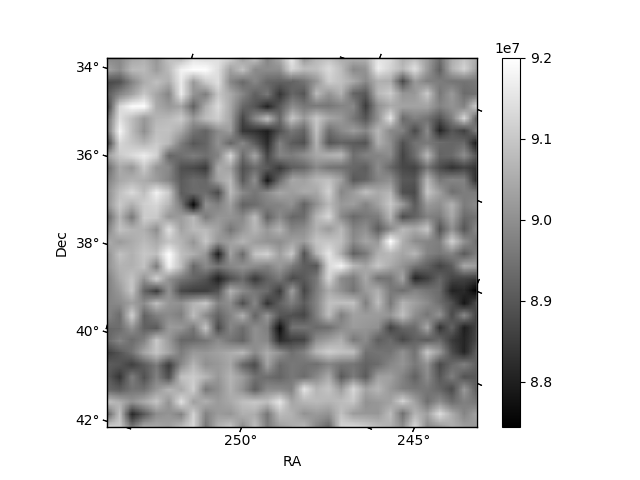
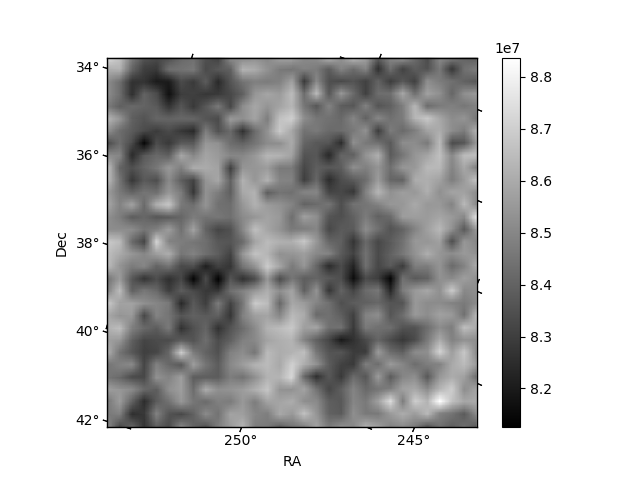
Histogram calculated using DETX and DETY for each event in the final _common_clean file
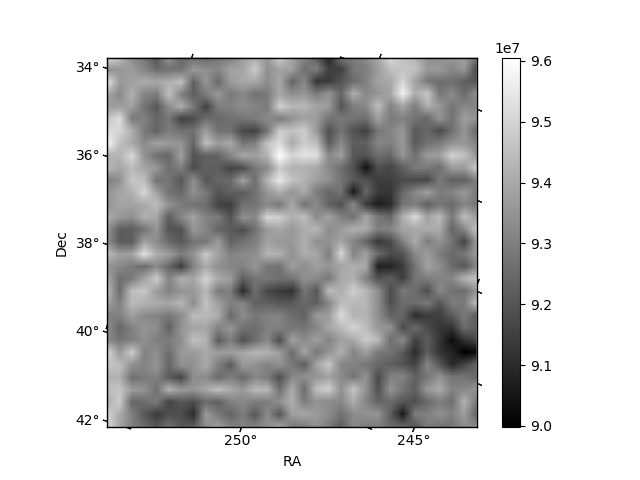
| Quadrant A | 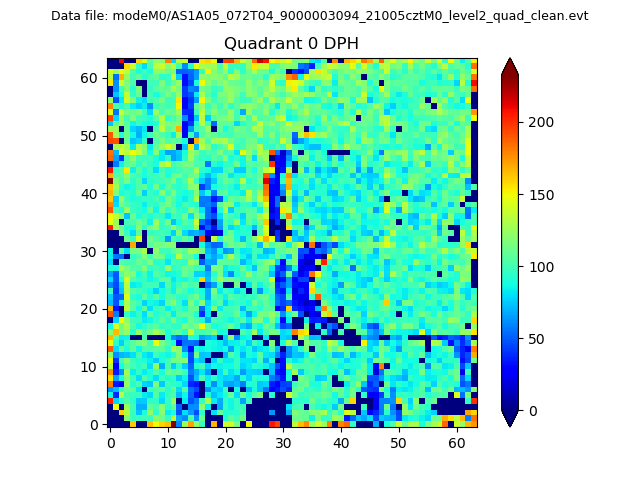 |
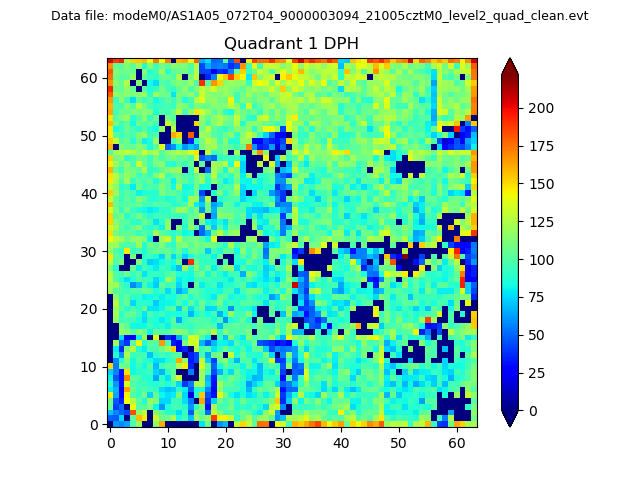 |
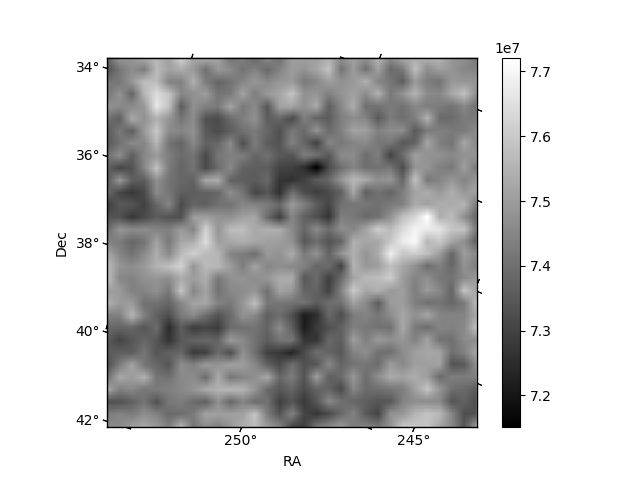
Quadrant B |
|---|---|---|---|
| Quadrant D | 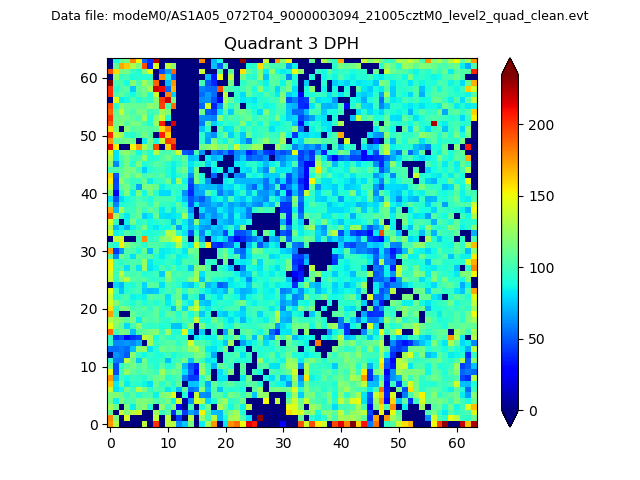 |
 |
Quadrant C |
| Plot type | Count rate plots | Images |
|---|---|---|
| Comparison with Poisson distribution Blue bars denote a histogram of data divided into 1 sec bins. Red curve is a Poisson curve with rate = median count rate of data. |
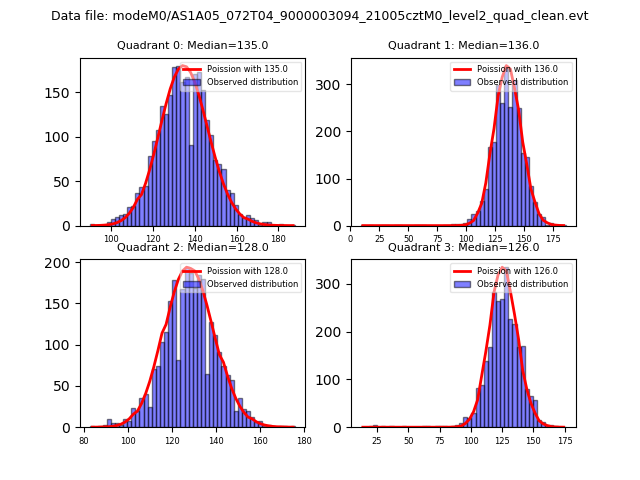 |
 |
| Quadrant-wise count rates Data is divided into 100 sec bins |
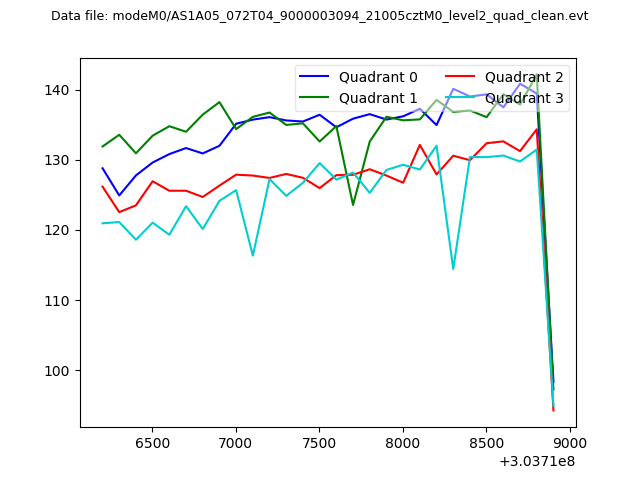 |
|
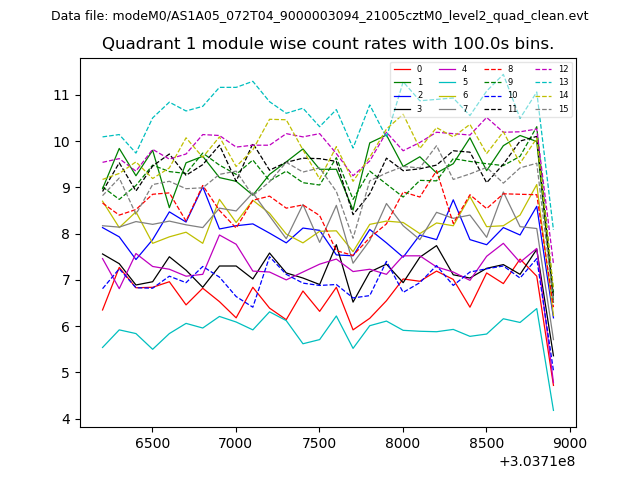
| Module-wise count rates for Quadrant A Data is divided into 100 sec bins |
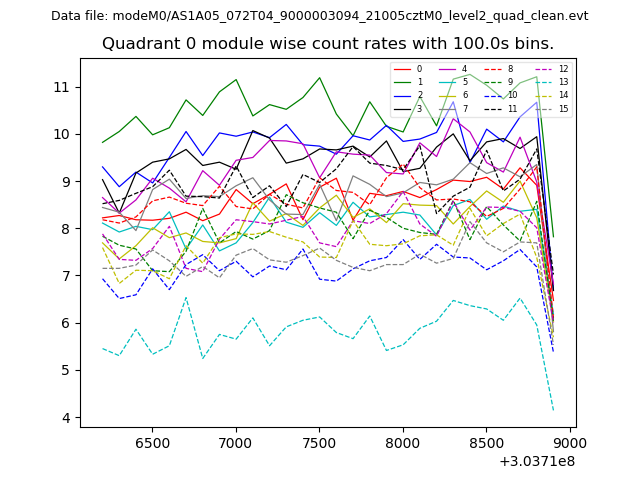 |
 |
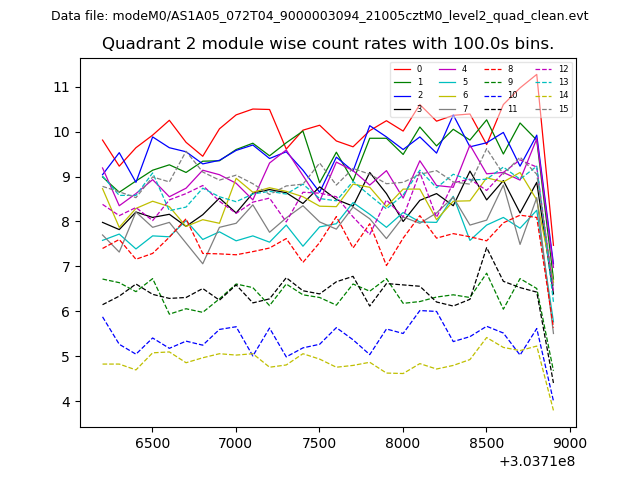
| Module-wise count rates for Quadrant B Data is divided into 100 sec bins |
 |
 |
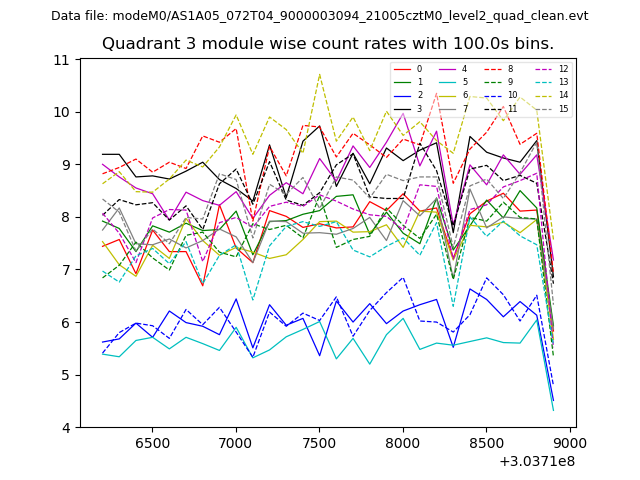
| Module-wise count rates for Quadrant C Data is divided into 100 sec bins |
 |
 |
| Module-wise count rates for Quadrant D Data is divided into 100 sec bins |
 |
 |
| Parameter | Plot |
|---|---|
| CZT HV Monitor | 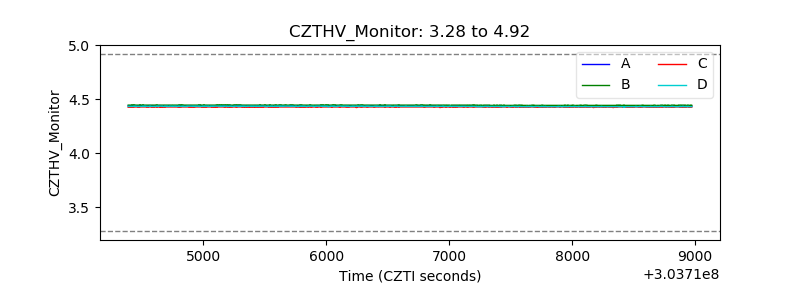 |
| D_VDD |  |
| Temperature 1 | 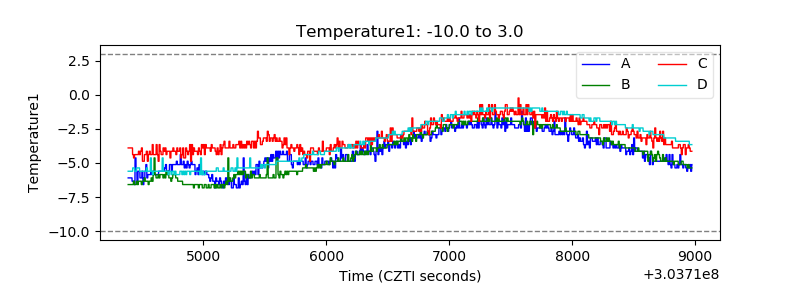 |
| Veto HV Monitor | 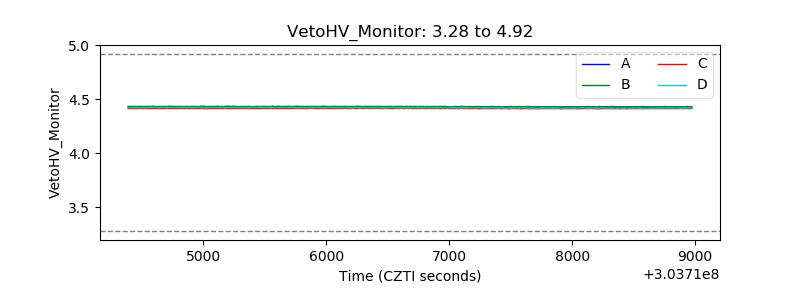 |
| Veto LLD | 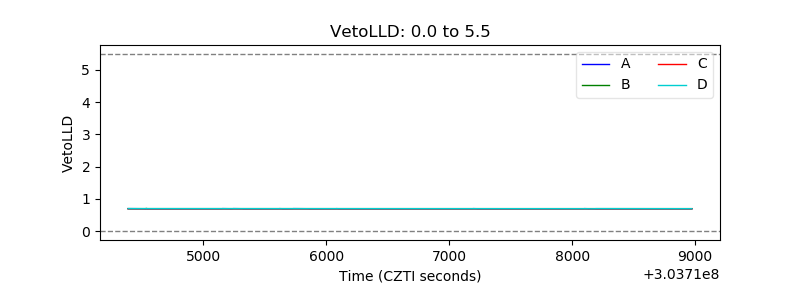 |
| Alpha Counter | 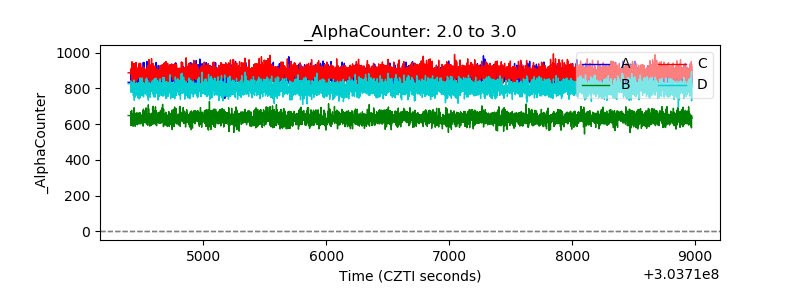 |
| _CPM_Rate | 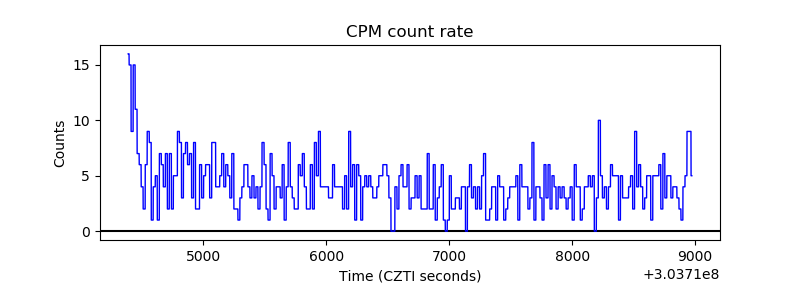 |
| CZT Counter |  |
| +2.5 Volts monitor |  |
| +5 Volts monitor |  |
| _ROLL_ROT | 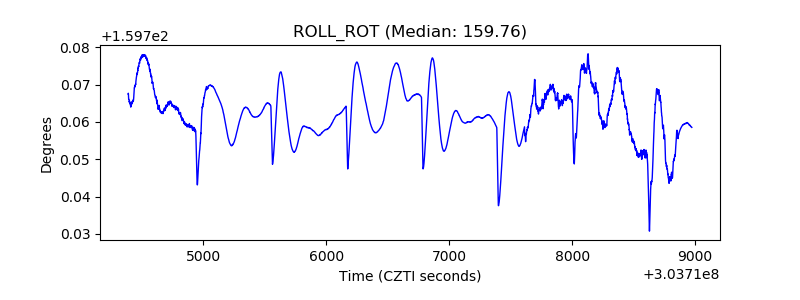 |
| _Roll_DEC | 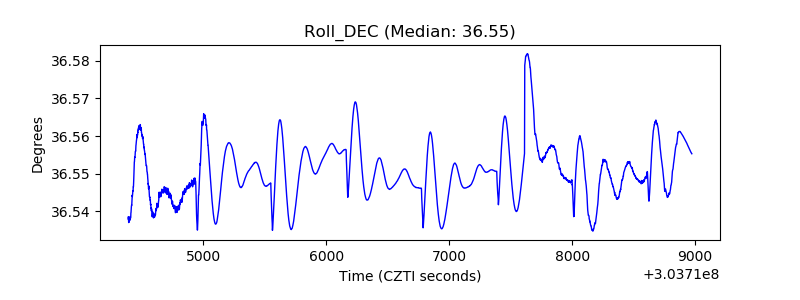 |
| _Roll_RA |  |
| Veto Counter | 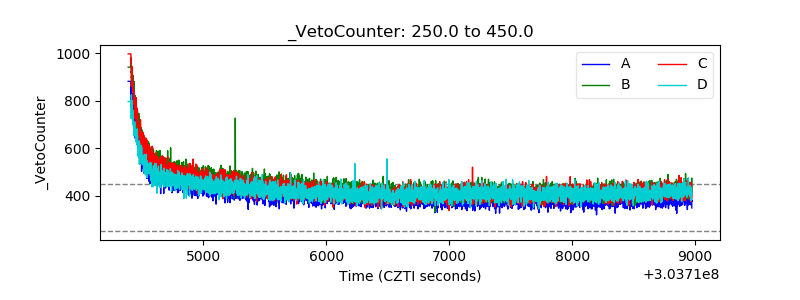 |