| Param | Original file | Final file |
|---|---|---|
| Filename | modeM0/AS1T03_133T01_9000003092cztM0_level2.fits | modeM0/AS1T03_133T01_9000003092cztM0_level2_quad_clean.evt |
| Size (bytes) | 374,296,320 | 351,593,280 |
| Size | 357.0 MB | 335.3 MB |
| Events in quadrant A | 2,281,954 | 2,089,796 |
| Events in quadrant B | 2,186,250 | 2,075,184 |
| Events in quadrant C | 2,248,292 | 2,014,322 |
| Events in quadrant D | 1,908,686 | 1,758,519 |
| Mode M0 | |||
|---|---|---|---|
| Quadrant | BADHDUFLAG | Total packets | Discarded packets |
| A | 0 | 81462 | 0 |
| B | 0 | 86417 | 0 |
| C | 0 | 81013 | 0 |
| D | 0 | 104475 | 0 |
| Mode M9 | |||
|---|---|---|---|
| Quadrant | BADHDUFLAG | Total packets | Discarded packets |
| A | 0 | 49 | 0 |
| B | 0 | 49 | 0 |
| C | 0 | 49 | 0 |
| D | 0 | 49 | 0 |
| Mode SS | |||
|---|---|---|---|
| Quadrant | BADHDUFLAG | Total packets | Discarded packets |
| A | 0 | 800 | 0 |
| B | 0 | 800 | 0 |
| C | 0 | 800 | 0 |
| D | 0 | 800 | 0 |
| Quadrant | Total seconds | Saturated seconds | Saturation percentage |
|---|---|---|---|
| A | 39477 | 530 | 1.342554% |
| B | 39477 | 850 | 2.153152% |
| C | 39477 | 584 | 1.479342% |
| D | 39477 | 2045 | 5.180232% |
Noise dominated data is calculated using 1-second bins in cleaned event files. If a bin has >2000 counts, and if more than 50% of those come from <1% of pixels, then it is considered to be noise-dominated and hence unusable.
| Quadrant | # 1 sec bins | Bins with >0 counts | Bins with >2000 counts | High rate bins dominated by noise | Noise dominated (total time) | Noise dominated (detector-on time) | Marked lightcurve |
|---|---|---|---|---|---|---|---|
| A | 44197 | 39474 | 0 | 0 | 0.00% | 0.00% | 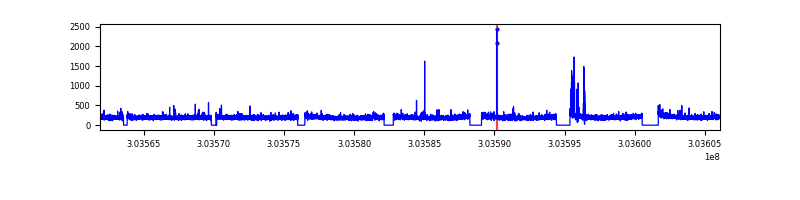 |
| B | 44197 | 39477 | 0 | 0 | 0.00% | 0.00% | 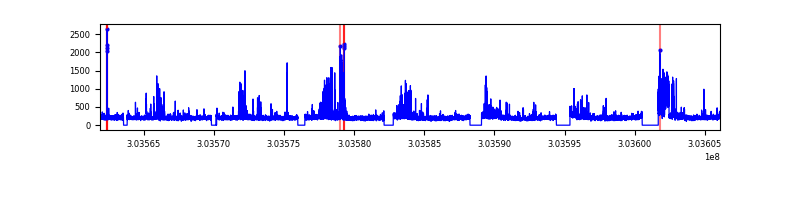 |
| C | 44197 | 39477 | 0 | 0 | 0.00% | 0.00% | 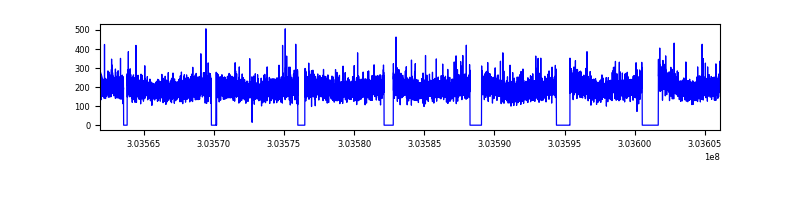 |
| D | 44197 | 39447 | 0 | 0 | 0.00% | 0.00% | 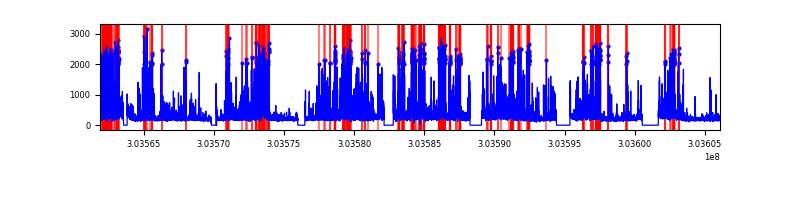 |
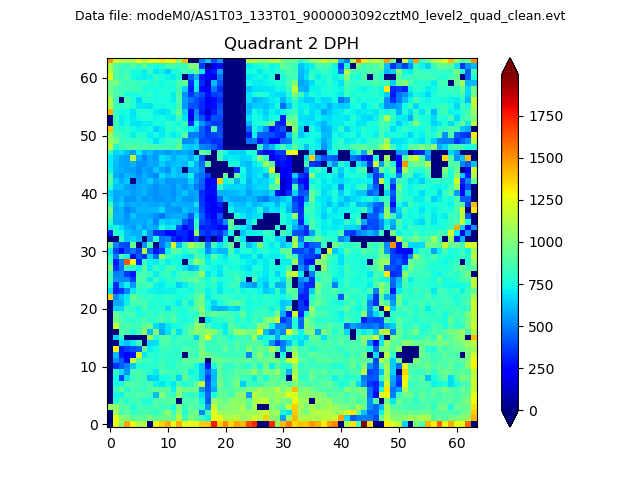
Top three noisy pixels from each quadrant. If the there are fewer than three noisy pixels in the level2.evt file, extra rows are filled as -1
| Pixel properties | Quadrant properties | ||||||
|---|---|---|---|---|---|---|---|
| Quadrant | DetID | PixID | Counts | Sigma | Mean | Median | Sigma |
| A | 0 | 29 | 2164 | 10.81 | 593 | 554 | 148.9 |
| A | 7 | 110 | 1766 | 8.14 | 593 | 554 | 148.9 |
| A | 9 | 19 | 1754 | 8.06 | 593 | 554 | 148.9 |
| B | 2 | 9 | 1752 | 10.36 | 577 | 548 | 116.2 |
| B | 2 | 8 | 1495 | 8.15 | 577 | 548 | 116.2 |
| B | 14 | 254 | 1453 | 7.79 | 577 | 548 | 116.2 |
| C | 1 | 80 | 1764 | 7.96 | 592 | 553 | 152.2 |
| C | 1 | 81 | 1719 | 7.66 | 592 | 553 | 152.2 |
| C | 2 | 191 | 1581 | 6.75 | 592 | 553 | 152.2 |
| D | 3 | 14 | 1427 | 6.36 | 545 | 496 | 146.4 |
| D | 7 | 3 | 1372 | 5.98 | 545 | 496 | 146.4 |
| D | 10 | 189 | 1347 | 5.81 | 545 | 496 | 146.4 |
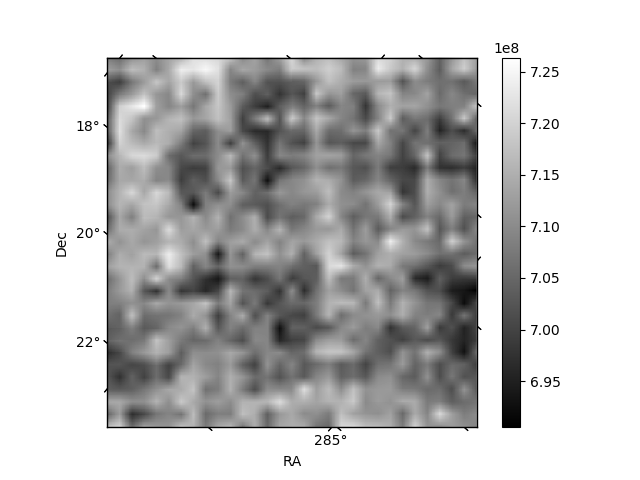
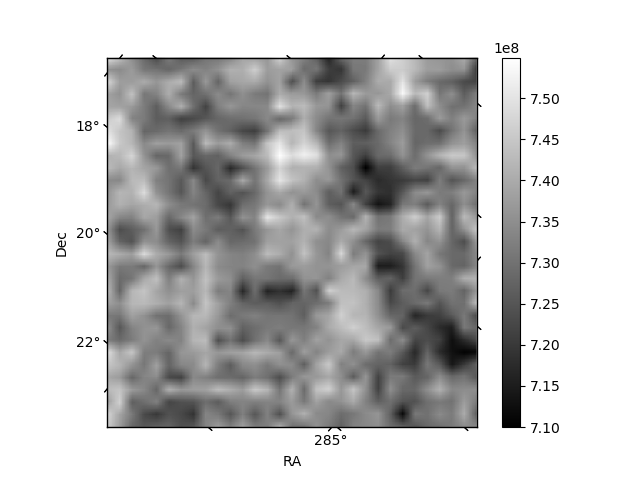
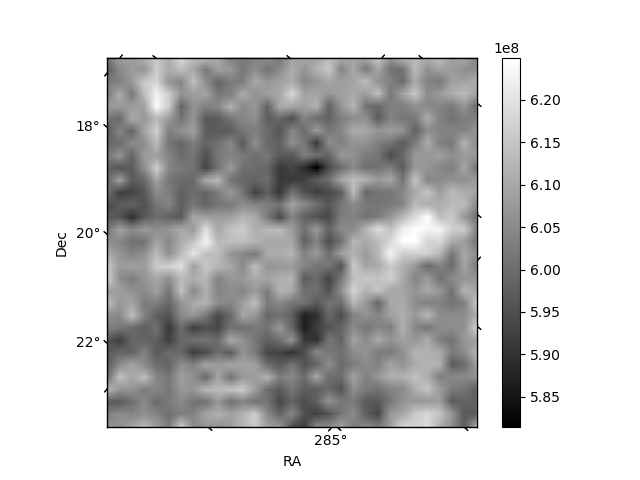
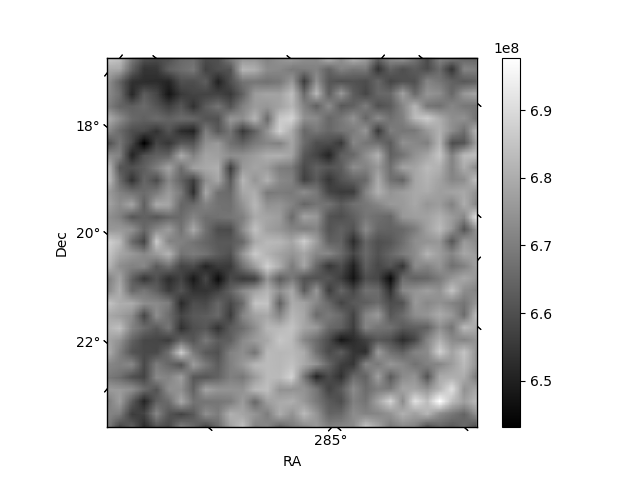
Histogram calculated using DETX and DETY for each event in the final _common_clean file
| Quadrant A | 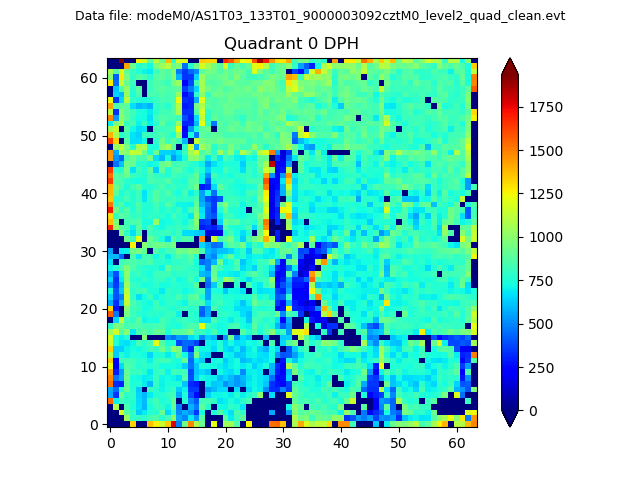 |
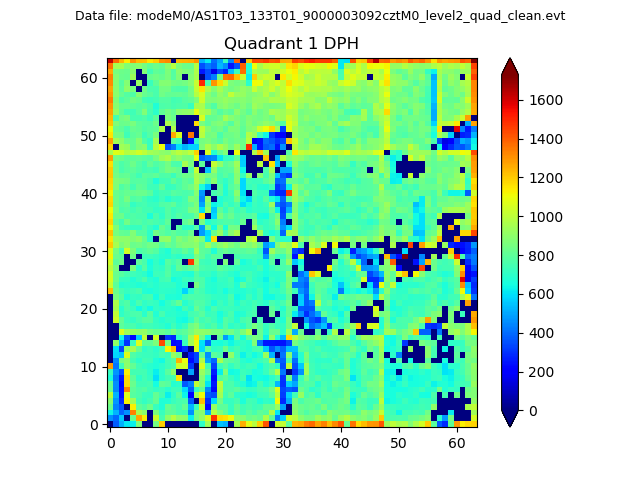 |
Quadrant B |
|---|---|---|---|
| Quadrant D | 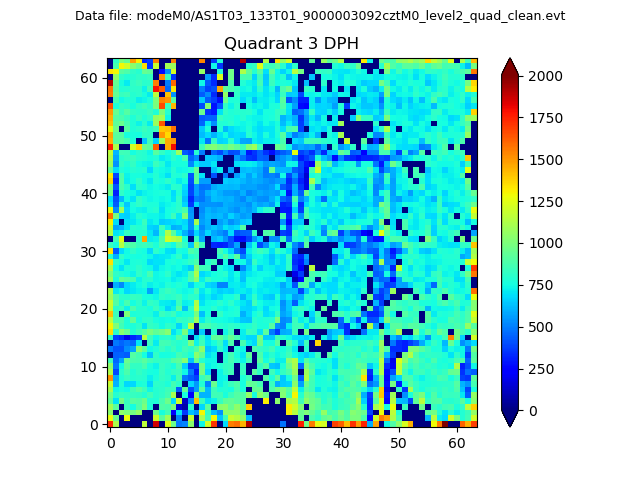 |
 |
Quadrant C |
| Plot type | Count rate plots | Images |
|---|---|---|
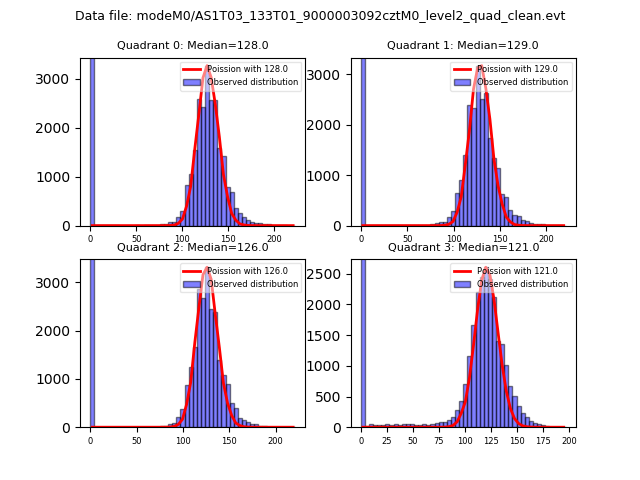
| Comparison with Poisson distribution Blue bars denote a histogram of data divided into 1 sec bins. Red curve is a Poisson curve with rate = median count rate of data. |
 |
 |
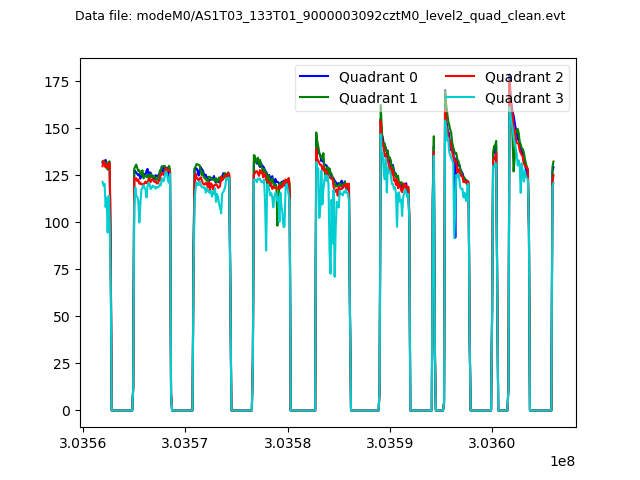
| Quadrant-wise count rates Data is divided into 100 sec bins |
 |
|
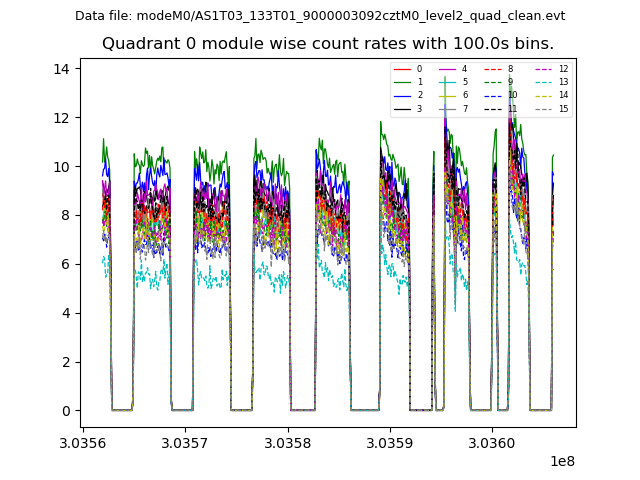
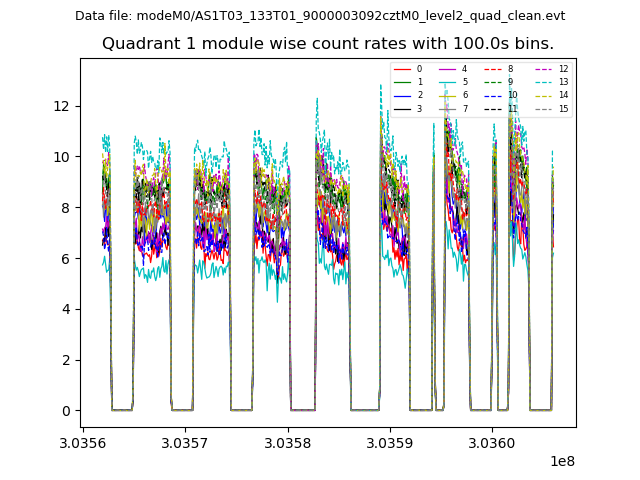
| Module-wise count rates for Quadrant A Data is divided into 100 sec bins |
 |
 |
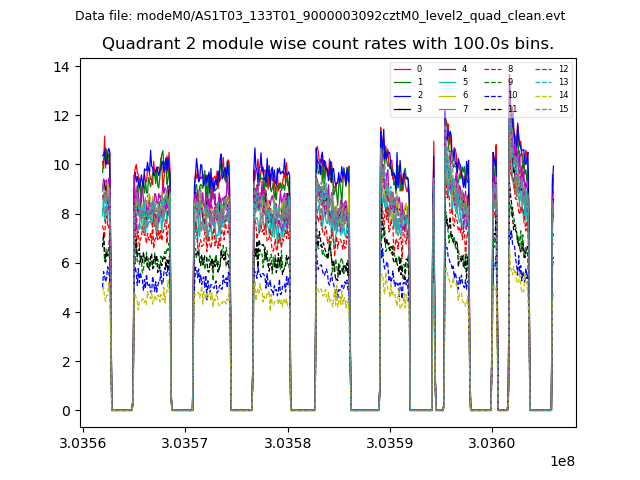
| Module-wise count rates for Quadrant B Data is divided into 100 sec bins |
 |
 |
| Module-wise count rates for Quadrant C Data is divided into 100 sec bins |
 |
 |
| Module-wise count rates for Quadrant D Data is divided into 100 sec bins |
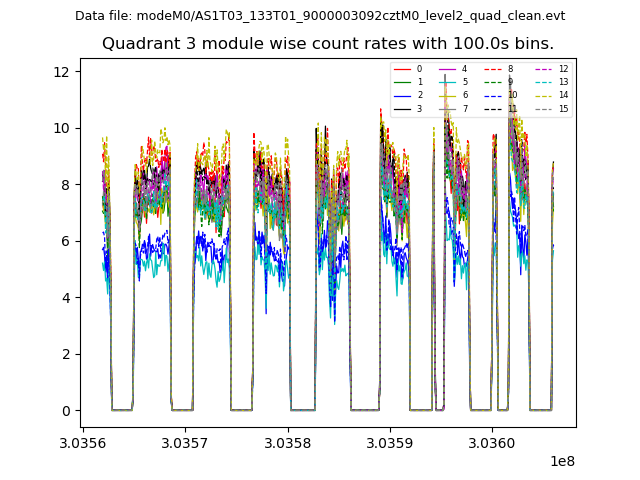 |
 |
| Parameter | Plot |
|---|---|
| CZT HV Monitor | 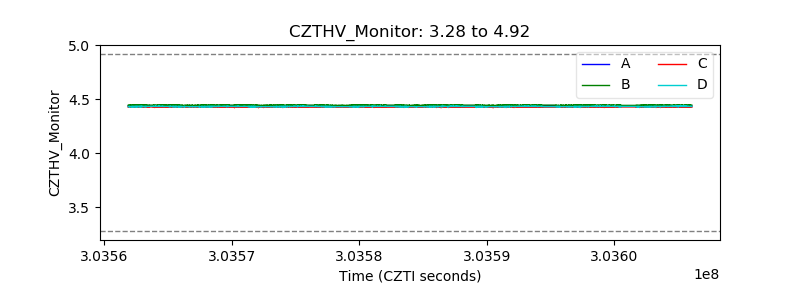 |
| D_VDD | 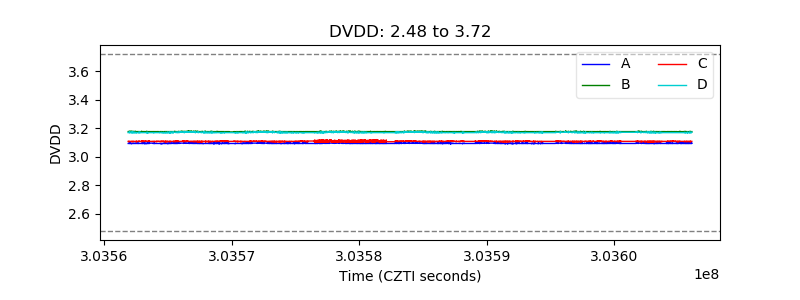 |
| Temperature 1 | 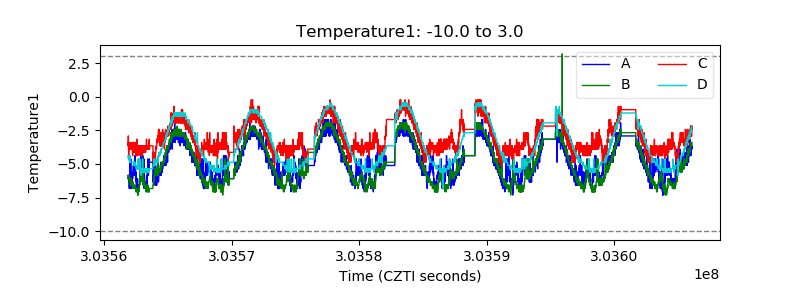 |
| Veto HV Monitor | 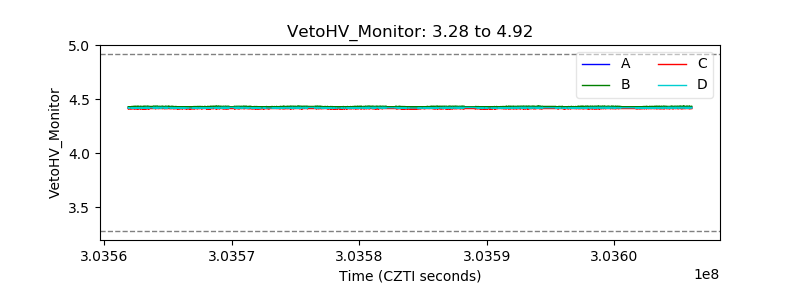 |
| Veto LLD | 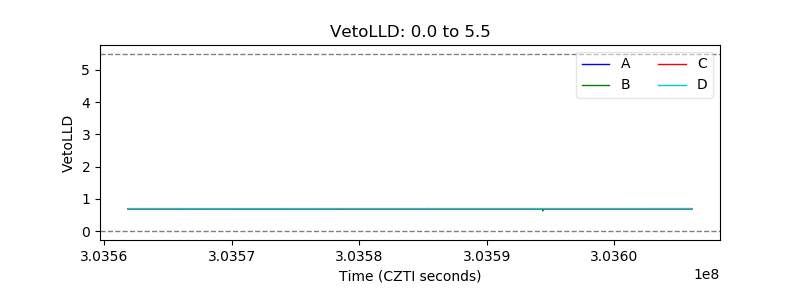 |
| Alpha Counter | 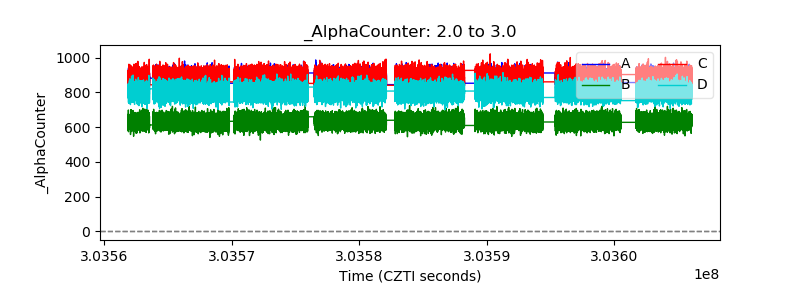 |
| _CPM_Rate | 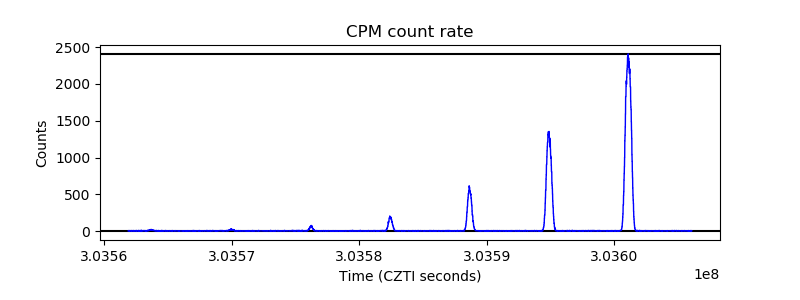 |
| CZT Counter | 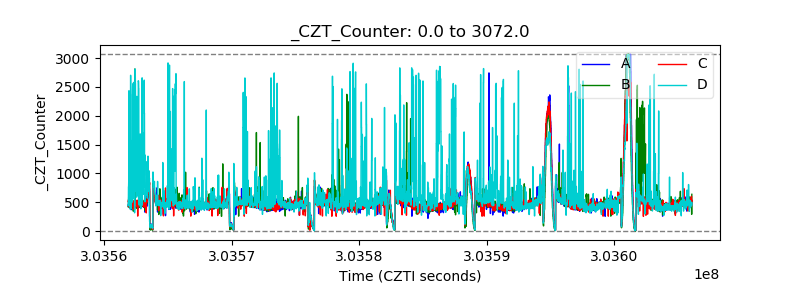 |
| +2.5 Volts monitor | 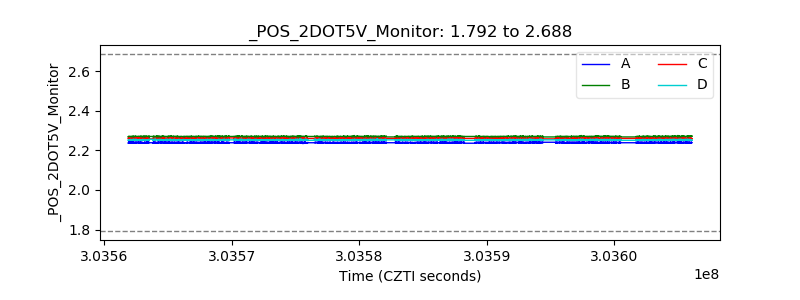 |
| +5 Volts monitor | 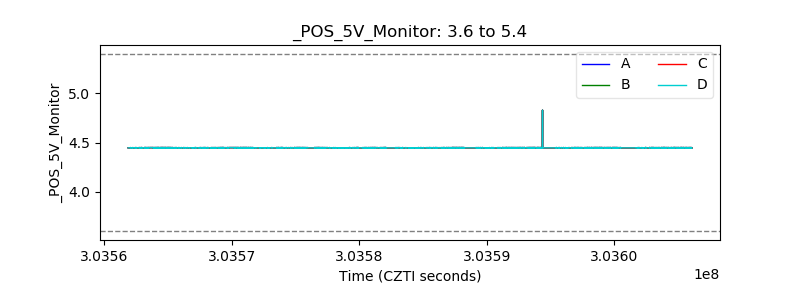 |
| _ROLL_ROT | 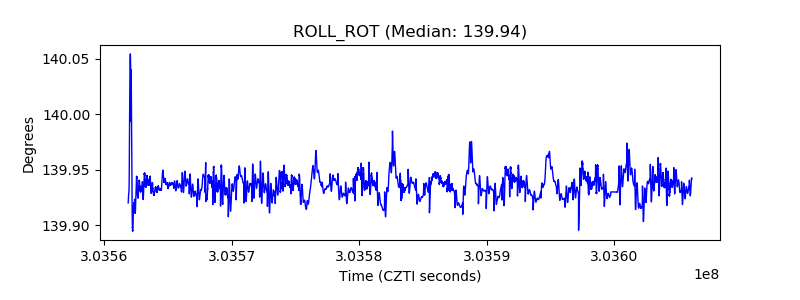 |
| _Roll_DEC | 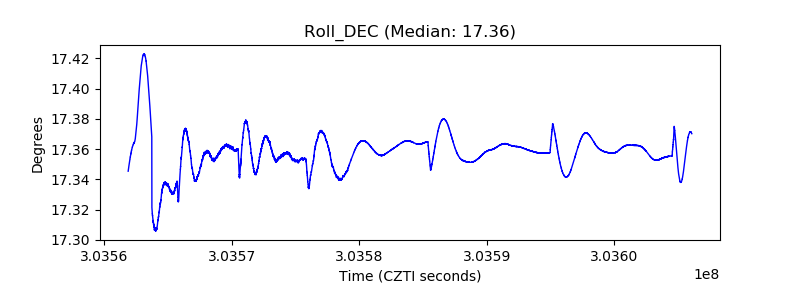 |
| _Roll_RA | 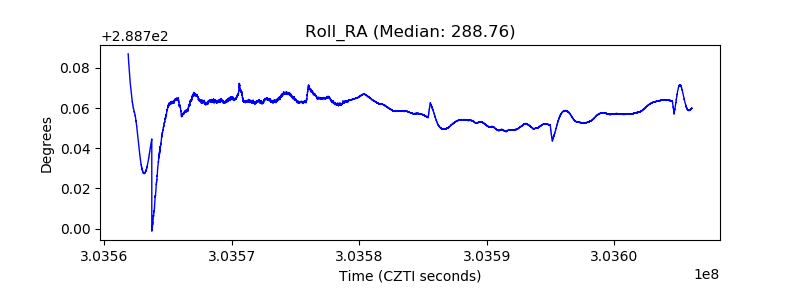 |
| Veto Counter | 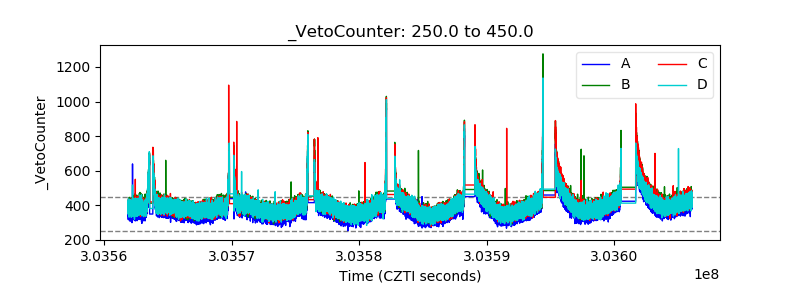 |