| Param | Original file | Final file |
|---|---|---|
| Filename | modeM0/AS1T03_133T01_9000003092_20978cztM0_level2.evt | modeM0/AS1T03_133T01_9000003092_20978cztM0_level2_quad_clean.evt |
| Size (bytes) | 268,364,160 | 29,793,600 |
| Size | 255.9 MB | 28.4 MB |
| Events in quadrant A | 1,623,902 | 172,556 |
| Events in quadrant B | 1,698,186 | 174,755 |
| Events in quadrant C | 1,660,704 | 170,301 |
| Events in quadrant D | 2,918,968 | 149,726 |
| Mode M0 | |||
|---|---|---|---|
| Quadrant | BADHDUFLAG | Total packets | Discarded packets |
| A | 0 | 6916 | 1 |
| B | 0 | 7033 | 1 |
| C | 0 | 6918 | 1 |
| D | 0 | 10856 | 1 |
| Mode M9 | |||
|---|---|---|---|
| Quadrant | BADHDUFLAG | Total packets | Discarded packets |
| A | 0 | 3 | 0 |
| B | 0 | 3 | 0 |
| C | 0 | 3 | 0 |
| D | 0 | 3 | 0 |
| Mode SS | |||
|---|---|---|---|
| Quadrant | BADHDUFLAG | Total packets | Discarded packets |
| A | 0 | 66 | 0 |
| B | 0 | 66 | 0 |
| C | 0 | 66 | 0 |
| D | 0 | 66 | 0 |
| Quadrant | Total seconds | Saturated seconds | Saturation percentage |
|---|---|---|---|
| A | 3302 | 147 | 4.451847% |
| B | 3302 | 165 | 4.996972% |
| C | 3302 | 139 | 4.209570% |
| D | 3302 | 451 | 13.658389% |
Noise dominated data is calculated using 1-second bins in cleaned event files. If a bin has >2000 counts, and if more than 50% of those come from <1% of pixels, then it is considered to be noise-dominated and hence unusable.
| Quadrant | # 1 sec bins | Bins with >0 counts | Bins with >2000 counts | High rate bins dominated by noise | Noise dominated (total time) | Noise dominated (detector-on time) | Marked lightcurve |
|---|---|---|---|---|---|---|---|
| A | 3562 | 3303 | 0 | 0 | 0.00% | 0.00% | 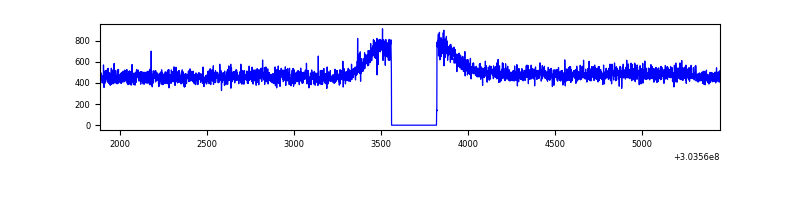 |
| B | 3562 | 3303 | 5 | 5 | 0.14% | 0.15% | 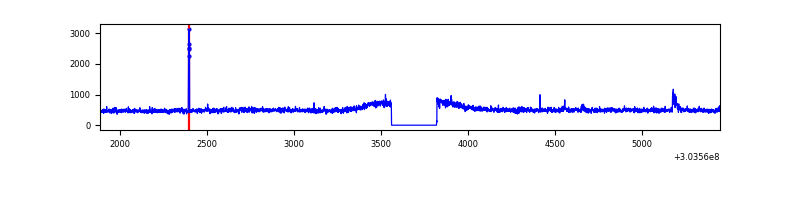 |
| C | 3562 | 3303 | 0 | 0 | 0.00% | 0.00% |  |
| D | 3562 | 3303 | 337 | 337 | 9.46% | 10.20% | 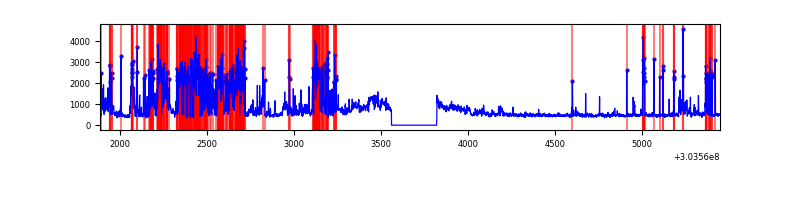 |
Top three noisy pixels from each quadrant. If the there are fewer than three noisy pixels in the level2.evt file, extra rows are filled as -1
| Pixel properties | Quadrant properties | ||||||
|---|---|---|---|---|---|---|---|
| Quadrant | DetID | PixID | Counts | Sigma | Mean | Median | Sigma |
| A | 3 | 137 | 3676 | 37.28 | 422 | 411 | 87.6 |
| A | 0 | 226 | 3539 | 35.71 | 422 | 411 | 87.6 |
| A | 12 | 194 | 2844 | 27.78 | 422 | 411 | 87.6 |
| B | 3 | 64 | 27729 | 327.62 | 423 | 410 | 83.4 |
| B | 12 | 111 | 10391 | 119.7 | 423 | 410 | 83.4 |
| B | 11 | 111 | 9408 | 107.91 | 423 | 410 | 83.4 |
| C | 14 | 238 | 61665 | 632.4 | 407 | 409 | 96.9 |
| C | 7 | 247 | 9891 | 97.89 | 407 | 409 | 96.9 |
| C | 13 | 61 | 2846 | 25.16 | 407 | 409 | 96.9 |
| D | 1 | 52 | 1352394 | 13869.69 | 396 | 384 | 97.5 |
| D | 9 | 1 | 57197 | 582.82 | 396 | 384 | 97.5 |
| D | 2 | 234 | 11240 | 111.37 | 396 | 384 | 97.5 |
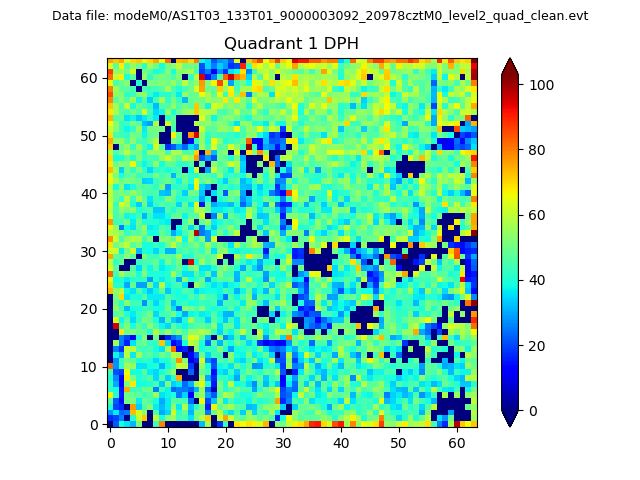
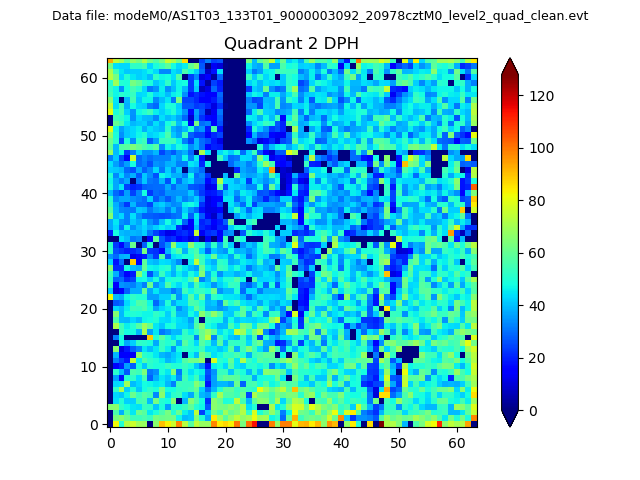
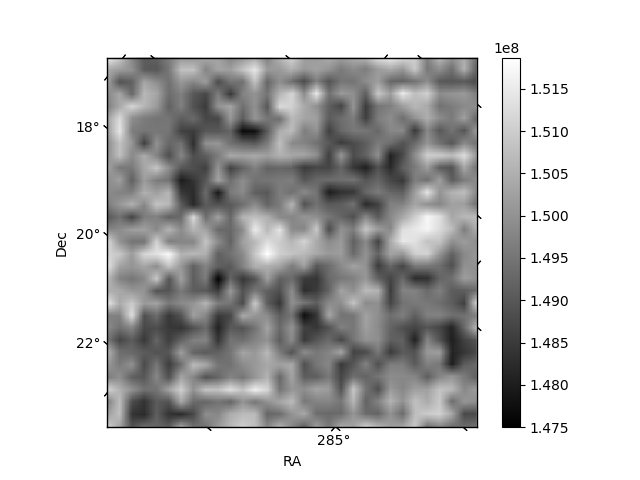
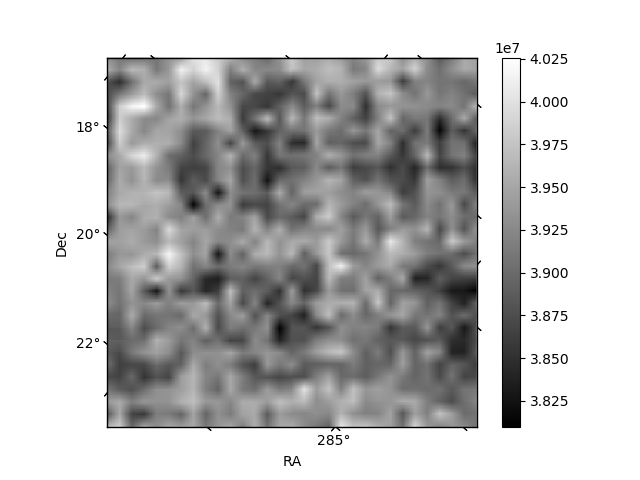
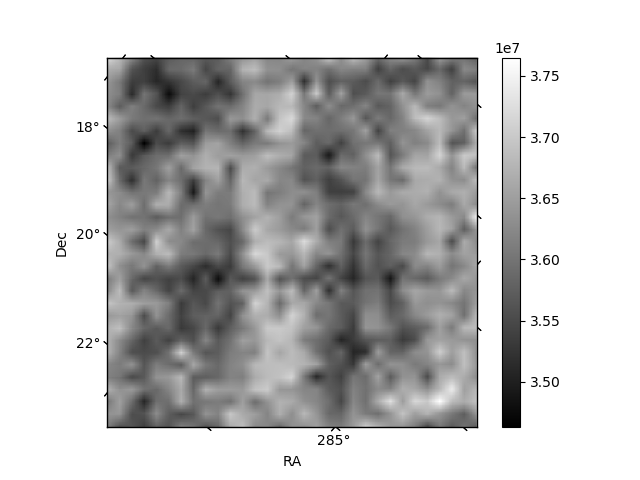
Histogram calculated using DETX and DETY for each event in the final _common_clean file
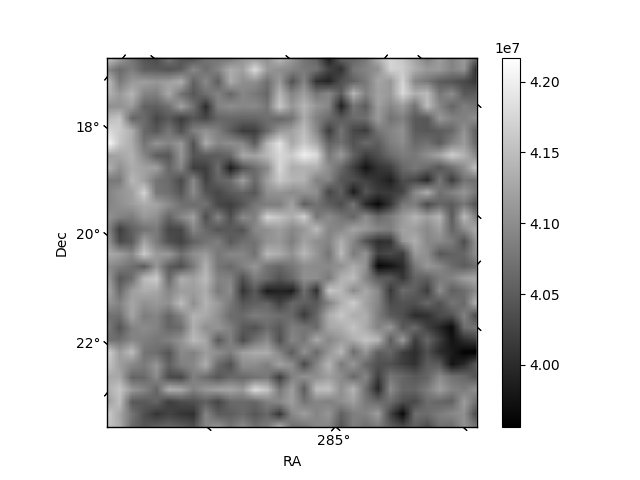
| Quadrant A | 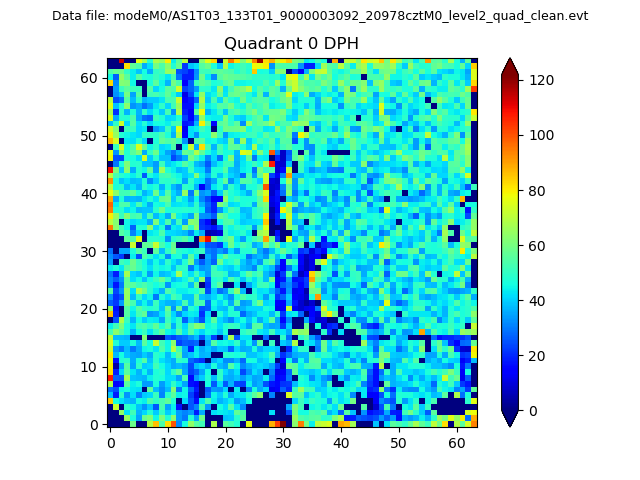 |
 |
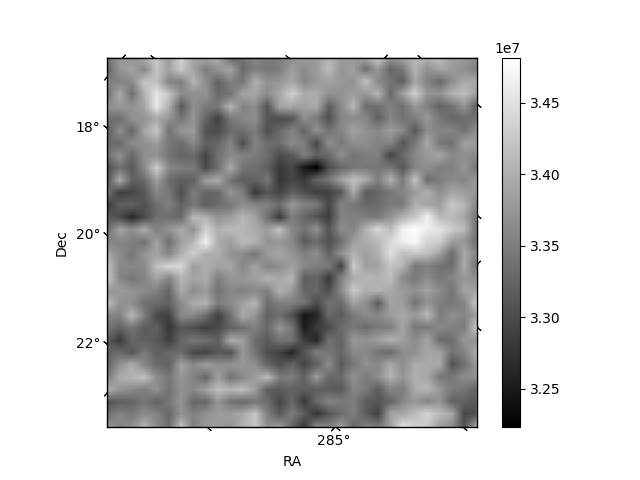
Quadrant B |
|---|---|---|---|
| Quadrant D | 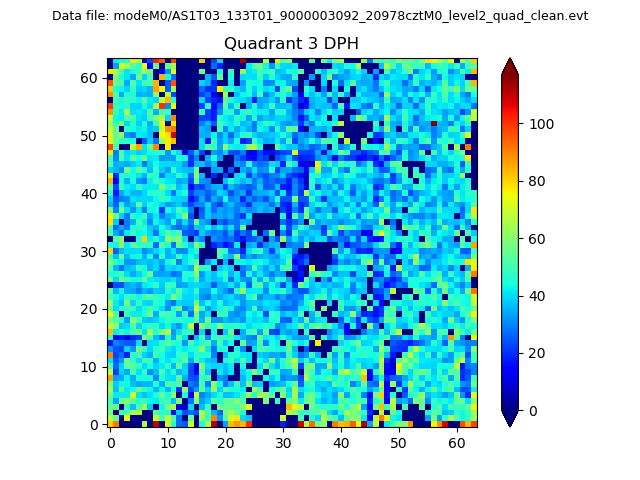 |
 |
Quadrant C |
| Plot type | Count rate plots | Images |
|---|---|---|
| Comparison with Poisson distribution Blue bars denote a histogram of data divided into 1 sec bins. Red curve is a Poisson curve with rate = median count rate of data. |
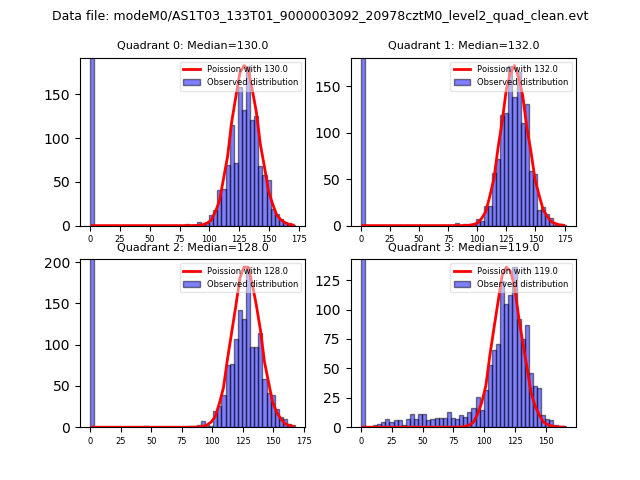 |
 |
| Quadrant-wise count rates Data is divided into 100 sec bins |
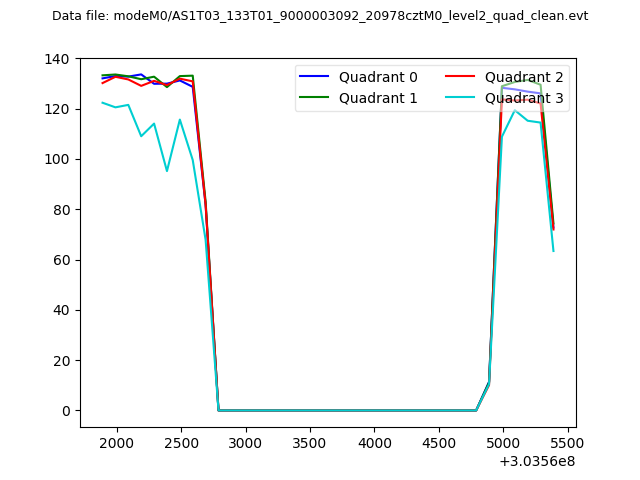 |
|
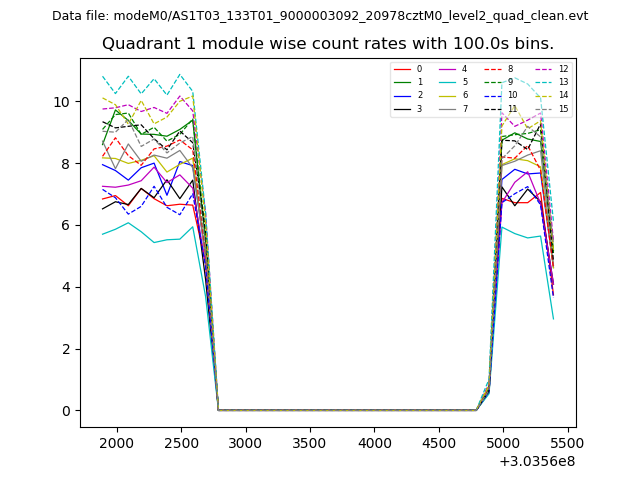
| Module-wise count rates for Quadrant A Data is divided into 100 sec bins |
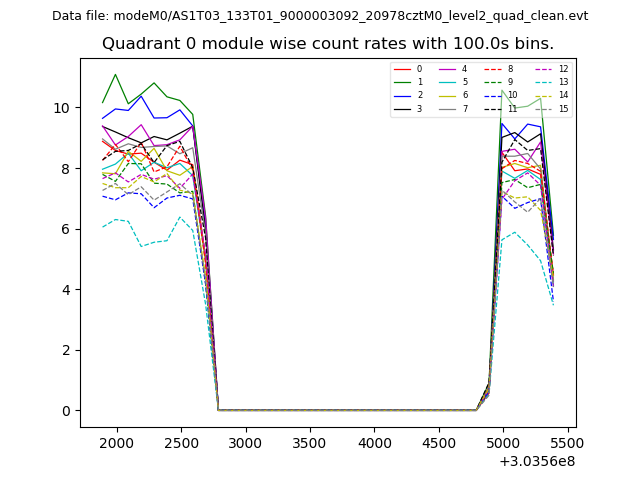 |
 |
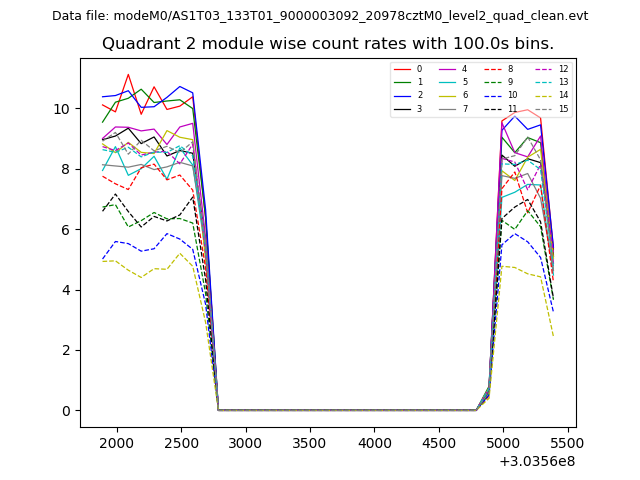
| Module-wise count rates for Quadrant B Data is divided into 100 sec bins |
 |
 |
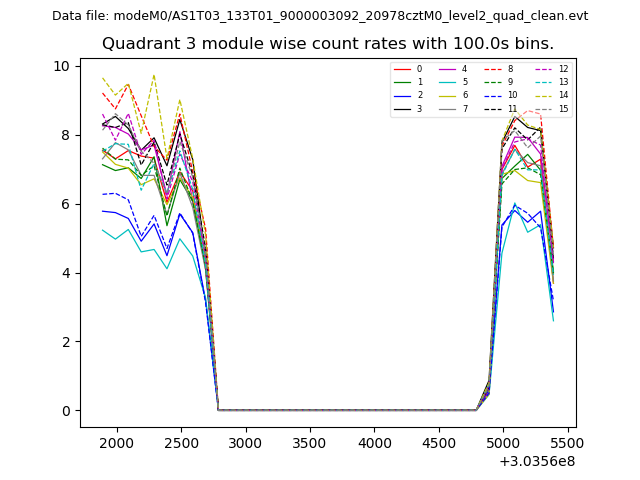
| Module-wise count rates for Quadrant C Data is divided into 100 sec bins |
 |
 |
| Module-wise count rates for Quadrant D Data is divided into 100 sec bins |
 |
 |
| Parameter | Plot |
|---|---|
| CZT HV Monitor | 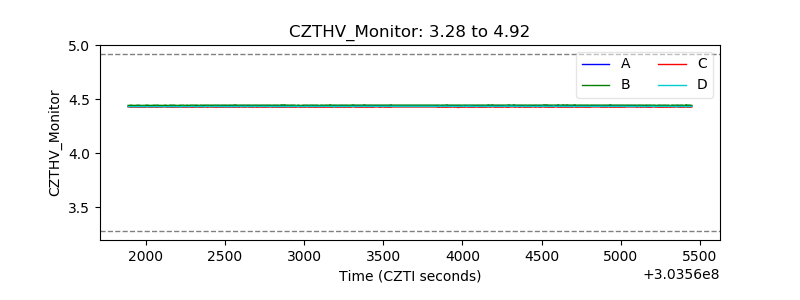 |
| D_VDD | 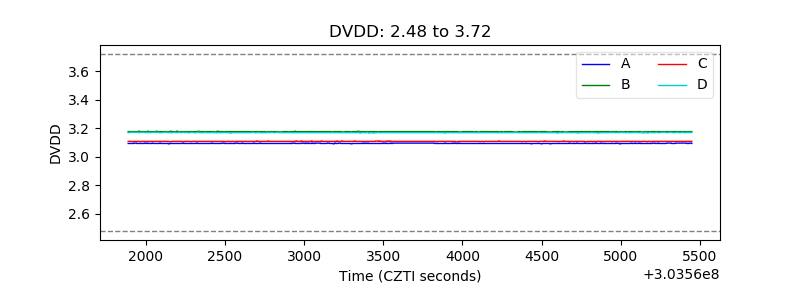 |
| Temperature 1 | 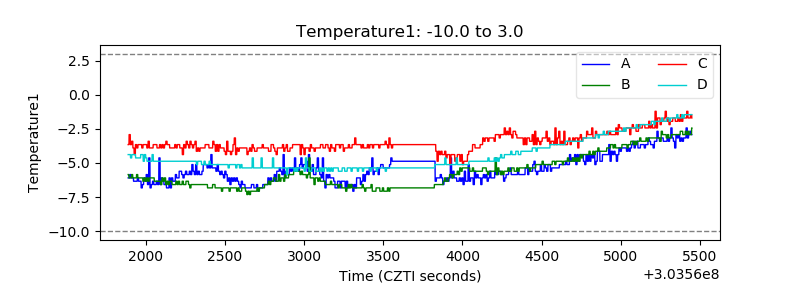 |
| Veto HV Monitor | 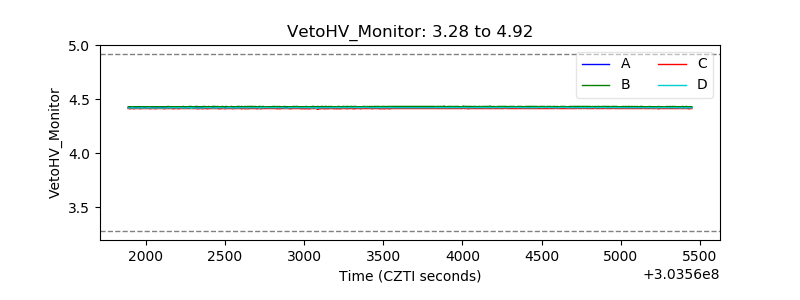 |
| Veto LLD | 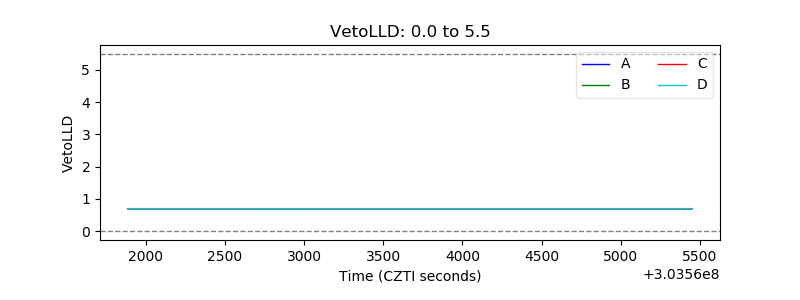 |
| Alpha Counter | 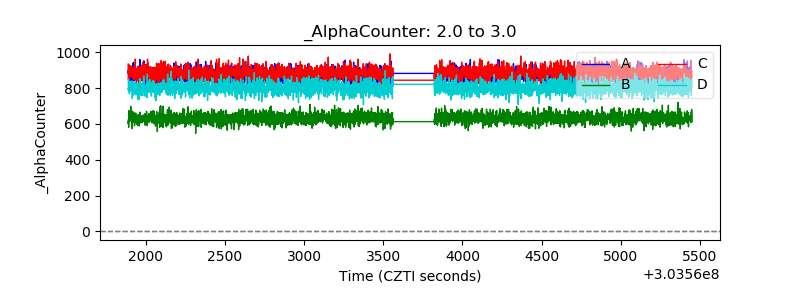 |
| _CPM_Rate | 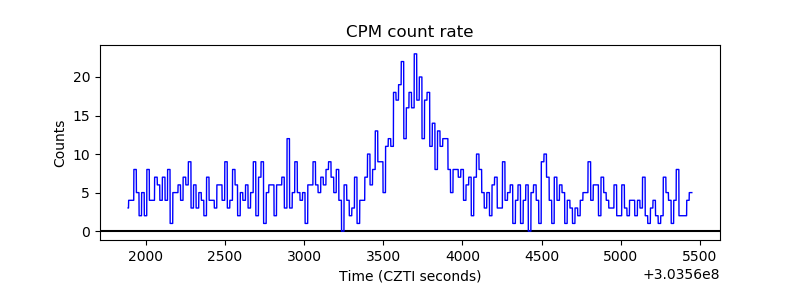 |
| CZT Counter | 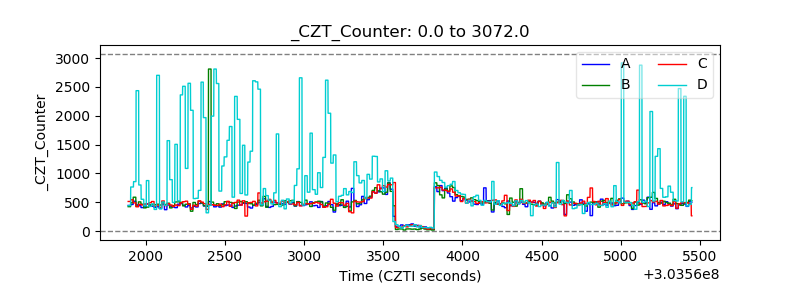 |
| +2.5 Volts monitor |  |
| +5 Volts monitor |  |
| _ROLL_ROT | 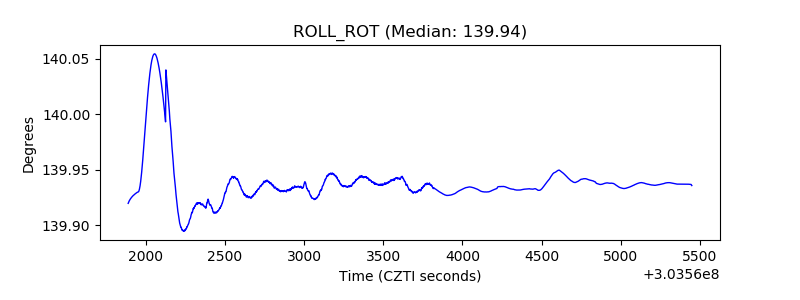 |
| _Roll_DEC | 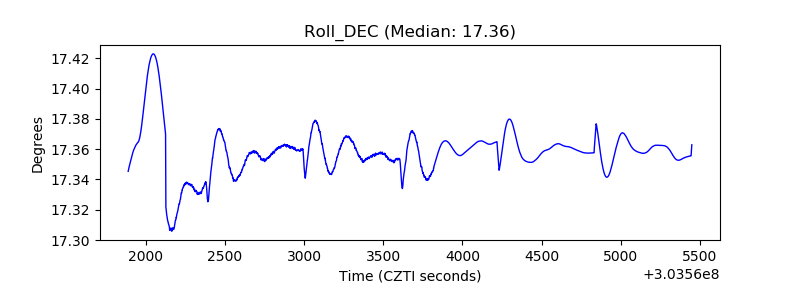 |
| _Roll_RA | 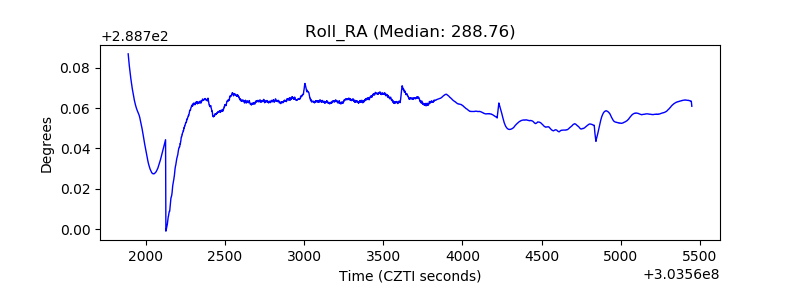 |
| Veto Counter | 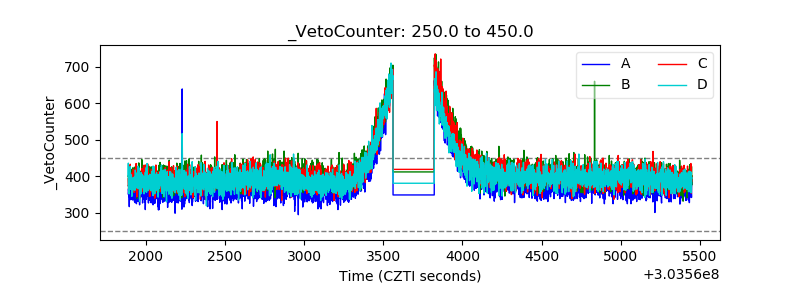 |