| Param | Original file | Final file |
|---|---|---|
| Filename | modeM0/AS1T03_133T01_9000003092_20979cztM0_level2.evt | modeM0/AS1T03_133T01_9000003092_20979cztM0_level2_quad_clean.evt |
| Size (bytes) | 521,046,720 | 91,944,000 |
| Size | 496.9 MB | 87.7 MB |
| Events in quadrant A | 3,600,205 | 576,768 |
| Events in quadrant B | 3,759,976 | 577,252 |
| Events in quadrant C | 3,648,735 | 560,719 |
| Events in quadrant D | 4,254,788 | 541,031 |
| Mode M0 | |||
|---|---|---|---|
| Quadrant | BADHDUFLAG | Total packets | Discarded packets |
| A | 0 | 15638 | 2 |
| B | 0 | 15909 | 2 |
| C | 0 | 15616 | 2 |
| D | 0 | 17640 | 2 |
| Mode M9 | |||
|---|---|---|---|
| Quadrant | BADHDUFLAG | Total packets | Discarded packets |
| A | 0 | 7 | 0 |
| B | 0 | 7 | 0 |
| C | 0 | 7 | 0 |
| D | 0 | 7 | 0 |
| Mode SS | |||
|---|---|---|---|
| Quadrant | BADHDUFLAG | Total packets | Discarded packets |
| A | 0 | 156 | 0 |
| B | 0 | 156 | 0 |
| C | 0 | 156 | 0 |
| D | 0 | 156 | 0 |
| Quadrant | Total seconds | Saturated seconds | Saturation percentage |
|---|---|---|---|
| A | 7606 | 169 | 2.221930% |
| B | 7605 | 180 | 2.366864% |
| C | 7605 | 185 | 2.432610% |
| D | 7606 | 275 | 3.615567% |
Noise dominated data is calculated using 1-second bins in cleaned event files. If a bin has >2000 counts, and if more than 50% of those come from <1% of pixels, then it is considered to be noise-dominated and hence unusable.
| Quadrant | # 1 sec bins | Bins with >0 counts | Bins with >2000 counts | High rate bins dominated by noise | Noise dominated (total time) | Noise dominated (detector-on time) | Marked lightcurve |
|---|---|---|---|---|---|---|---|
| A | 8221 | 7609 | 0 | 0 | 0.00% | 0.00% | 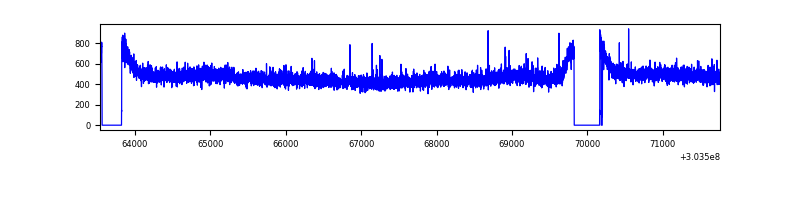 |
| B | 8220 | 7608 | 3 | 3 | 0.04% | 0.04% | 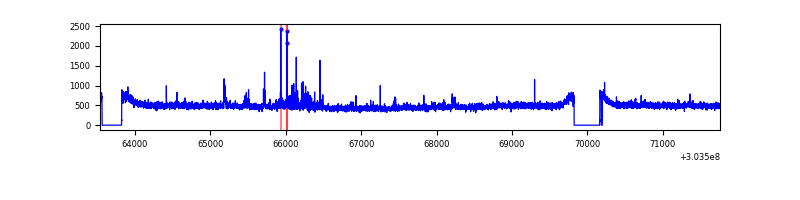 |
| C | 8220 | 7608 | 0 | 0 | 0.00% | 0.00% | 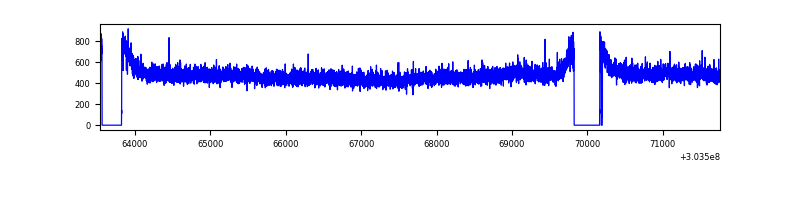 |
| D | 8221 | 7609 | 111 | 111 | 1.35% | 1.46% | 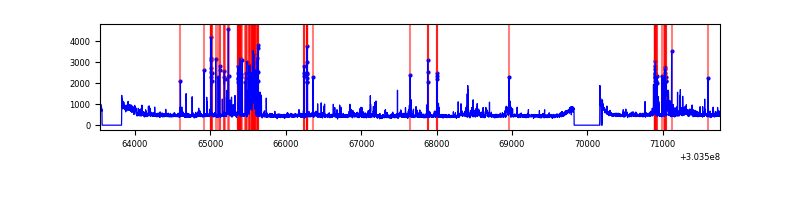 |
Top three noisy pixels from each quadrant. If the there are fewer than three noisy pixels in the level2.evt file, extra rows are filled as -1
| Pixel properties | Quadrant properties | ||||||
|---|---|---|---|---|---|---|---|
| Quadrant | DetID | PixID | Counts | Sigma | Mean | Median | Sigma |
| A | 3 | 137 | 7986 | 37.17 | 937 | 916 | 190.2 |
| A | 0 | 226 | 7913 | 36.79 | 937 | 916 | 190.2 |
| A | 12 | 194 | 6460 | 29.15 | 937 | 916 | 190.2 |
| B | 7 | 220 | 49675 | 270.19 | 930 | 904 | 180.5 |
| B | 3 | 64 | 23410 | 124.68 | 930 | 904 | 180.5 |
| B | 12 | 111 | 22358 | 118.86 | 930 | 904 | 180.5 |
| C | 14 | 238 | 140103 | 661.58 | 898 | 902 | 210.4 |
| C | 7 | 247 | 8461 | 35.93 | 898 | 902 | 210.4 |
| C | 13 | 61 | 6113 | 24.77 | 898 | 902 | 210.4 |
| D | 1 | 52 | 532812 | 2397.89 | 906 | 878 | 221.8 |
| D | 9 | 1 | 212441 | 953.7 | 906 | 878 | 221.8 |
| D | 7 | 223 | 42293 | 186.69 | 906 | 878 | 221.8 |
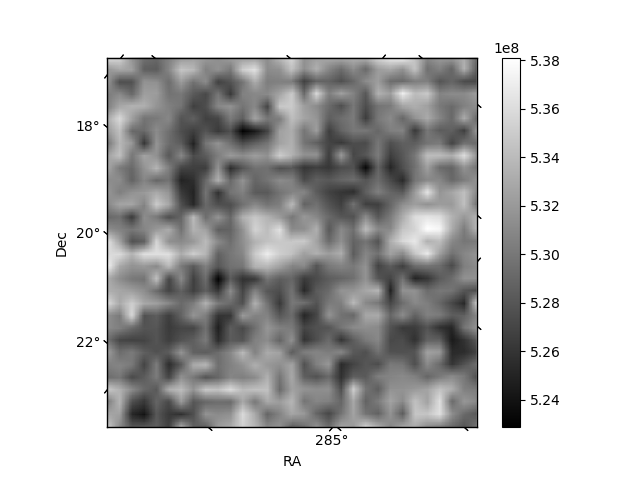
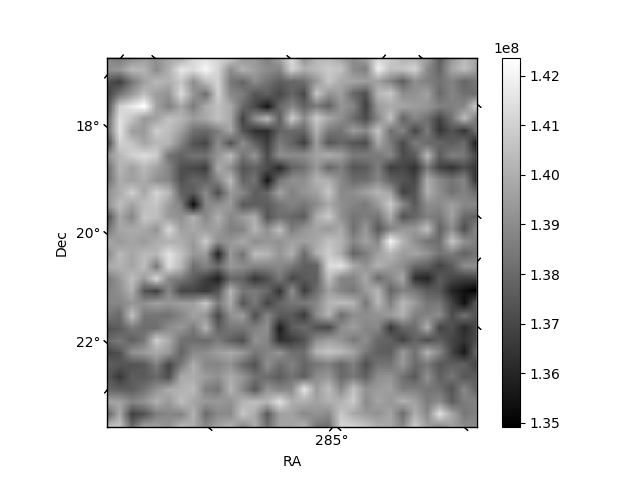
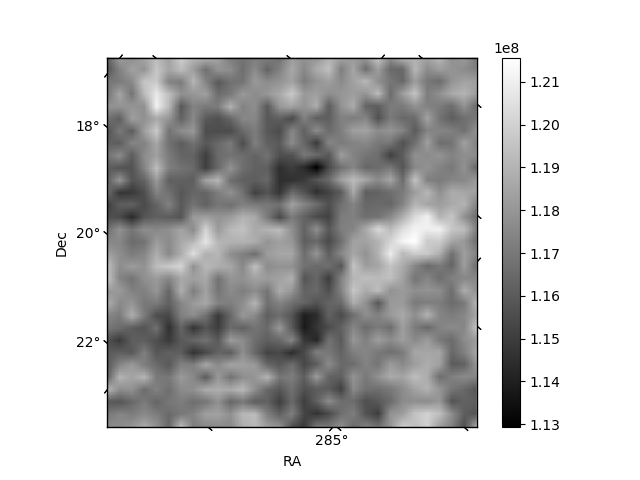
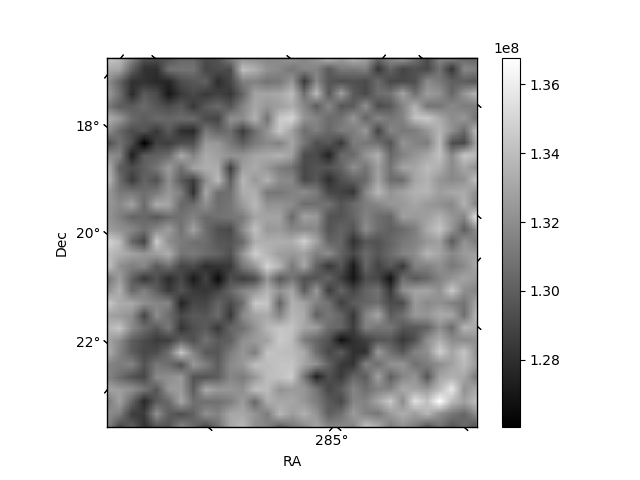
Histogram calculated using DETX and DETY for each event in the final _common_clean file
| Quadrant A | 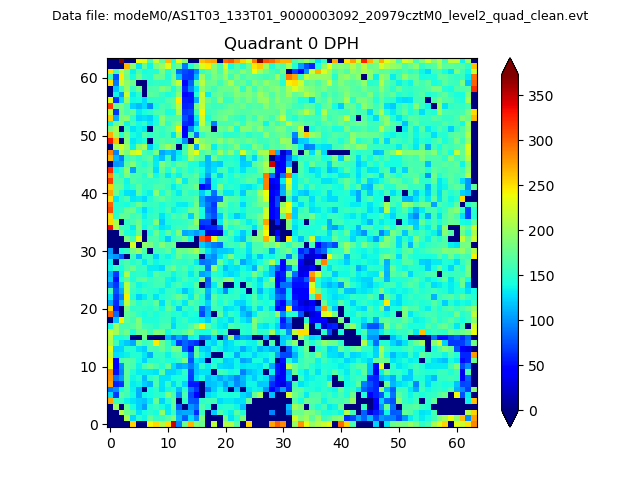 |
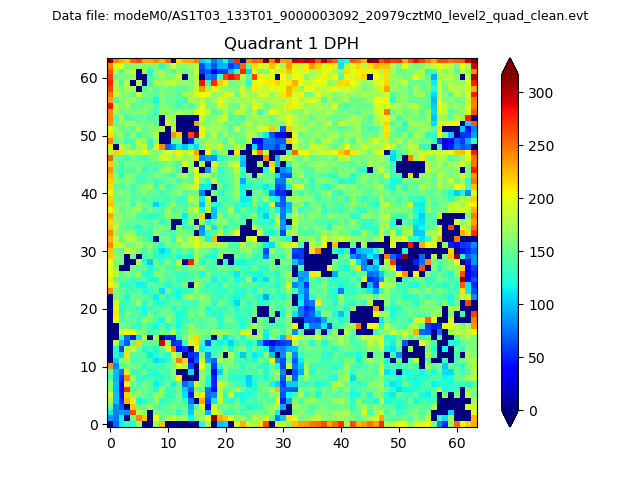 |
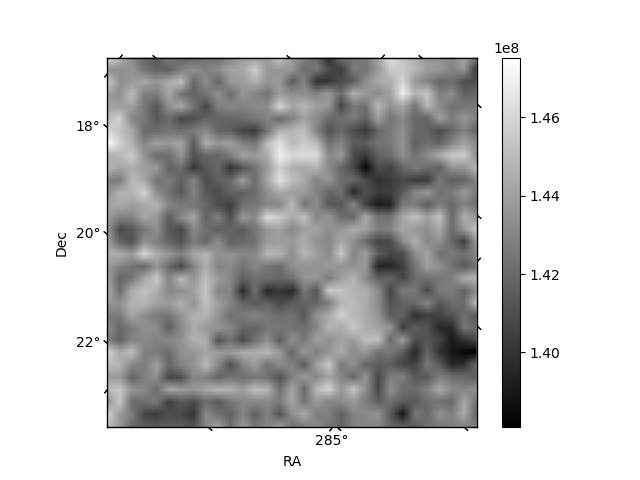
Quadrant B |
|---|---|---|---|
| Quadrant D | 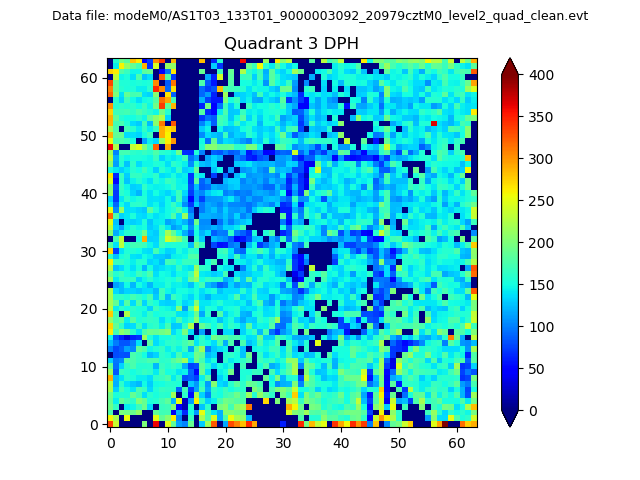 |
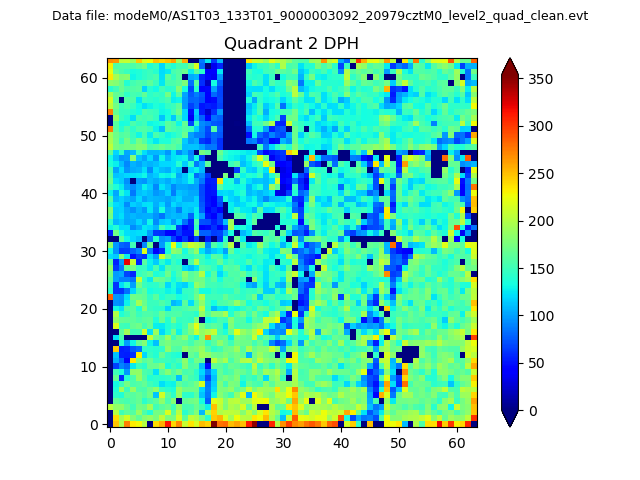 |
Quadrant C |
| Plot type | Count rate plots | Images |
|---|---|---|
| Comparison with Poisson distribution Blue bars denote a histogram of data divided into 1 sec bins. Red curve is a Poisson curve with rate = median count rate of data. |
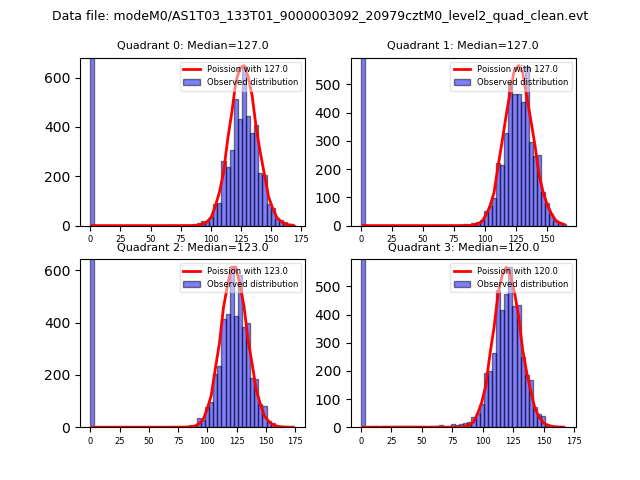 |
 |
| Quadrant-wise count rates Data is divided into 100 sec bins |
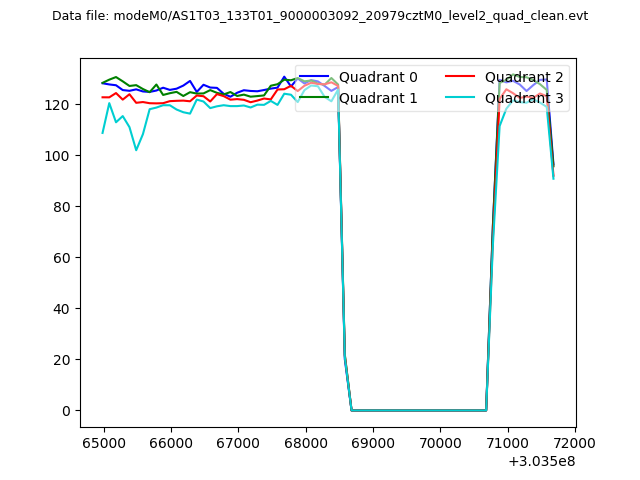 |
|
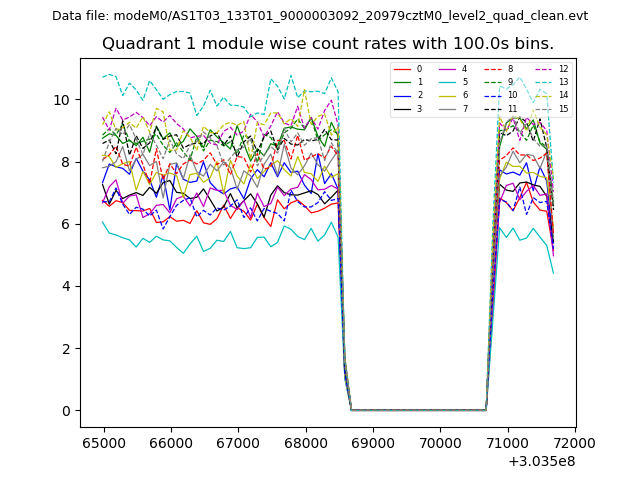
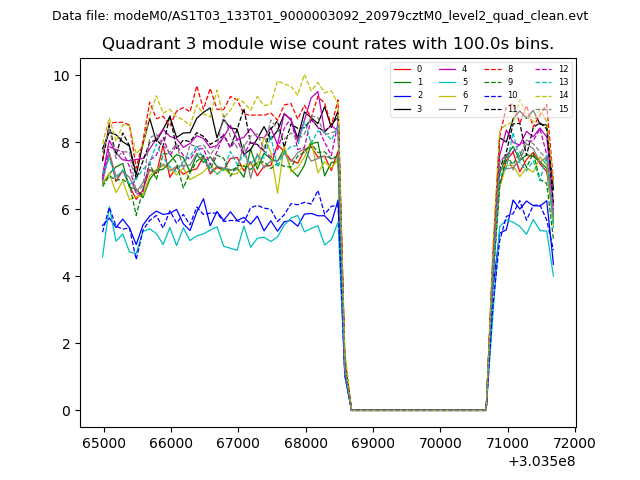
| Module-wise count rates for Quadrant A Data is divided into 100 sec bins |
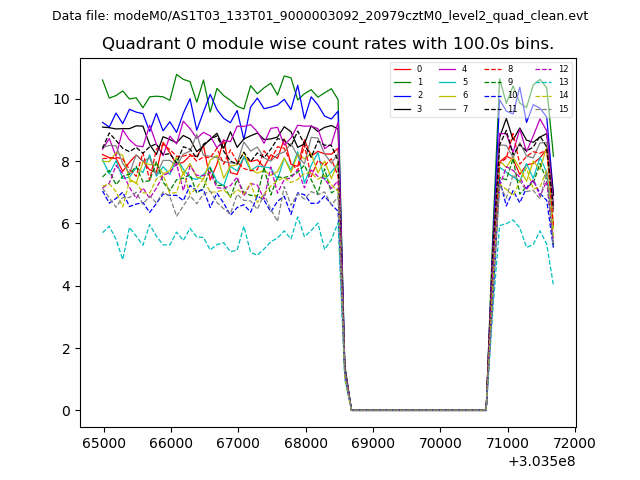 |
 |
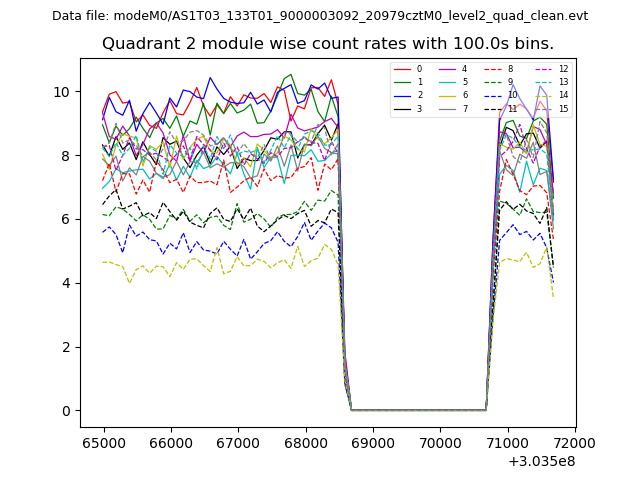
| Module-wise count rates for Quadrant B Data is divided into 100 sec bins |
 |
 |
| Module-wise count rates for Quadrant C Data is divided into 100 sec bins |
 |
 |
| Module-wise count rates for Quadrant D Data is divided into 100 sec bins |
 |
 |
| Parameter | Plot |
|---|---|
| CZT HV Monitor | 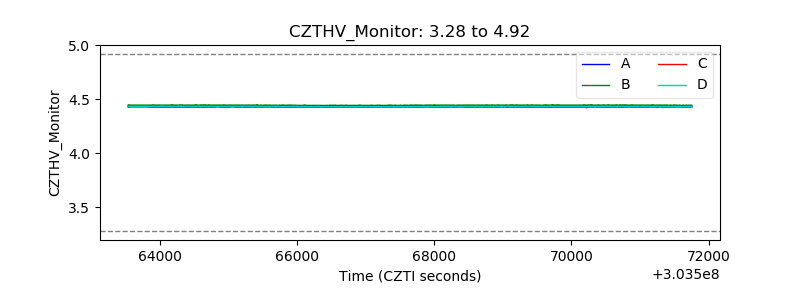 |
| D_VDD | 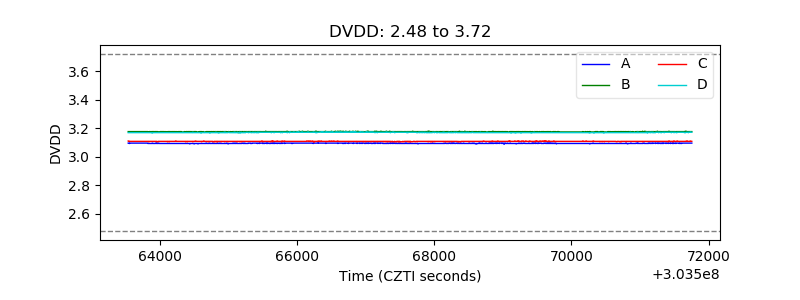 |
| Temperature 1 | 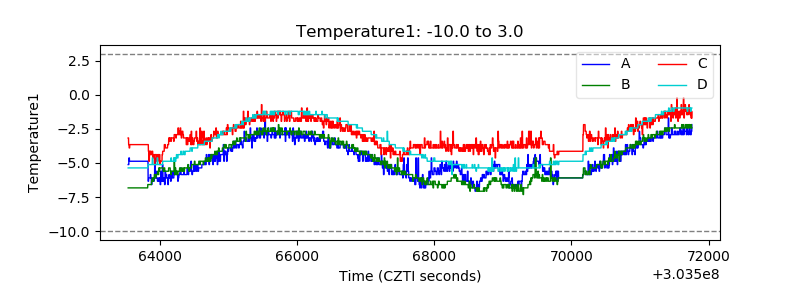 |
| Veto HV Monitor | 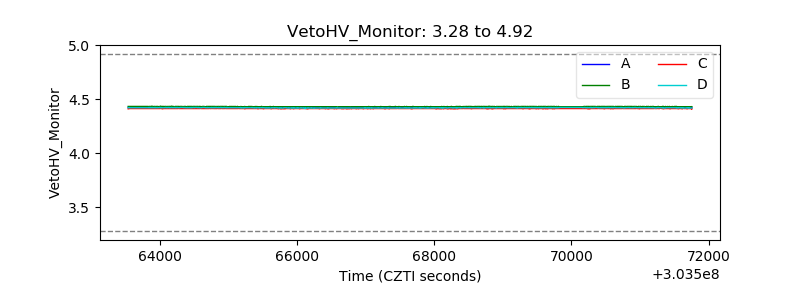 |
| Veto LLD | 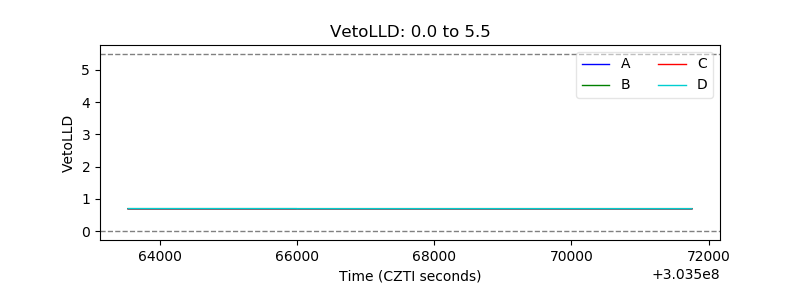 |
| Alpha Counter | 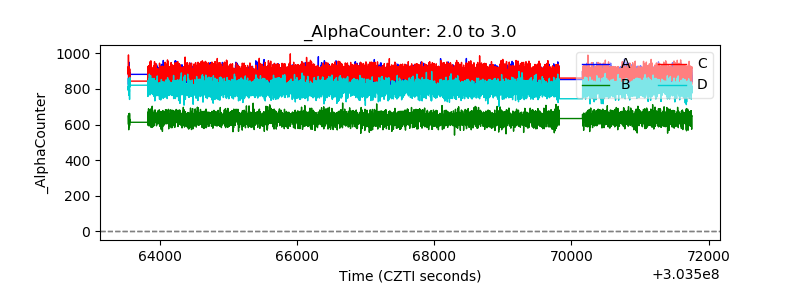 |
| _CPM_Rate |  |
| CZT Counter | 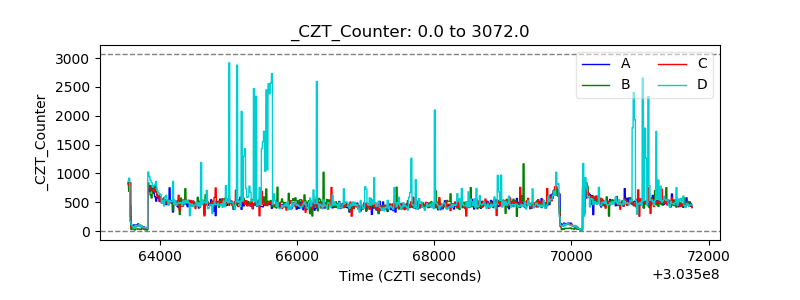 |
| +2.5 Volts monitor |  |
| +5 Volts monitor |  |
| _ROLL_ROT | 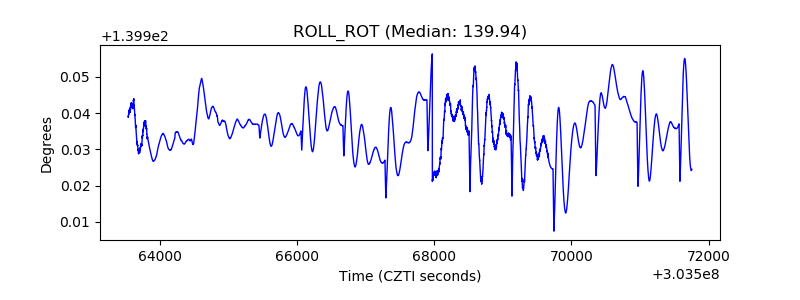 |
| _Roll_DEC | 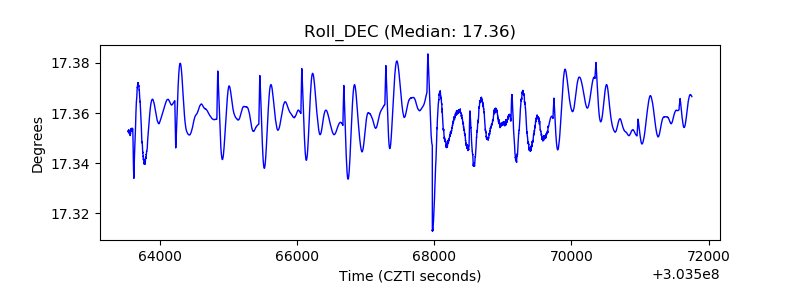 |
| _Roll_RA | 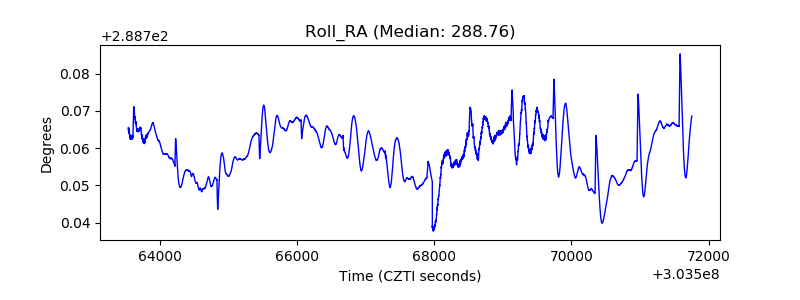 |
| Veto Counter | 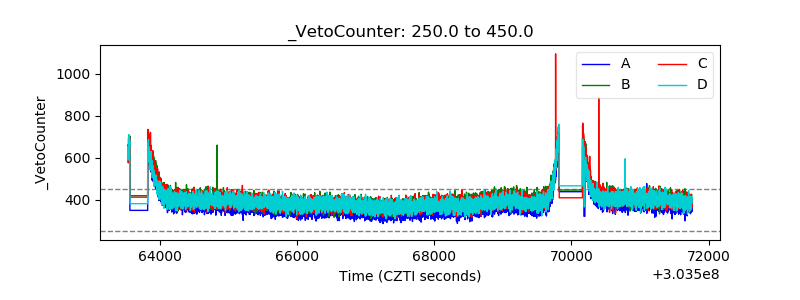 |