| Param | Original file | Final file |
|---|---|---|
| Filename | modeM0/AS1T03_133T01_9000003092_20982cztM0_level2.evt | modeM0/AS1T03_133T01_9000003092_20982cztM0_level2_quad_clean.evt |
| Size (bytes) | 1,309,420,800 | 233,942,400 |
| Size | 1.2 GB | 223.1 MB |
| Events in quadrant A | 8,147,869 | 1,508,574 |
| Events in quadrant B | 9,141,368 | 1,506,971 |
| Events in quadrant C | 8,329,538 | 1,474,217 |
| Events in quadrant D | 12,848,769 | 1,383,229 |
| Mode M0 | |||
|---|---|---|---|
| Quadrant | BADHDUFLAG | Total packets | Discarded packets |
| A | 0 | 35981 | 4 |
| B | 0 | 38665 | 3 |
| C | 0 | 35990 | 3 |
| D | 0 | 49700 | 3 |
| Mode M9 | |||
|---|---|---|---|
| Quadrant | BADHDUFLAG | Total packets | Discarded packets |
| A | 0 | 21 | 0 |
| B | 0 | 21 | 0 |
| C | 0 | 21 | 0 |
| D | 0 | 21 | 0 |
| Mode SS | |||
|---|---|---|---|
| Quadrant | BADHDUFLAG | Total packets | Discarded packets |
| A | 0 | 356 | 0 |
| B | 0 | 356 | 0 |
| C | 0 | 356 | 0 |
| D | 0 | 356 | 0 |
| Quadrant | Total seconds | Saturated seconds | Saturation percentage |
|---|---|---|---|
| A | 17595 | 145 | 0.824098% |
| B | 17596 | 300 | 1.704933% |
| C | 17596 | 221 | 1.255967% |
| D | 17596 | 1103 | 6.268470% |
Noise dominated data is calculated using 1-second bins in cleaned event files. If a bin has >2000 counts, and if more than 50% of those come from <1% of pixels, then it is considered to be noise-dominated and hence unusable.
| Quadrant | # 1 sec bins | Bins with >0 counts | Bins with >2000 counts | High rate bins dominated by noise | Noise dominated (total time) | Noise dominated (detector-on time) | Marked lightcurve |
|---|---|---|---|---|---|---|---|
| A | 19580 | 17598 | 3 | 3 | 0.02% | 0.02% |  |
| B | 19581 | 17599 | 98 | 98 | 0.50% | 0.56% |  |
| C | 19581 | 17599 | 0 | 0 | 0.00% | 0.00% | 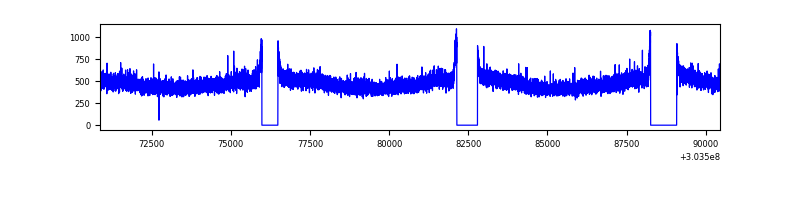 |
| D | 19581 | 17599 | 944 | 944 | 4.82% | 5.36% | 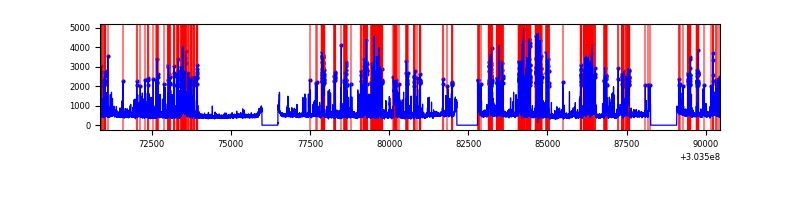 |
Top three noisy pixels from each quadrant. If the there are fewer than three noisy pixels in the level2.evt file, extra rows are filled as -1
| Pixel properties | Quadrant properties | ||||||
|---|---|---|---|---|---|---|---|
| Quadrant | DetID | PixID | Counts | Sigma | Mean | Median | Sigma |
| A | 0 | 226 | 18154 | 37.84 | 2116 | 2068 | 425.1 |
| A | 3 | 137 | 18033 | 37.56 | 2116 | 2068 | 425.1 |
| A | 12 | 194 | 14985 | 30.39 | 2116 | 2068 | 425.1 |
| B | 7 | 220 | 649264 | 1615.41 | 2100 | 2041 | 400.7 |
| B | 0 | 197 | 107604 | 263.47 | 2100 | 2041 | 400.7 |
| B | 3 | 64 | 65275 | 157.82 | 2100 | 2041 | 400.7 |
| C | 14 | 238 | 315274 | 653.5 | 2040 | 2055 | 479.3 |
| C | 7 | 247 | 41707 | 82.73 | 2040 | 2055 | 479.3 |
| C | 13 | 61 | 14382 | 25.72 | 2040 | 2055 | 479.3 |
| D | 1 | 52 | 4550135 | 9318.43 | 2017 | 1963 | 488.1 |
| D | 7 | 223 | 335909 | 684.2 | 2017 | 1963 | 488.1 |
| D | 9 | 1 | 124639 | 251.34 | 2017 | 1963 | 488.1 |
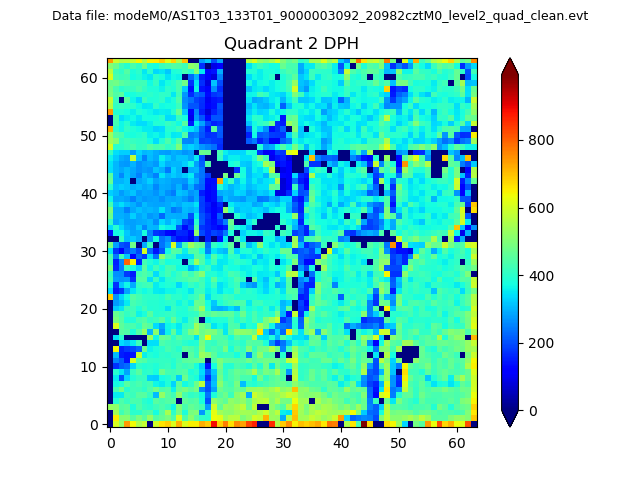
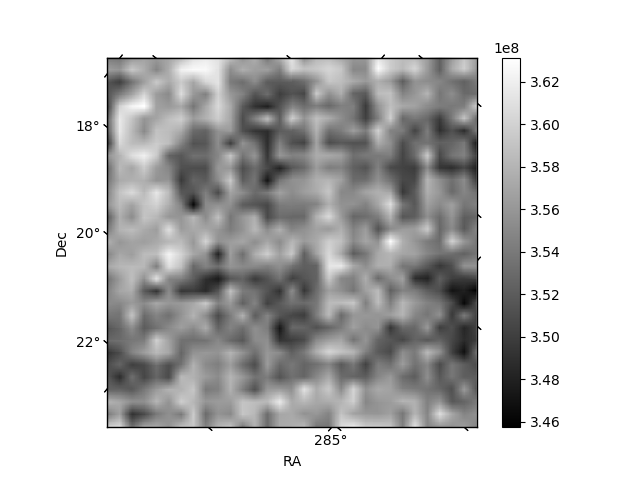
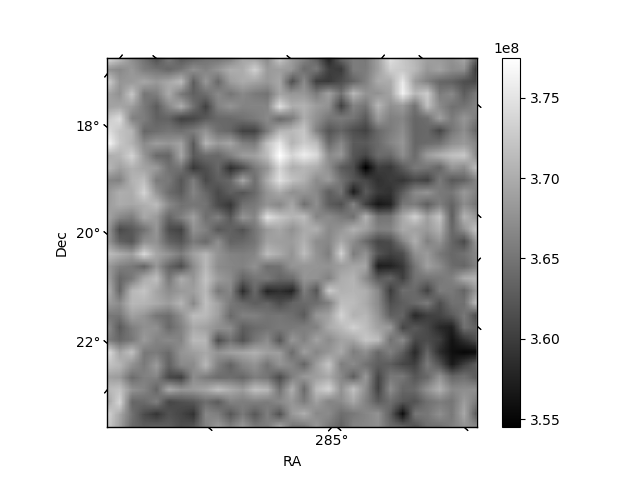
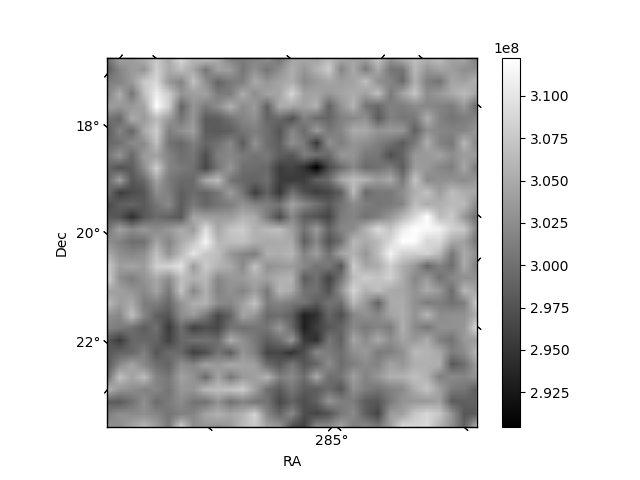
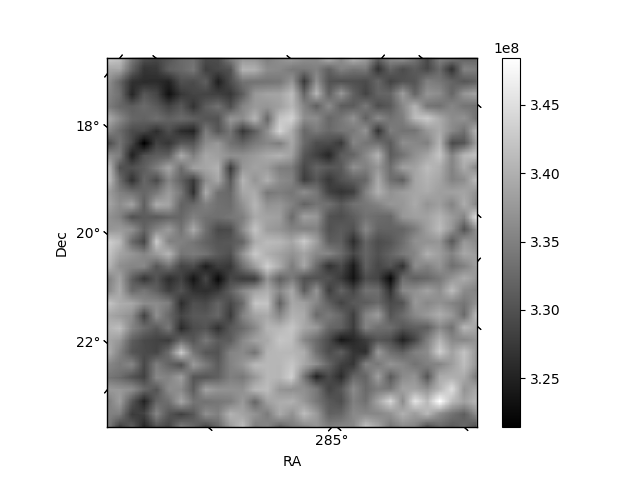
Histogram calculated using DETX and DETY for each event in the final _common_clean file
| Quadrant A | 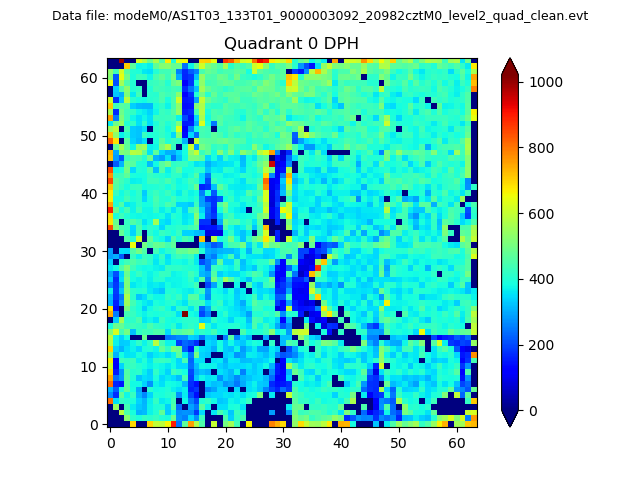 |
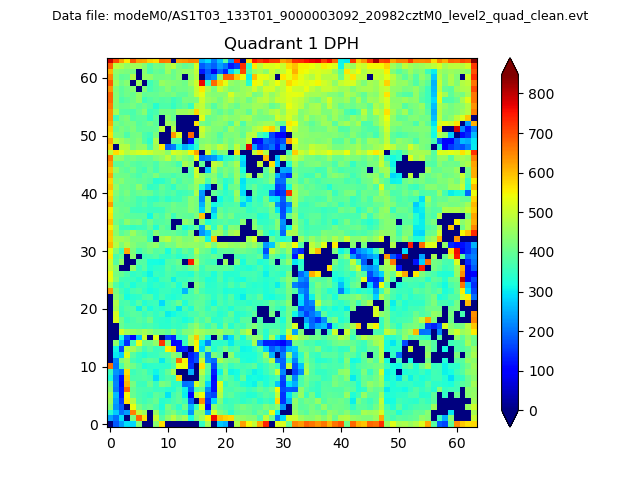 |
Quadrant B |
|---|---|---|---|
| Quadrant D | 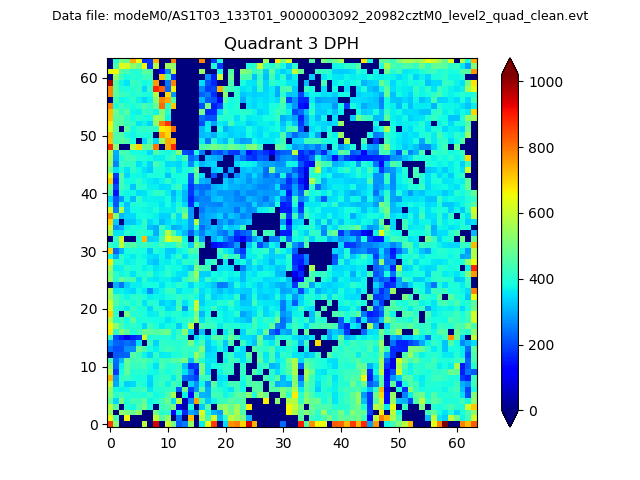 |
 |
Quadrant C |
| Plot type | Count rate plots | Images |
|---|---|---|
| Comparison with Poisson distribution Blue bars denote a histogram of data divided into 1 sec bins. Red curve is a Poisson curve with rate = median count rate of data. |
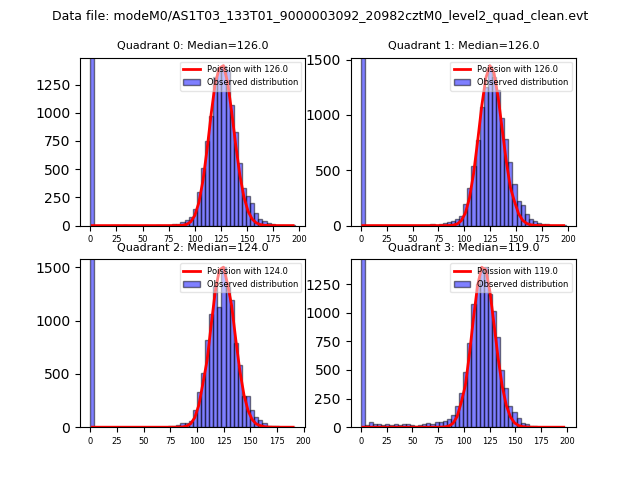 |
 |
| Quadrant-wise count rates Data is divided into 100 sec bins |
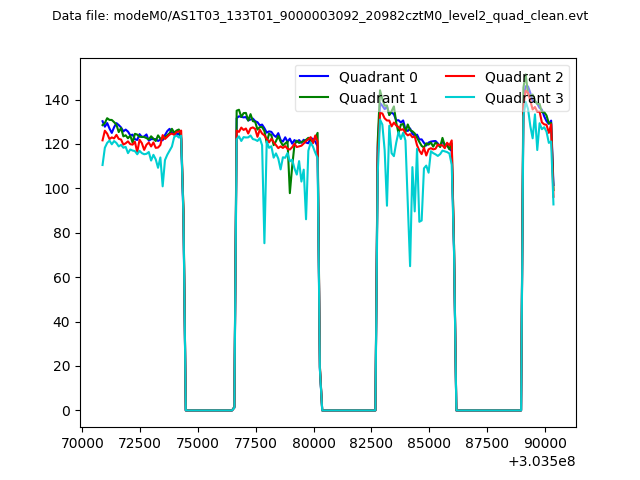 |
|
| Module-wise count rates for Quadrant A Data is divided into 100 sec bins |
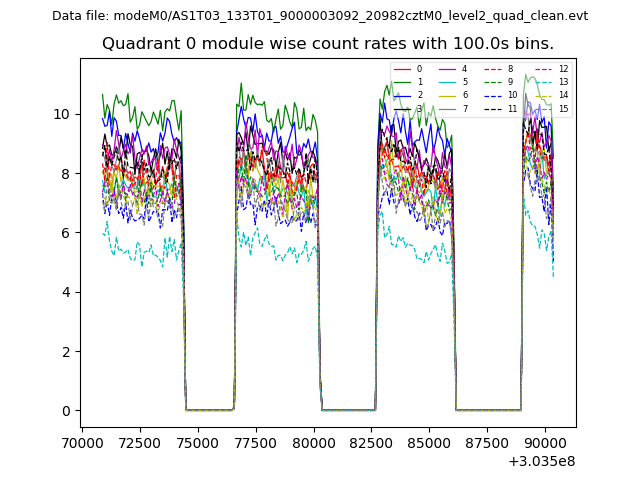 |
 |
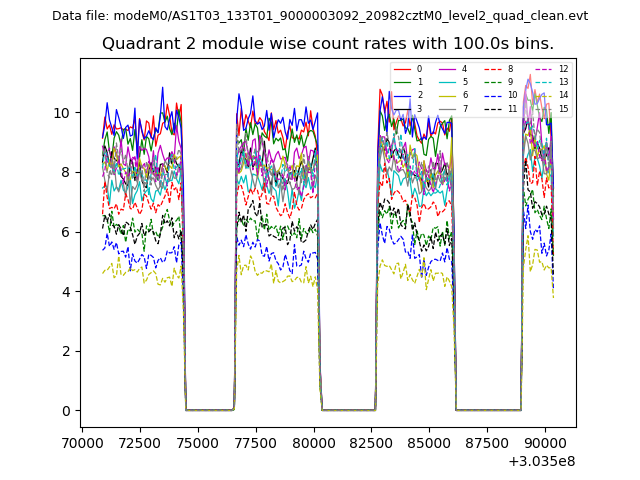
| Module-wise count rates for Quadrant B Data is divided into 100 sec bins |
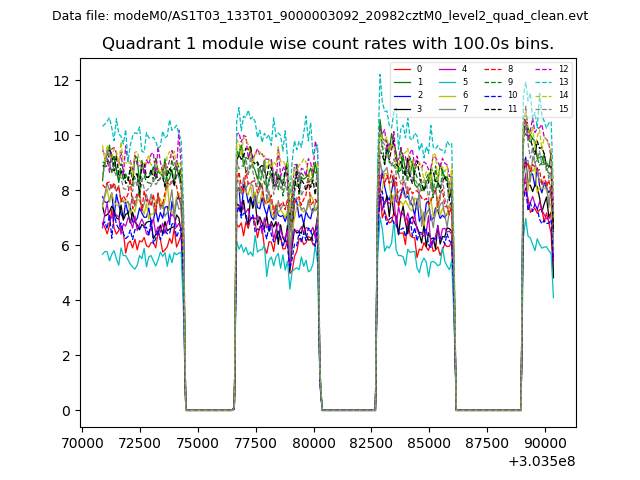 |
 |
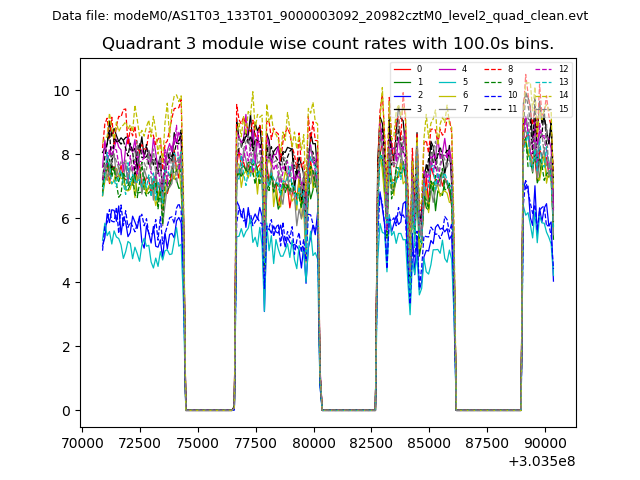
| Module-wise count rates for Quadrant C Data is divided into 100 sec bins |
 |
 |
| Module-wise count rates for Quadrant D Data is divided into 100 sec bins |
 |
 |
| Parameter | Plot |
|---|---|
| CZT HV Monitor | 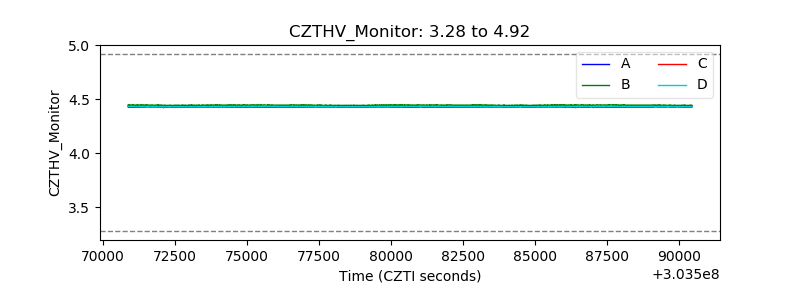 |
| D_VDD | 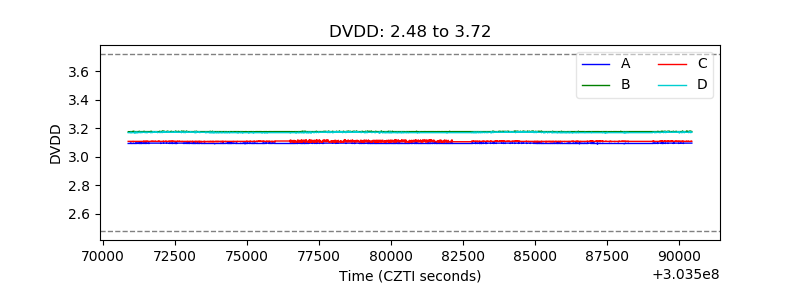 |
| Temperature 1 | 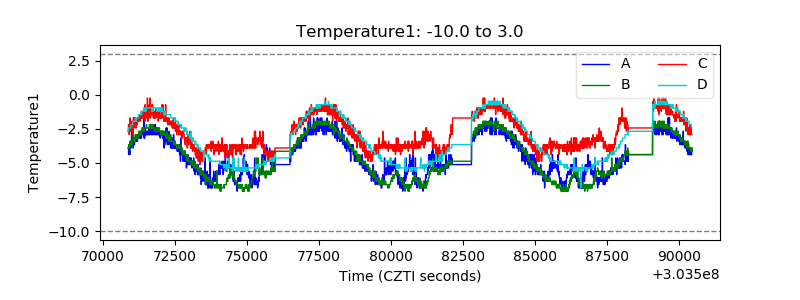 |
| Veto HV Monitor |  |
| Veto LLD | 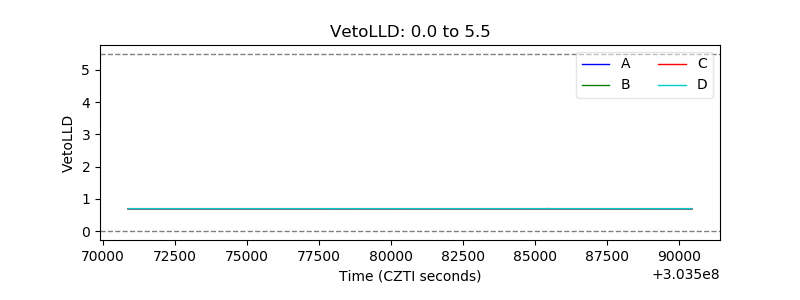 |
| Alpha Counter | 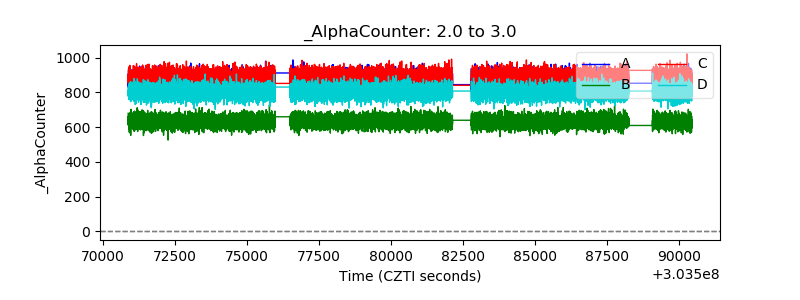 |
| _CPM_Rate | 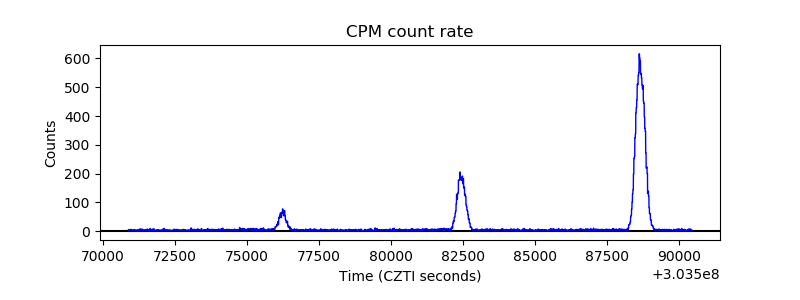 |
| CZT Counter | 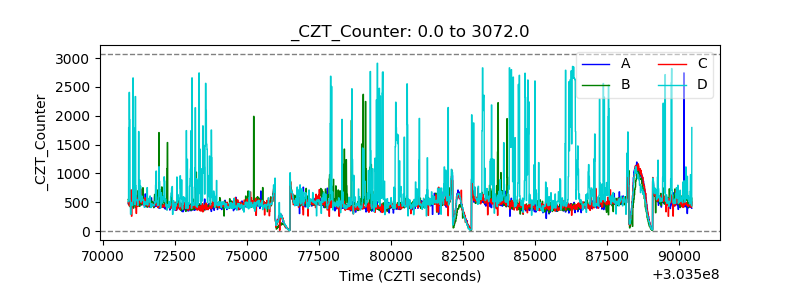 |
| +2.5 Volts monitor |  |
| +5 Volts monitor |  |
| _ROLL_ROT | 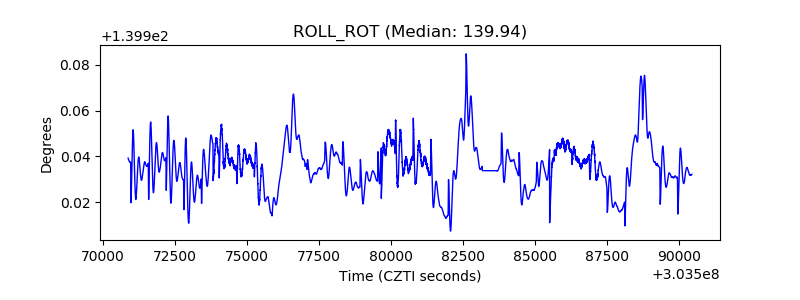 |
| _Roll_DEC | 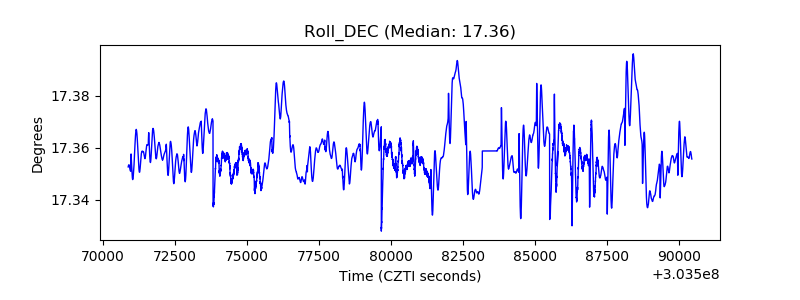 |
| _Roll_RA | 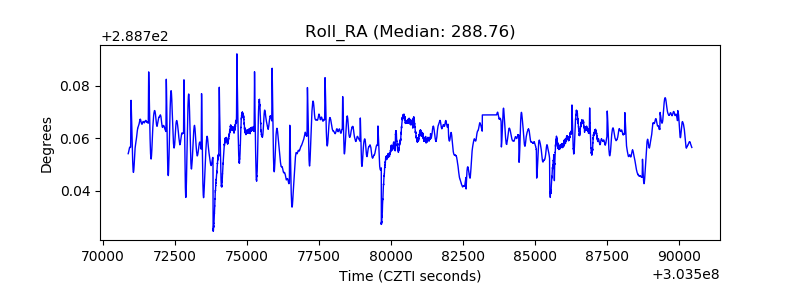 |
| Veto Counter | 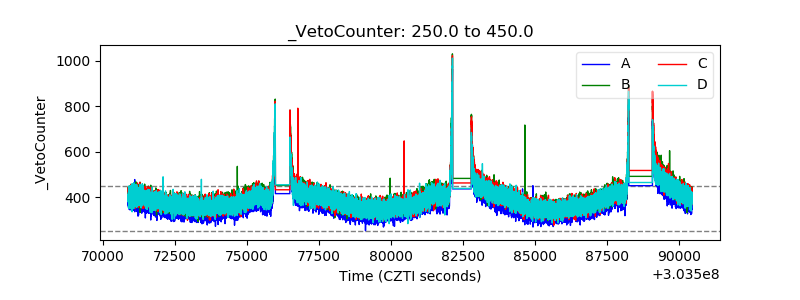 |