| Param | Original file | Final file |
|---|---|---|
| Filename | modeM0/AS1T03_133T01_9000003092_20985cztM0_level2.evt | modeM0/AS1T03_133T01_9000003092_20985cztM0_level2_quad_clean.evt |
| Size (bytes) | 1,797,894,720 | 294,886,080 |
| Size | 1.7 GB | 281.2 MB |
| Events in quadrant A | 11,498,228 | 1,858,605 |
| Events in quadrant B | 13,009,432 | 1,862,608 |
| Events in quadrant C | 11,572,355 | 1,828,576 |
| Events in quadrant D | 16,734,836 | 1,715,579 |
| Mode M0 | |||
|---|---|---|---|
| Quadrant | BADHDUFLAG | Total packets | Discarded packets |
| A | 0 | 50368 | 5 |
| B | 0 | 54612 | 5 |
| C | 0 | 49935 | 5 |
| D | 0 | 65754 | 6 |
| Mode M9 | |||
|---|---|---|---|
| Quadrant | BADHDUFLAG | Total packets | Discarded packets |
| A | 0 | 42 | 0 |
| B | 0 | 42 | 0 |
| C | 0 | 42 | 0 |
| D | 0 | 42 | 0 |
| Mode SS | |||
|---|---|---|---|
| Quadrant | BADHDUFLAG | Total packets | Discarded packets |
| A | 0 | 492 | 0 |
| B | 0 | 492 | 0 |
| C | 0 | 492 | 0 |
| D | 0 | 492 | 0 |
| Quadrant | Total seconds | Saturated seconds | Saturation percentage |
|---|---|---|---|
| A | 24216 | 282 | 1.164519% |
| B | 24217 | 575 | 2.374365% |
| C | 24217 | 319 | 1.317256% |
| D | 24216 | 1340 | 5.533532% |
Noise dominated data is calculated using 1-second bins in cleaned event files. If a bin has >2000 counts, and if more than 50% of those come from <1% of pixels, then it is considered to be noise-dominated and hence unusable.
| Quadrant | # 1 sec bins | Bins with >0 counts | Bins with >2000 counts | High rate bins dominated by noise | Noise dominated (total time) | Noise dominated (detector-on time) | Marked lightcurve |
|---|---|---|---|---|---|---|---|
| A | 28321 | 24221 | 57 | 57 | 0.20% | 0.24% | 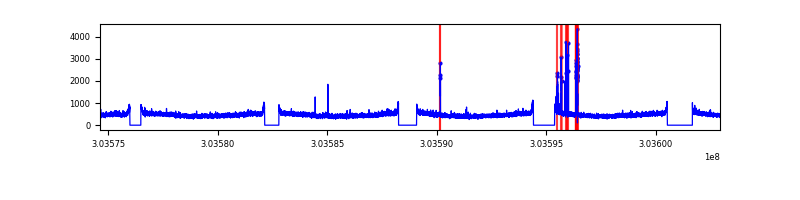 |
| B | 28322 | 24222 | 204 | 204 | 0.72% | 0.84% | 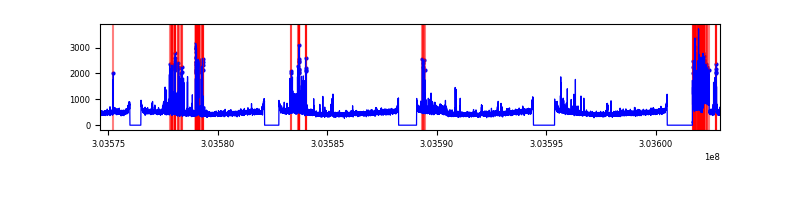 |
| C | 28322 | 24222 | 0 | 0 | 0.00% | 0.00% | 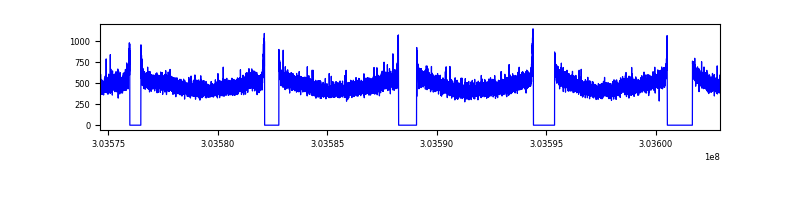 |
| D | 28321 | 24221 | 1129 | 1129 | 3.99% | 4.66% | 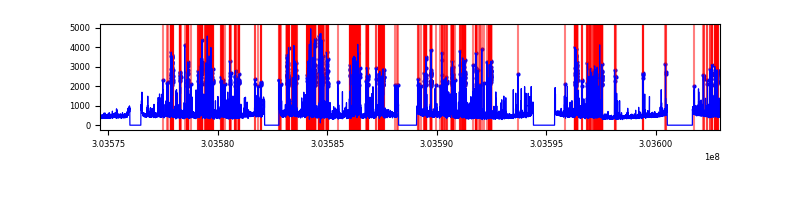 |
Top three noisy pixels from each quadrant. If the there are fewer than three noisy pixels in the level2.evt file, extra rows are filled as -1
| Pixel properties | Quadrant properties | ||||||
|---|---|---|---|---|---|---|---|
| Quadrant | DetID | PixID | Counts | Sigma | Mean | Median | Sigma |
| A | 15 | 174 | 220487 | 371.47 | 2929 | 2863 | 585.9 |
| A | 0 | 226 | 25257 | 38.22 | 2929 | 2863 | 585.9 |
| A | 3 | 137 | 24601 | 37.1 | 2929 | 2863 | 585.9 |
| B | 7 | 220 | 680508 | 1225.6 | 2918 | 2843 | 552.9 |
| B | 0 | 182 | 586107 | 1054.87 | 2918 | 2843 | 552.9 |
| B | 0 | 197 | 129657 | 229.35 | 2918 | 2843 | 552.9 |
| C | 14 | 238 | 439370 | 655.65 | 2836 | 2856 | 665.8 |
| C | 7 | 247 | 52289 | 74.25 | 2836 | 2856 | 665.8 |
| C | 13 | 61 | 19882 | 25.57 | 2836 | 2856 | 665.8 |
| D | 1 | 52 | 5190265 | 7693.7 | 2803 | 2730 | 674.3 |
| D | 7 | 223 | 411565 | 606.35 | 2803 | 2730 | 674.3 |
| D | 1 | 20 | 124727 | 180.94 | 2803 | 2730 | 674.3 |
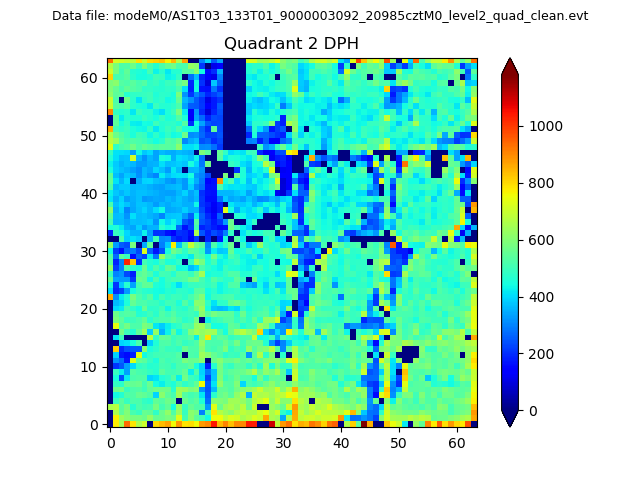
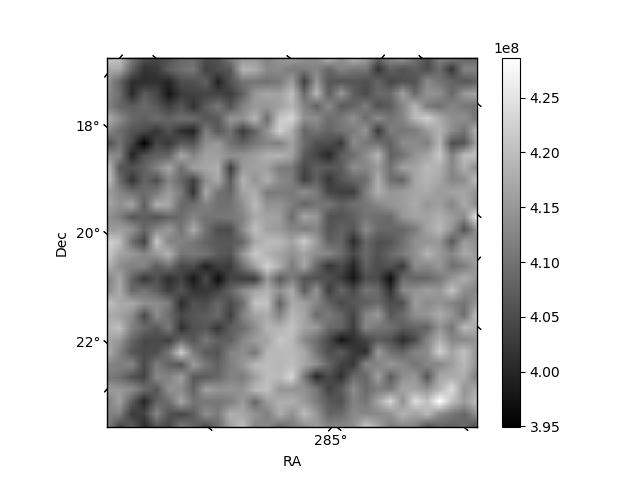
Histogram calculated using DETX and DETY for each event in the final _common_clean file
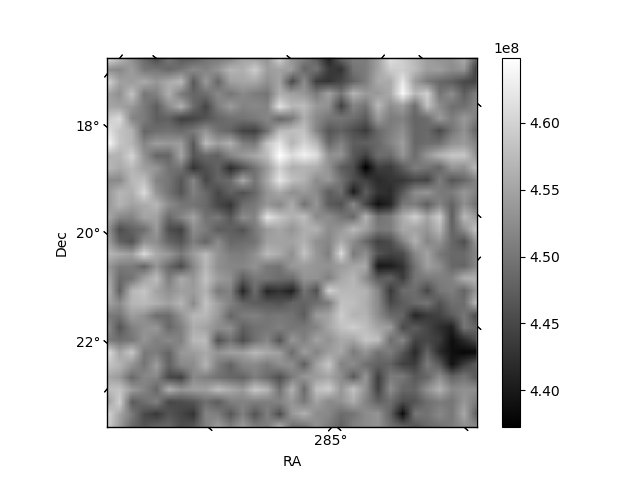
| Quadrant A | 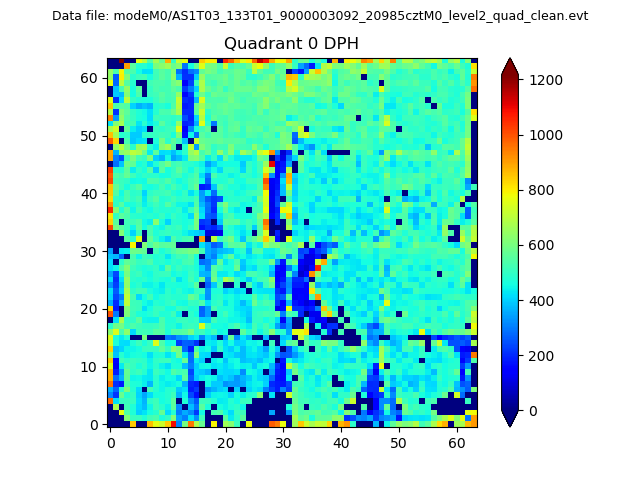 |
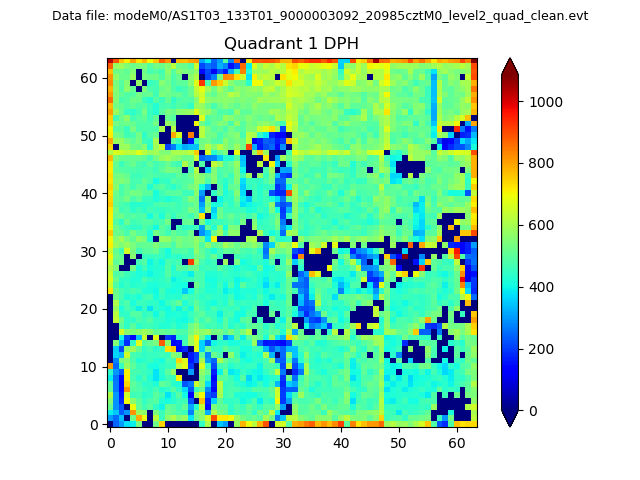 |
Quadrant B |
|---|---|---|---|
| Quadrant D | 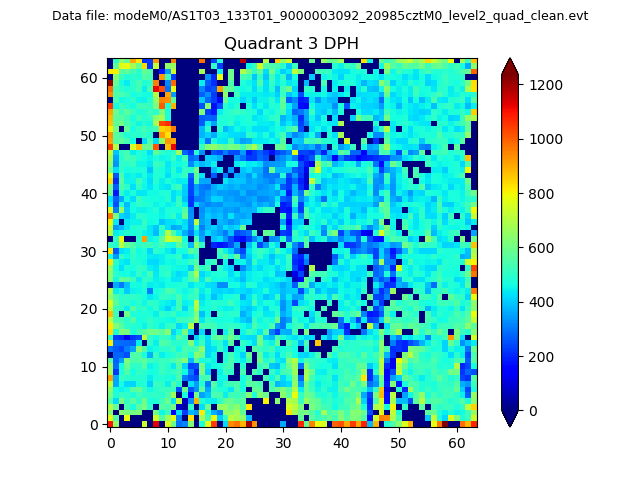 |
 |
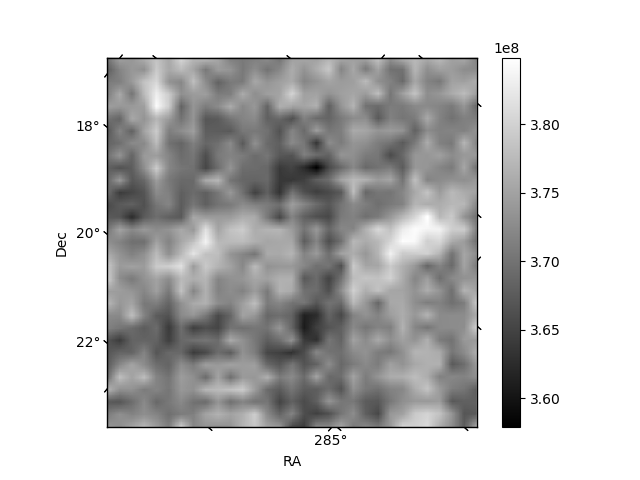
Quadrant C |
| Plot type | Count rate plots | Images |
|---|---|---|
| Comparison with Poisson distribution Blue bars denote a histogram of data divided into 1 sec bins. Red curve is a Poisson curve with rate = median count rate of data. |
 |
 |
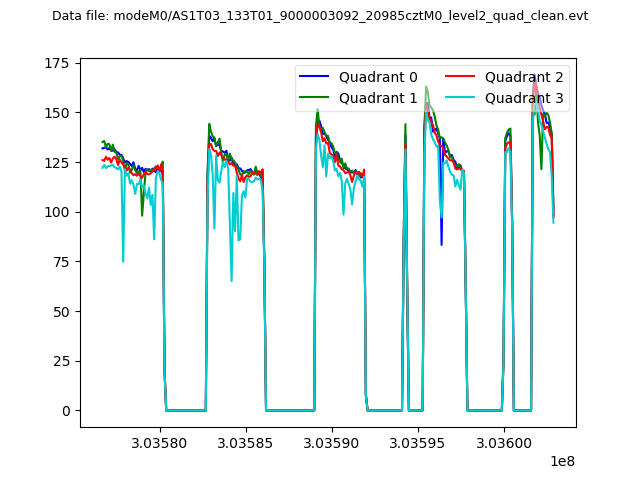
| Quadrant-wise count rates Data is divided into 100 sec bins |
 |
|
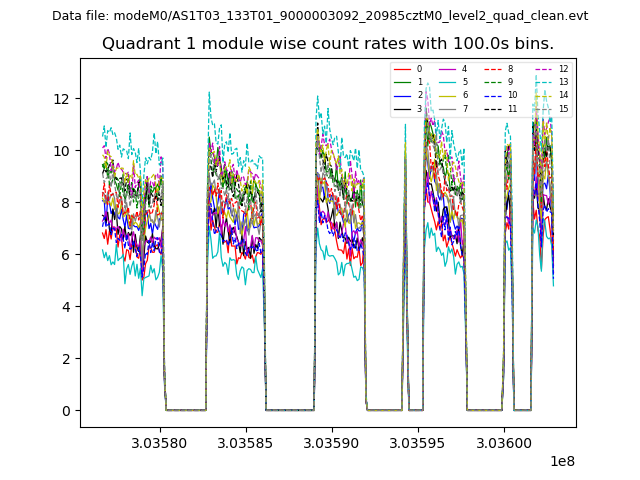
| Module-wise count rates for Quadrant A Data is divided into 100 sec bins |
 |
 |
| Module-wise count rates for Quadrant B Data is divided into 100 sec bins |
 |
 |
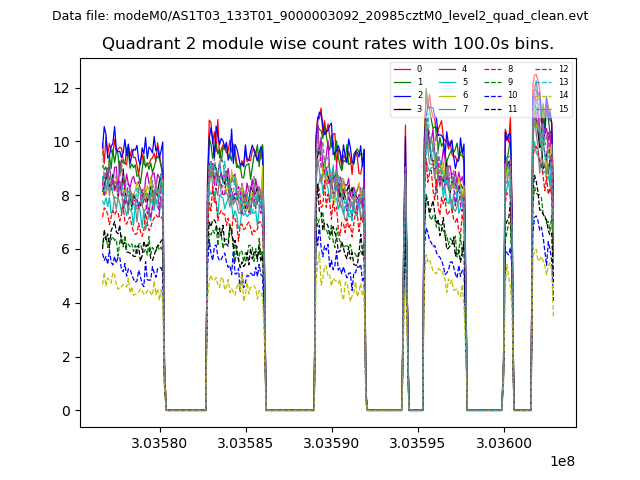
| Module-wise count rates for Quadrant C Data is divided into 100 sec bins |
 |
 |
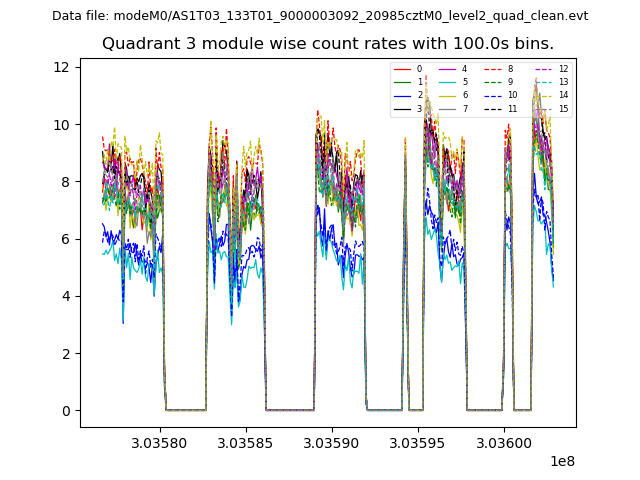
| Module-wise count rates for Quadrant D Data is divided into 100 sec bins |
 |
 |
| Parameter | Plot |
|---|---|
| CZT HV Monitor | 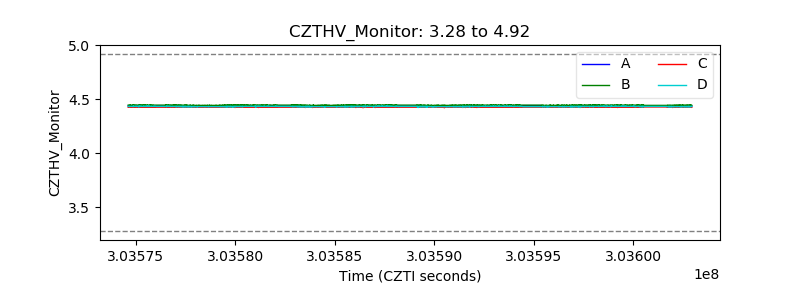 |
| D_VDD | 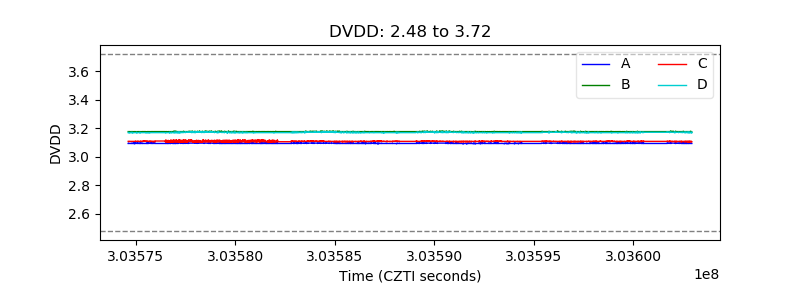 |
| Temperature 1 | 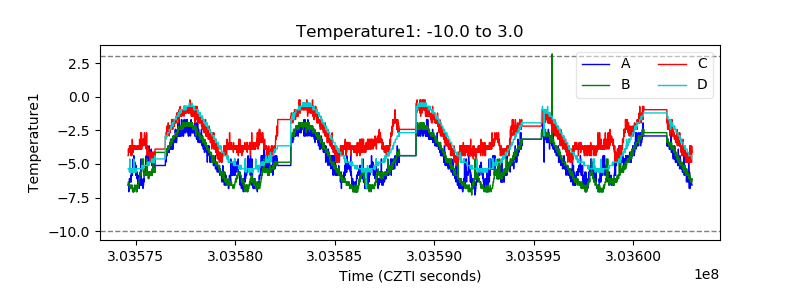 |
| Veto HV Monitor | 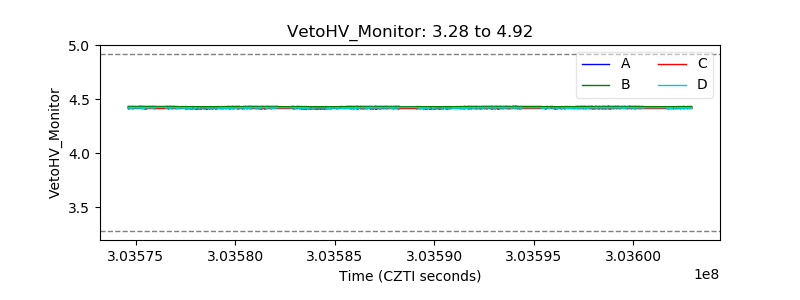 |
| Veto LLD |  |
| Alpha Counter | 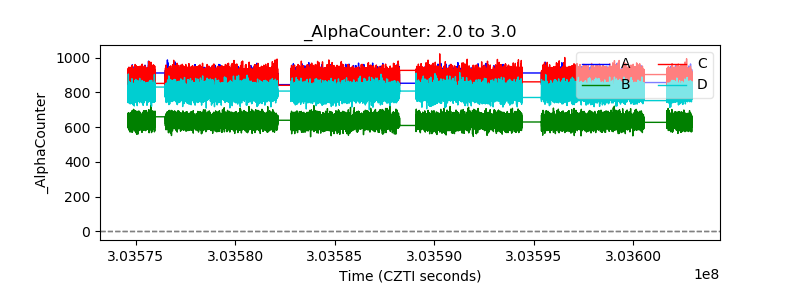 |
| _CPM_Rate | 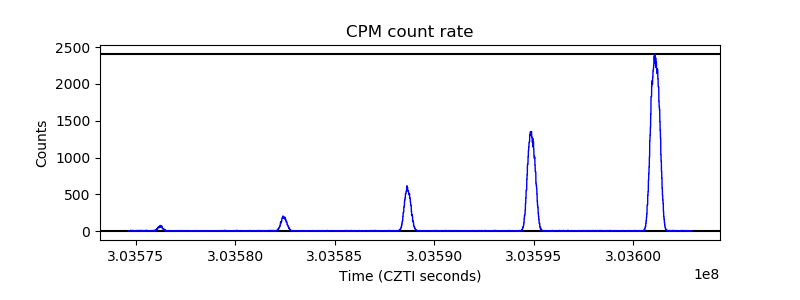 |
| CZT Counter | 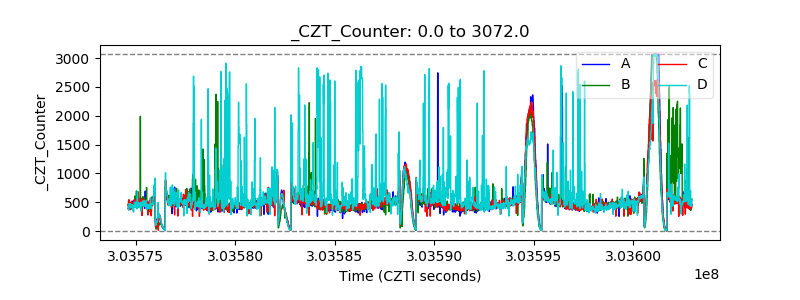 |
| +2.5 Volts monitor |  |
| +5 Volts monitor |  |
| _ROLL_ROT | 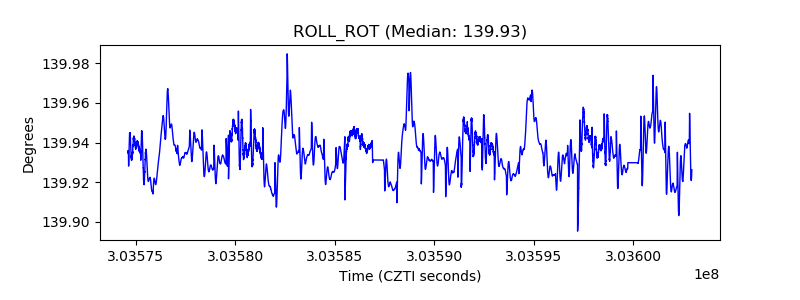 |
| _Roll_DEC | 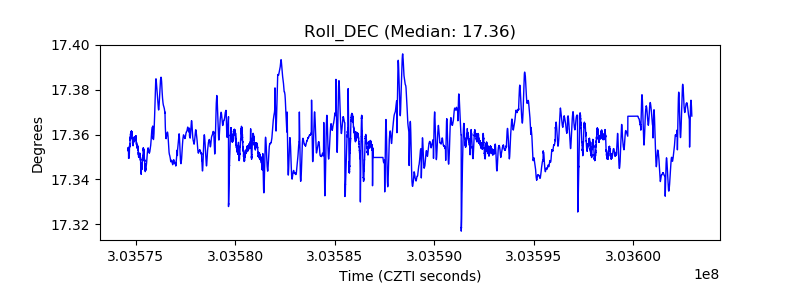 |
| _Roll_RA | 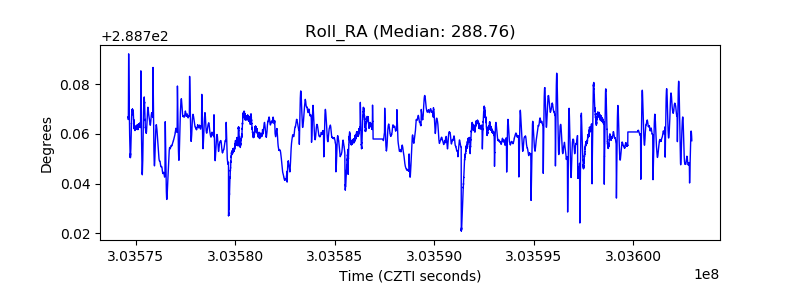 |
| Veto Counter |  |