| Param | Original file | Final file |
|---|---|---|
| Filename | modeM0/AS1A05_025T18_9000003096_21006cztM0_level2.evt | modeM0/AS1A05_025T18_9000003096_21006cztM0_level2_quad_clean.evt |
| Size (bytes) | 491,302,080 | 83,836,800 |
| Size | 468.5 MB | 80.0 MB |
| Events in quadrant A | 3,414,834 | 512,902 |
| Events in quadrant B | 3,679,406 | 521,883 |
| Events in quadrant C | 3,471,948 | 510,312 |
| Events in quadrant D | 3,819,936 | 488,724 |
| Mode M0 | |||
|---|---|---|---|
| Quadrant | BADHDUFLAG | Total packets | Discarded packets |
| A | 0 | 14907 | 2 |
| B | 0 | 15463 | 2 |
| C | 0 | 14951 | 2 |
| D | 0 | 16232 | 2 |
| Mode M9 | |||
|---|---|---|---|
| Quadrant | BADHDUFLAG | Total packets | Discarded packets |
| A | 0 | 10 | 0 |
| B | 0 | 11 | 0 |
| C | 0 | 11 | 0 |
| D | 0 | 11 | 0 |
| Mode SS | |||
|---|---|---|---|
| Quadrant | BADHDUFLAG | Total packets | Discarded packets |
| A | 0 | 148 | 0 |
| B | 0 | 148 | 0 |
| C | 0 | 148 | 0 |
| D | 0 | 148 | 0 |
| Quadrant | Total seconds | Saturated seconds | Saturation percentage |
|---|---|---|---|
| A | 7248 | 141 | 1.945364% |
| B | 7248 | 195 | 2.690397% |
| C | 7248 | 196 | 2.704194% |
| D | 7247 | 221 | 3.049538% |
Noise dominated data is calculated using 1-second bins in cleaned event files. If a bin has >2000 counts, and if more than 50% of those come from <1% of pixels, then it is considered to be noise-dominated and hence unusable.
| Quadrant | # 1 sec bins | Bins with >0 counts | Bins with >2000 counts | High rate bins dominated by noise | Noise dominated (total time) | Noise dominated (detector-on time) | Marked lightcurve |
|---|---|---|---|---|---|---|---|
| A | 7723 | 7249 | 0 | 0 | 0.00% | 0.00% | 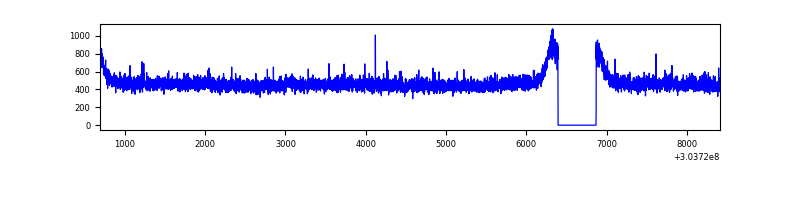 |
| B | 7723 | 7249 | 5 | 5 | 0.06% | 0.07% | 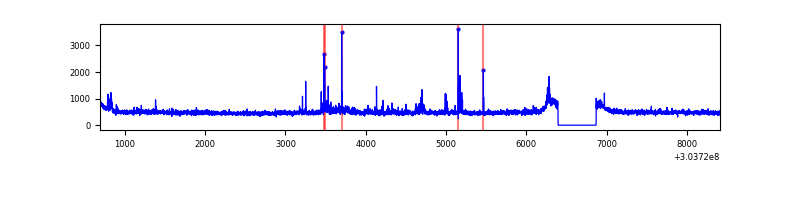 |
| C | 7723 | 7249 | 0 | 0 | 0.00% | 0.00% | 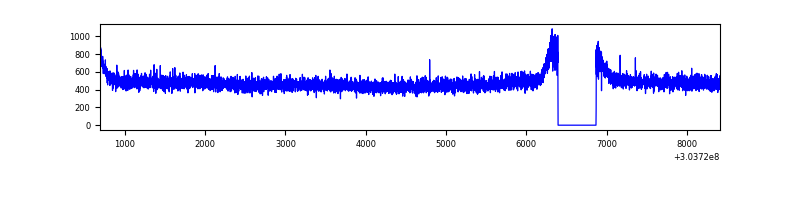 |
| D | 7722 | 7248 | 85 | 85 | 1.10% | 1.17% |  |
Top three noisy pixels from each quadrant. If the there are fewer than three noisy pixels in the level2.evt file, extra rows are filled as -1
| Pixel properties | Quadrant properties | ||||||
|---|---|---|---|---|---|---|---|
| Quadrant | DetID | PixID | Counts | Sigma | Mean | Median | Sigma |
| A | 0 | 226 | 7654 | 38.0 | 886 | 865 | 178.6 |
| A | 3 | 137 | 7453 | 36.88 | 886 | 865 | 178.6 |
| A | 12 | 194 | 6317 | 30.52 | 886 | 865 | 178.6 |
| B | 0 | 189 | 57340 | 333.73 | 885 | 862 | 169.2 |
| B | 7 | 220 | 48493 | 281.45 | 885 | 862 | 169.2 |
| B | 0 | 230 | 43854 | 254.04 | 885 | 862 | 169.2 |
| C | 14 | 238 | 133268 | 657.95 | 855 | 859 | 201.2 |
| C | 7 | 247 | 6399 | 27.53 | 855 | 859 | 201.2 |
| C | 13 | 61 | 6005 | 25.57 | 855 | 859 | 201.2 |
| D | 13 | 174 | 289510 | 1386.26 | 858 | 833 | 208.2 |
| D | 1 | 52 | 156468 | 747.38 | 858 | 833 | 208.2 |
| D | 13 | 104 | 65906 | 312.49 | 858 | 833 | 208.2 |
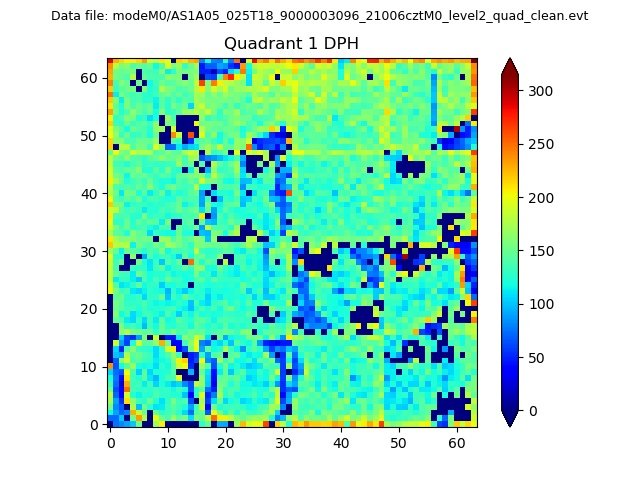
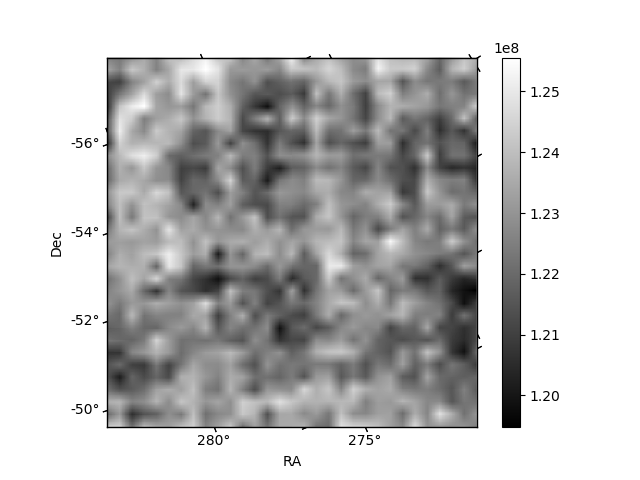
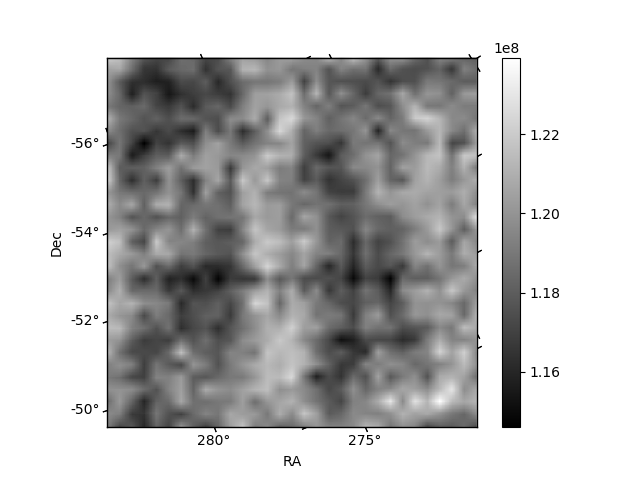
Histogram calculated using DETX and DETY for each event in the final _common_clean file
| Quadrant A | 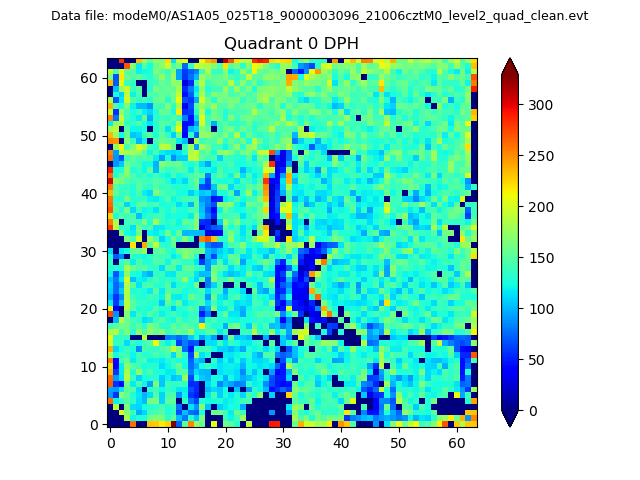 |
 |
Quadrant B |
|---|---|---|---|
| Quadrant D | 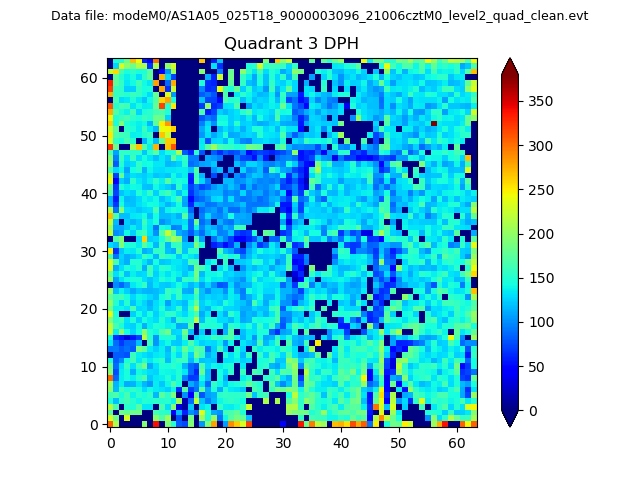 |
 |
Quadrant C |
| Plot type | Count rate plots | Images |
|---|---|---|
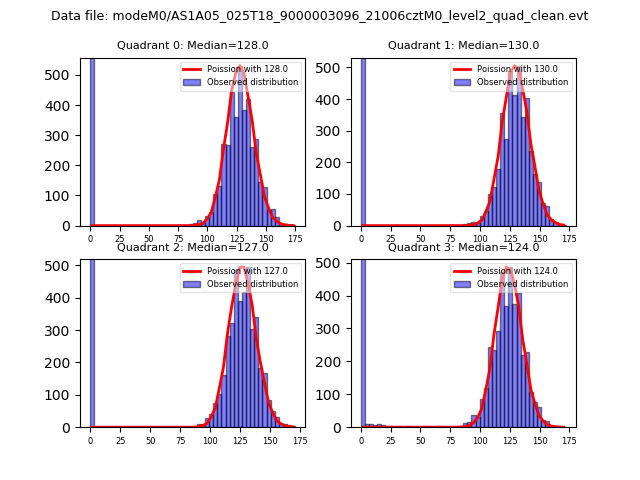
| Comparison with Poisson distribution Blue bars denote a histogram of data divided into 1 sec bins. Red curve is a Poisson curve with rate = median count rate of data. |
 |
 |
| Quadrant-wise count rates Data is divided into 100 sec bins |
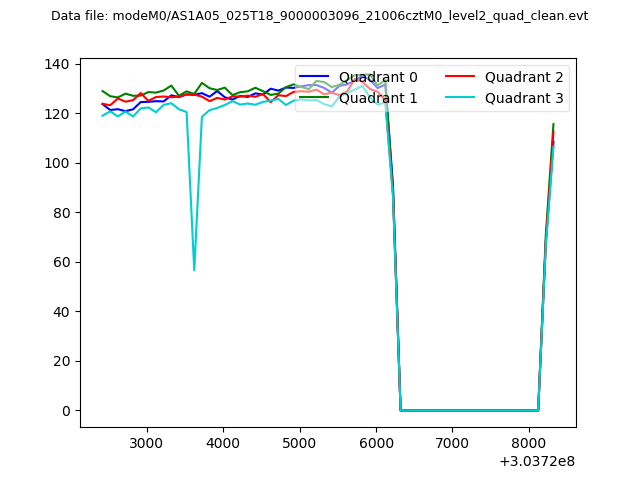 |
|
| Module-wise count rates for Quadrant A Data is divided into 100 sec bins |
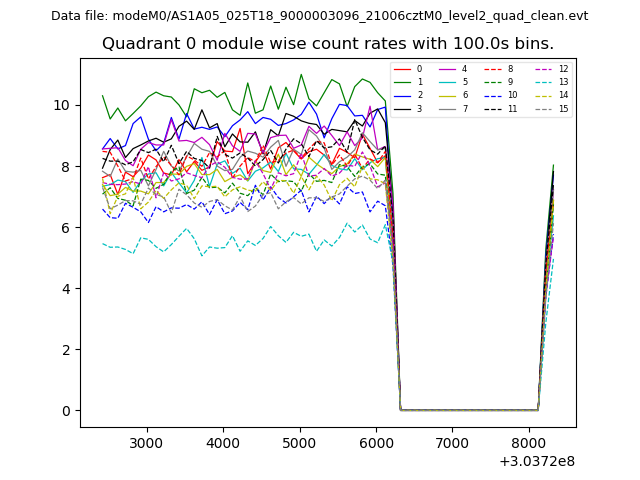 |
 |
| Module-wise count rates for Quadrant B Data is divided into 100 sec bins |
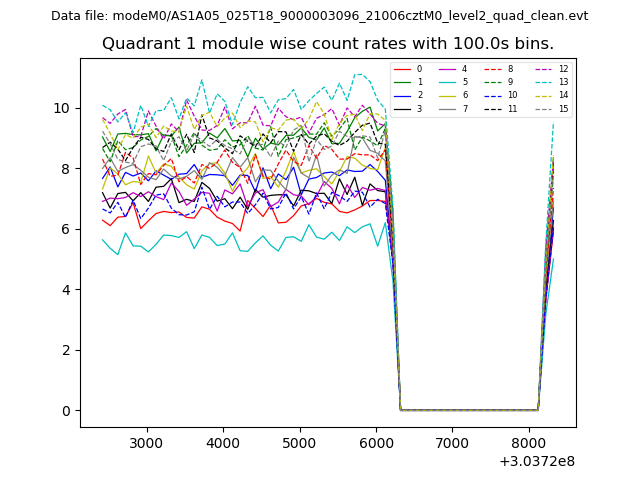 |
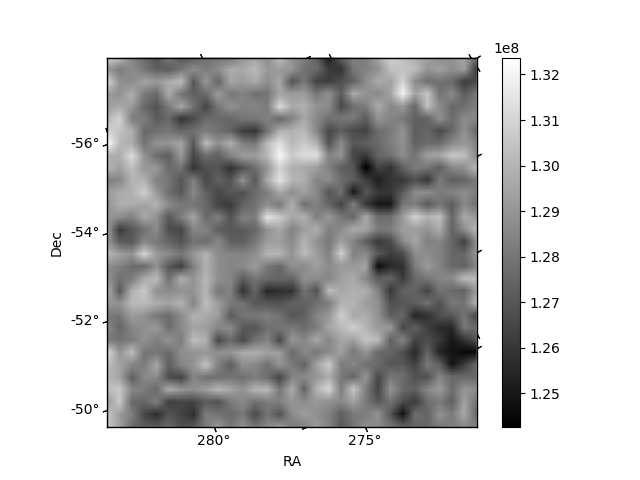 |
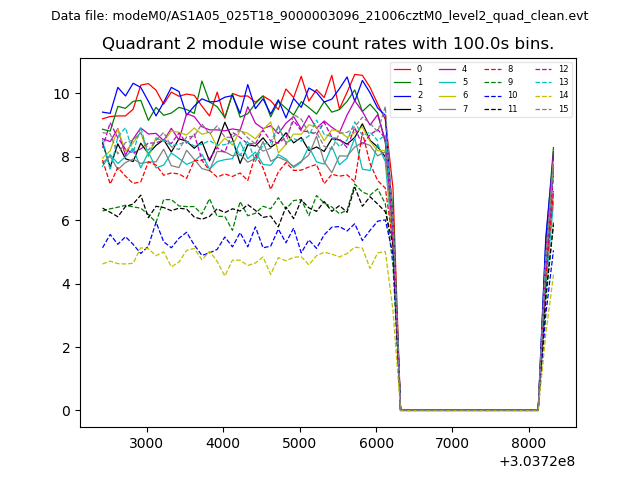
| Module-wise count rates for Quadrant C Data is divided into 100 sec bins |
 |
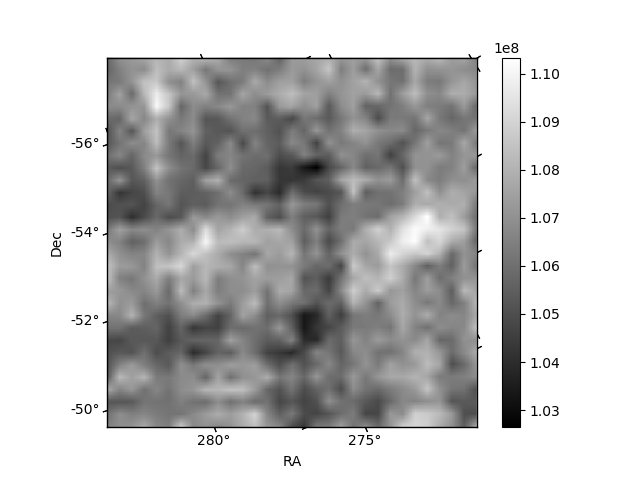 |
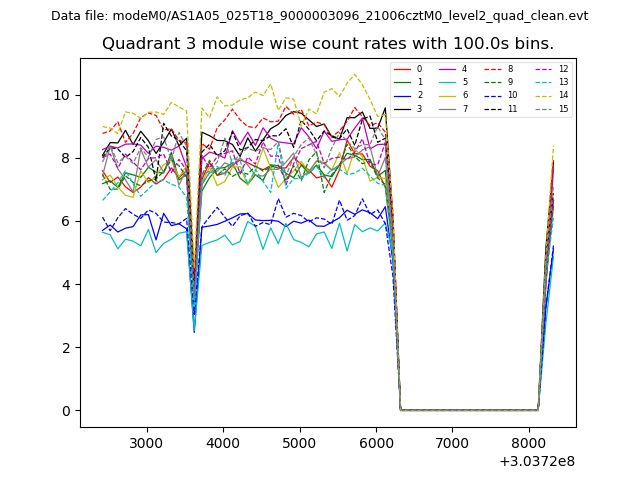
| Module-wise count rates for Quadrant D Data is divided into 100 sec bins |
 |
 |
| Parameter | Plot |
|---|---|
| CZT HV Monitor | 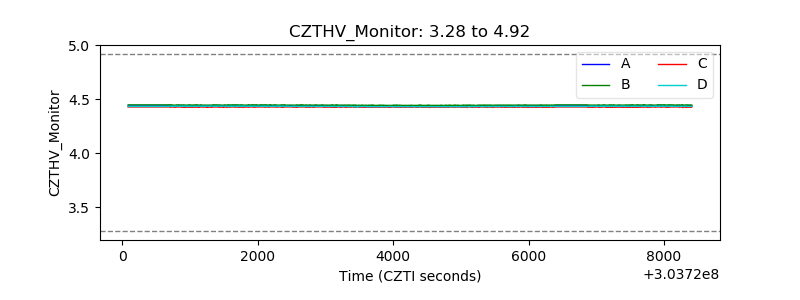 |
| D_VDD | 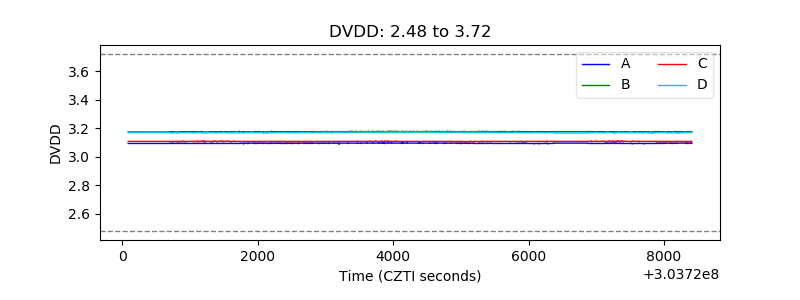 |
| Temperature 1 | 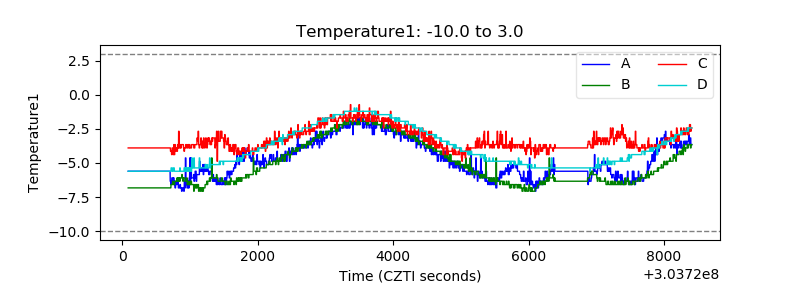 |
| Veto HV Monitor | 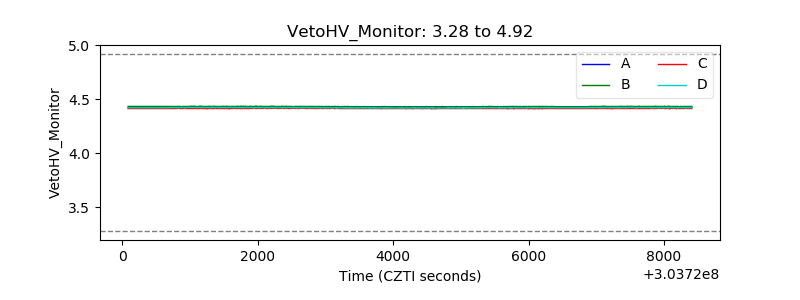 |
| Veto LLD | 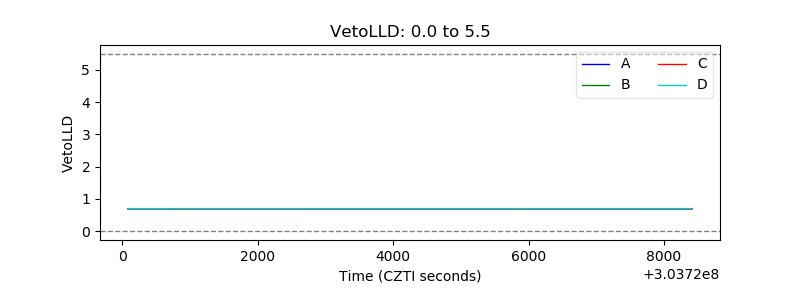 |
| Alpha Counter | 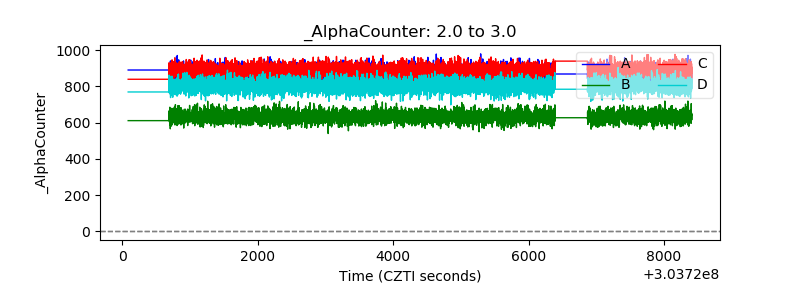 |
| _CPM_Rate | 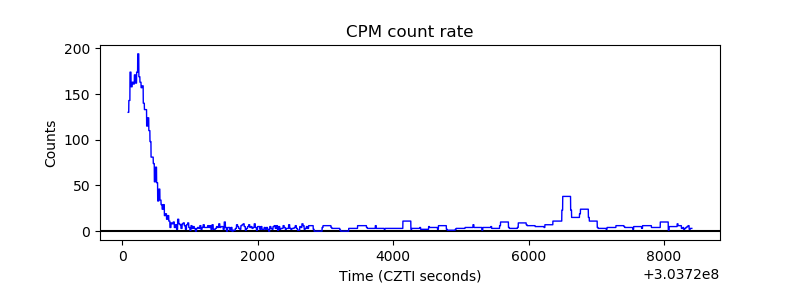 |
| CZT Counter |  |
| +2.5 Volts monitor |  |
| +5 Volts monitor | 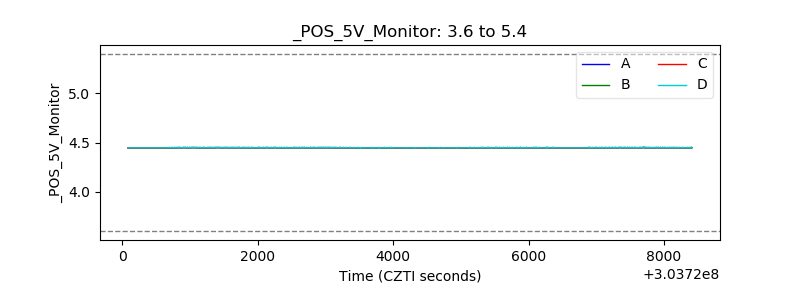 |
| _ROLL_ROT | 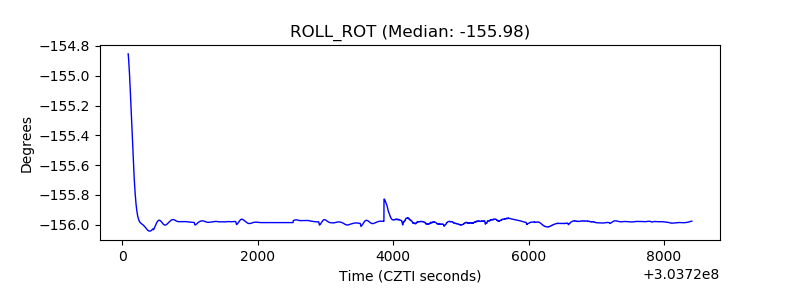 |
| _Roll_DEC | 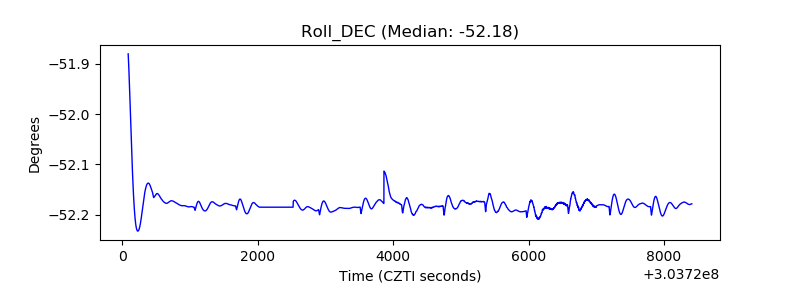 |
| _Roll_RA | 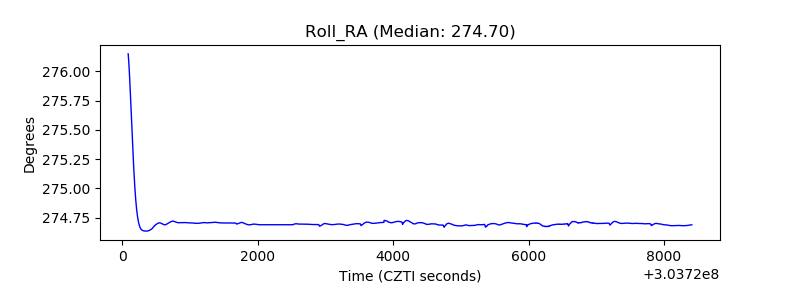 |
| Veto Counter | 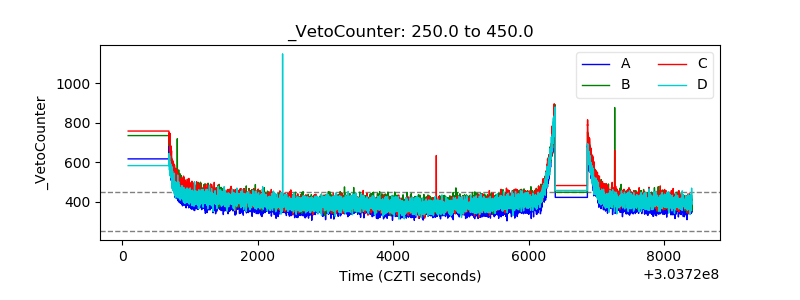 |