| Param | Original file | Final file |
|---|---|---|
| Filename | modeM0/AS1A05_025T18_9000003096_21008cztM0_level2.evt | modeM0/AS1A05_025T18_9000003096_21008cztM0_level2_quad_clean.evt |
| Size (bytes) | 302,788,800 | 66,121,920 |
| Size | 288.8 MB | 63.1 MB |
| Events in quadrant A | 2,071,411 | 423,314 |
| Events in quadrant B | 2,299,669 | 427,908 |
| Events in quadrant C | 2,099,964 | 421,758 |
| Events in quadrant D | 2,387,580 | 408,885 |
| Mode M0 | |||
|---|---|---|---|
| Quadrant | BADHDUFLAG | Total packets | Discarded packets |
| A | 0 | 9364 | 1 |
| B | 0 | 9844 | 1 |
| C | 0 | 9382 | 1 |
| D | 0 | 10245 | 1 |
| Mode M9 | |||
|---|---|---|---|
| Quadrant | BADHDUFLAG | Total packets | Discarded packets |
| A | 0 | 2 | 0 |
| B | 0 | 2 | 0 |
| C | 0 | 2 | 0 |
| D | 0 | 2 | 0 |
| Mode SS | |||
|---|---|---|---|
| Quadrant | BADHDUFLAG | Total packets | Discarded packets |
| A | 0 | 92 | 0 |
| B | 0 | 92 | 0 |
| C | 0 | 92 | 0 |
| D | 0 | 92 | 0 |
| Quadrant | Total seconds | Saturated seconds | Saturation percentage |
|---|---|---|---|
| A | 4559 | 155 | 3.399868% |
| B | 4559 | 170 | 3.728888% |
| C | 4559 | 173 | 3.794692% |
| D | 4559 | 198 | 4.343058% |
Noise dominated data is calculated using 1-second bins in cleaned event files. If a bin has >2000 counts, and if more than 50% of those come from <1% of pixels, then it is considered to be noise-dominated and hence unusable.
| Quadrant | # 1 sec bins | Bins with >0 counts | Bins with >2000 counts | High rate bins dominated by noise | Noise dominated (total time) | Noise dominated (detector-on time) | Marked lightcurve |
|---|---|---|---|---|---|---|---|
| A | 4754 | 4560 | 0 | 0 | 0.00% | 0.00% | 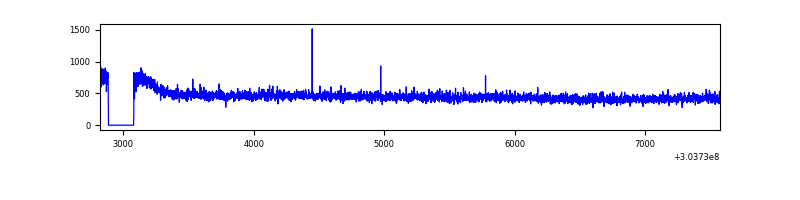 |
| B | 4754 | 4560 | 2 | 2 | 0.04% | 0.04% | 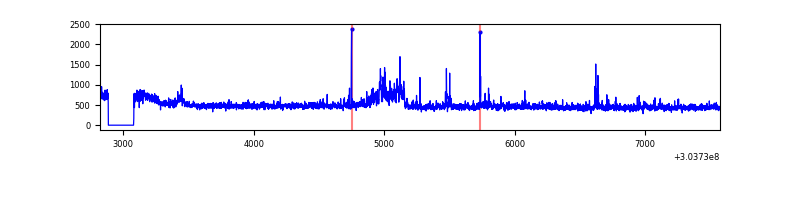 |
| C | 4754 | 4560 | 0 | 0 | 0.00% | 0.00% | 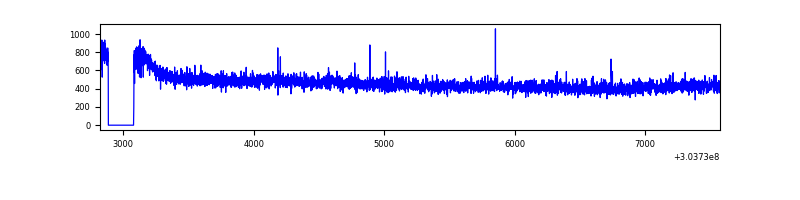 |
| D | 4754 | 4560 | 51 | 51 | 1.07% | 1.12% | 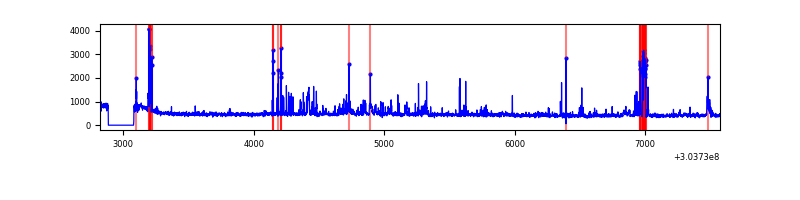 |
Top three noisy pixels from each quadrant. If the there are fewer than three noisy pixels in the level2.evt file, extra rows are filled as -1
| Pixel properties | Quadrant properties | ||||||
|---|---|---|---|---|---|---|---|
| Quadrant | DetID | PixID | Counts | Sigma | Mean | Median | Sigma |
| A | 3 | 137 | 4655 | 37.45 | 538 | 527 | 110.2 |
| A | 0 | 226 | 4653 | 37.43 | 538 | 527 | 110.2 |
| A | 12 | 194 | 3877 | 30.39 | 538 | 527 | 110.2 |
| B | 0 | 189 | 125322 | 1206.79 | 536 | 522 | 103.4 |
| B | 0 | 229 | 17078 | 160.09 | 536 | 522 | 103.4 |
| B | 0 | 182 | 13711 | 127.53 | 536 | 522 | 103.4 |
| C | 14 | 238 | 81090 | 664.58 | 514 | 516 | 121.2 |
| C | 9 | 54 | 4995 | 36.94 | 514 | 516 | 121.2 |
| C | 8 | 128 | 4461 | 32.53 | 514 | 516 | 121.2 |
| D | 15 | 0 | 106491 | 829.5 | 521 | 502 | 127.8 |
| D | 13 | 104 | 77169 | 600.02 | 521 | 502 | 127.8 |
| D | 1 | 52 | 71780 | 557.84 | 521 | 502 | 127.8 |
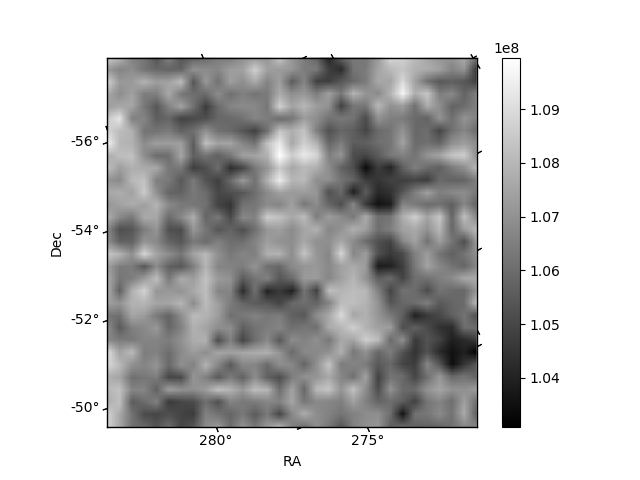
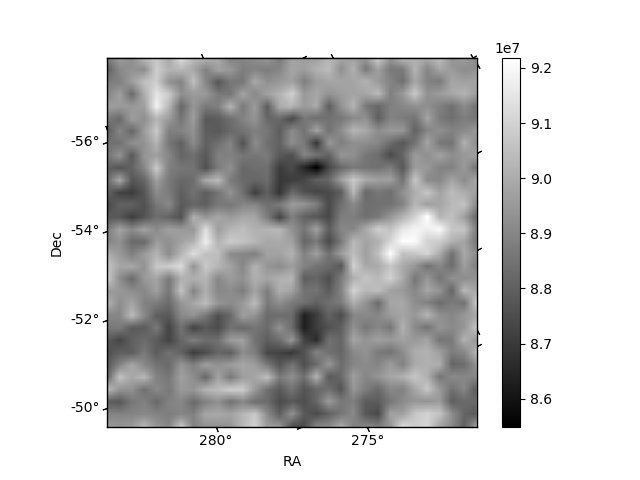
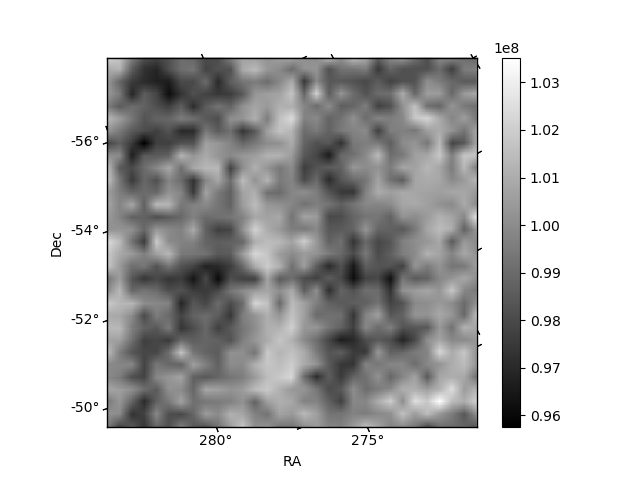
Histogram calculated using DETX and DETY for each event in the final _common_clean file
| Quadrant A | 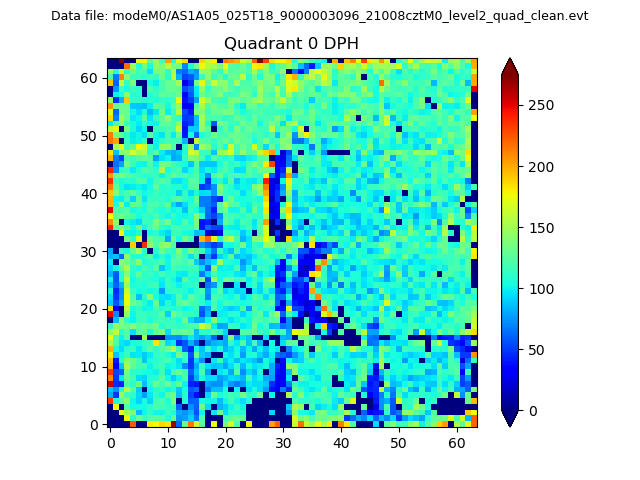 |
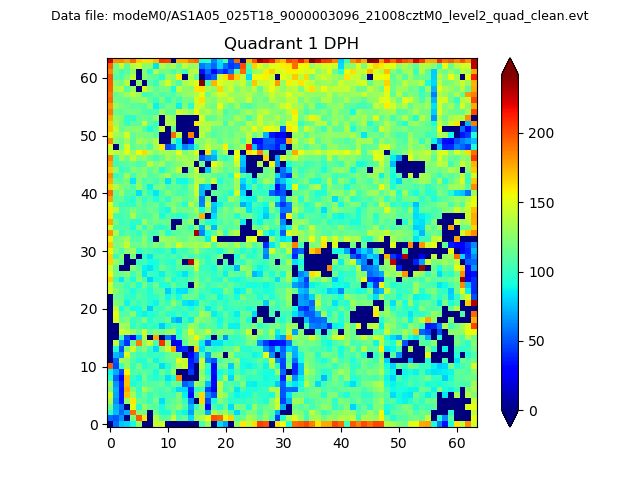 |
Quadrant B |
|---|---|---|---|
| Quadrant D | 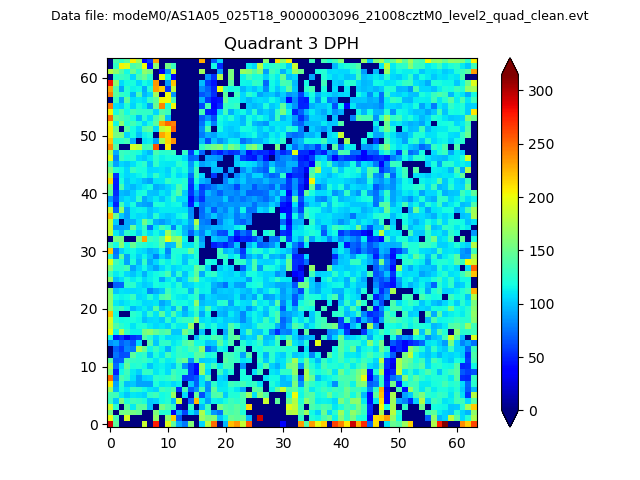 |
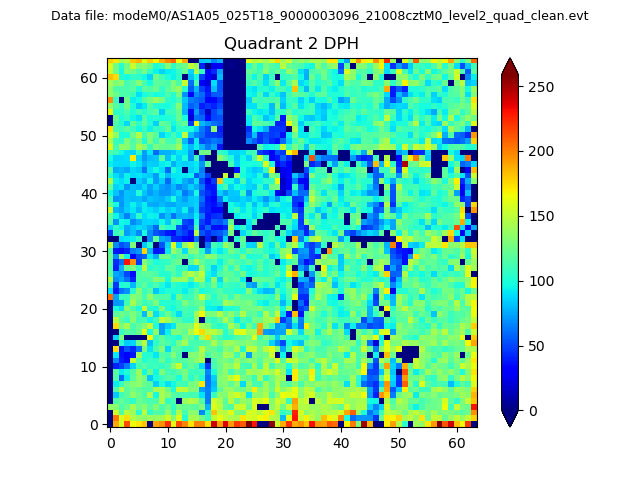 |
Quadrant C |
| Plot type | Count rate plots | Images |
|---|---|---|
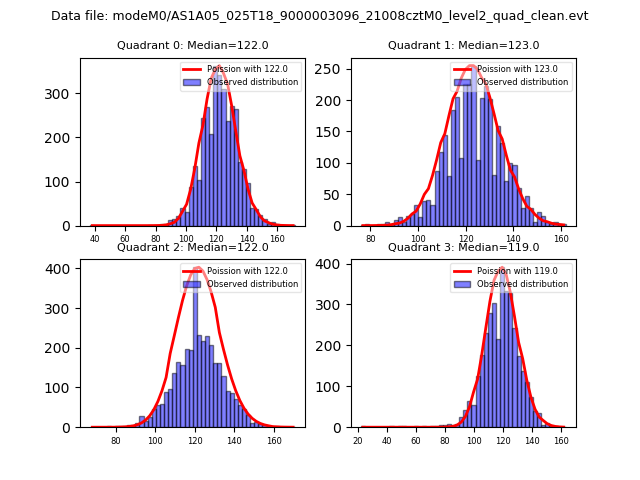
| Comparison with Poisson distribution Blue bars denote a histogram of data divided into 1 sec bins. Red curve is a Poisson curve with rate = median count rate of data. |
 |
 |
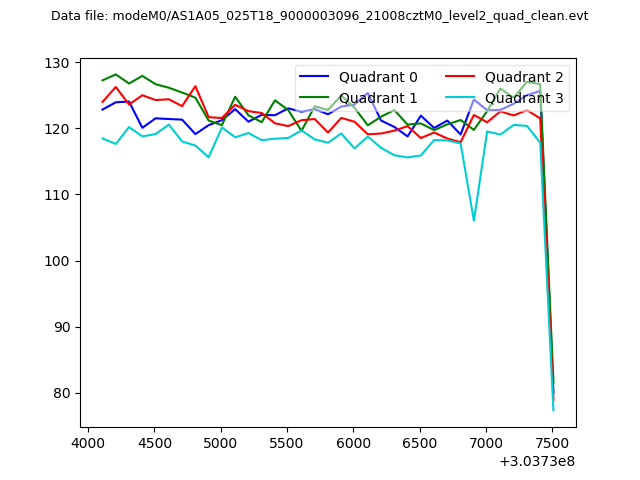
| Quadrant-wise count rates Data is divided into 100 sec bins |
 |
|
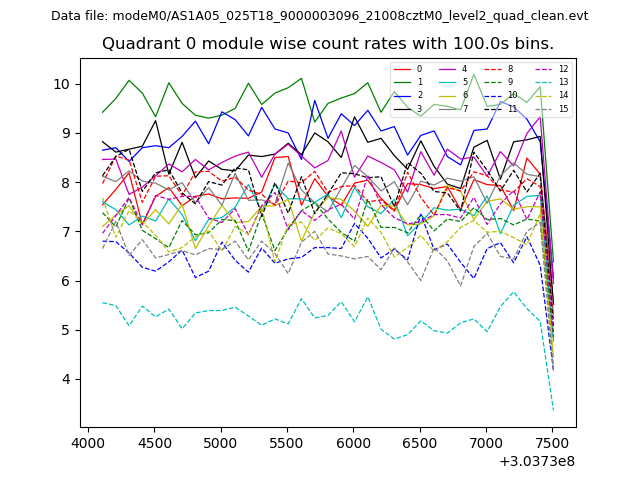
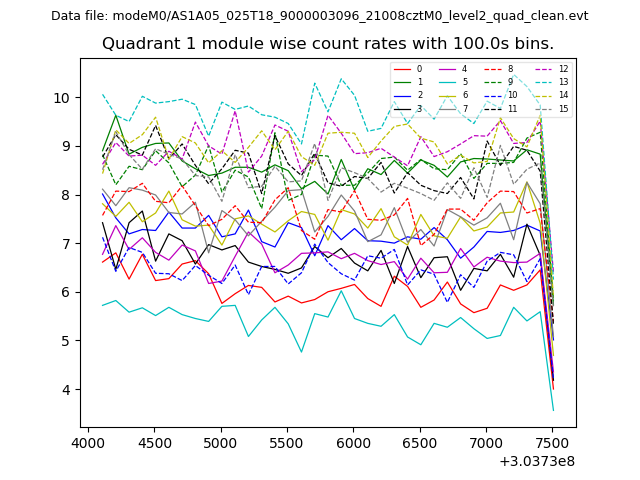
| Module-wise count rates for Quadrant A Data is divided into 100 sec bins |
 |
 |
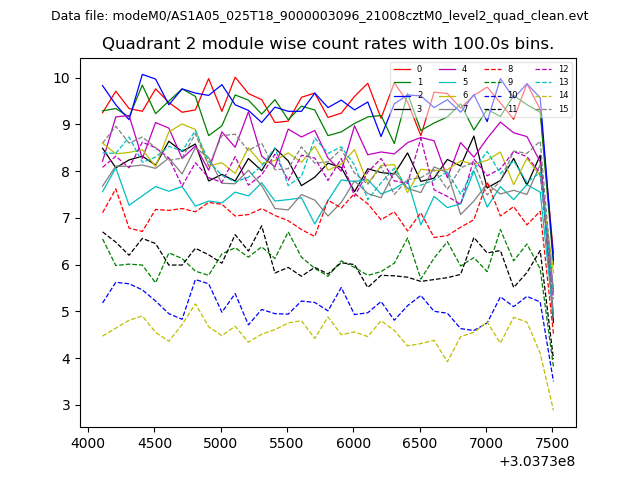
| Module-wise count rates for Quadrant B Data is divided into 100 sec bins |
 |
 |
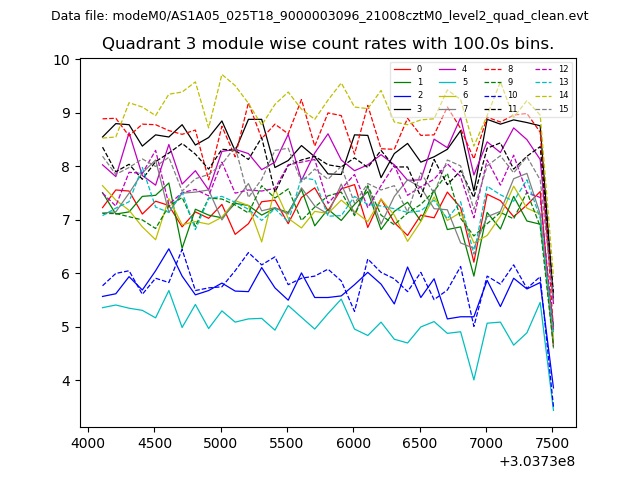
| Module-wise count rates for Quadrant C Data is divided into 100 sec bins |
 |
 |
| Module-wise count rates for Quadrant D Data is divided into 100 sec bins |
 |
 |
| Parameter | Plot |
|---|---|
| CZT HV Monitor | 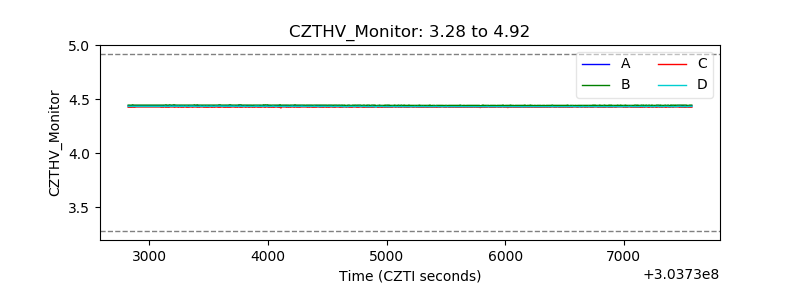 |
| D_VDD | 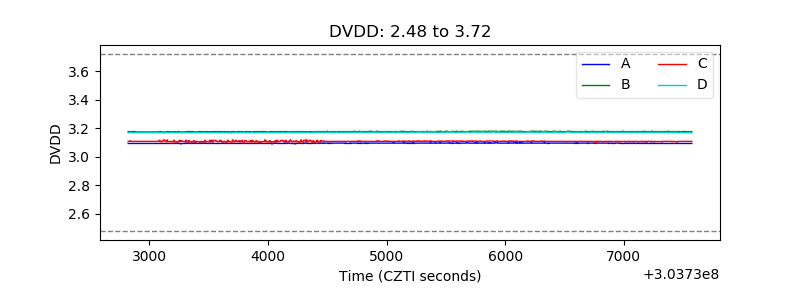 |
| Temperature 1 | 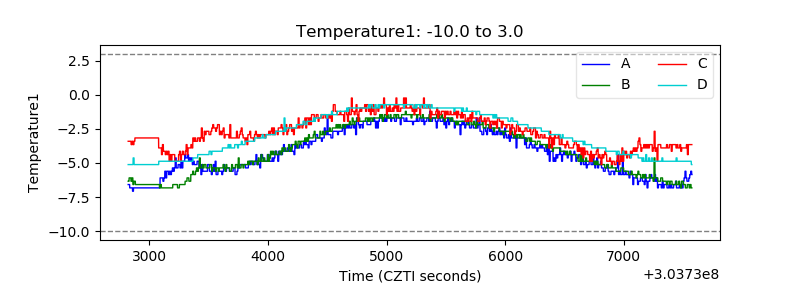 |
| Veto HV Monitor | 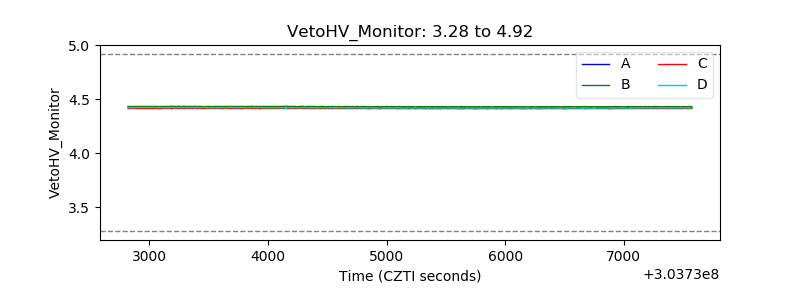 |
| Veto LLD | 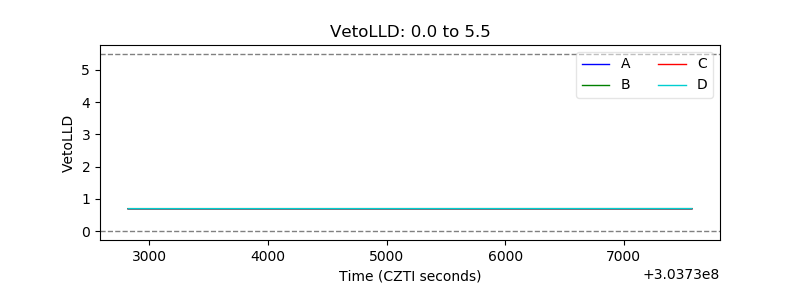 |
| Alpha Counter | 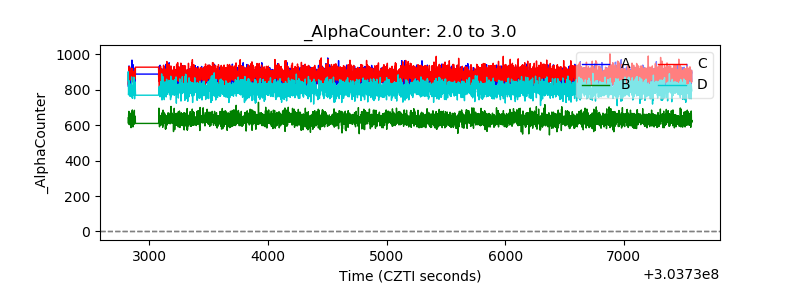 |
| _CPM_Rate | 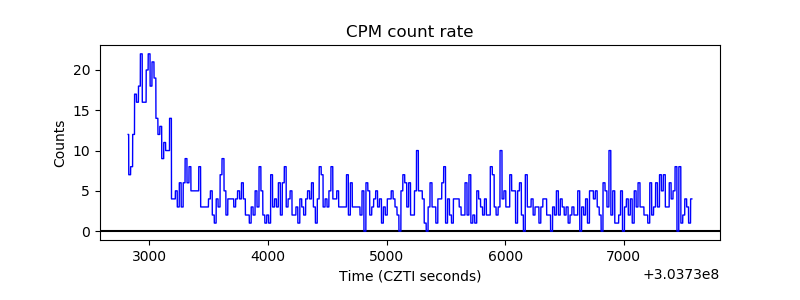 |
| CZT Counter | 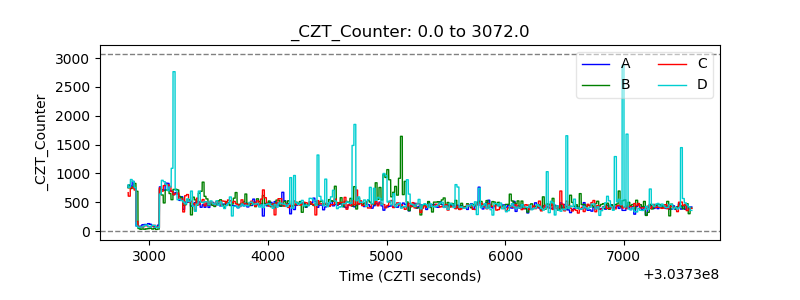 |
| +2.5 Volts monitor |  |
| +5 Volts monitor |  |
| _ROLL_ROT | 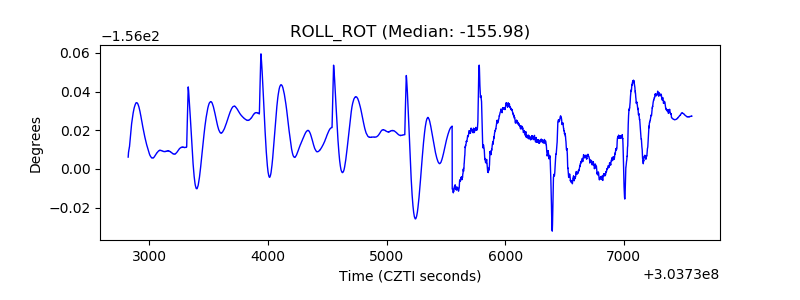 |
| _Roll_DEC | 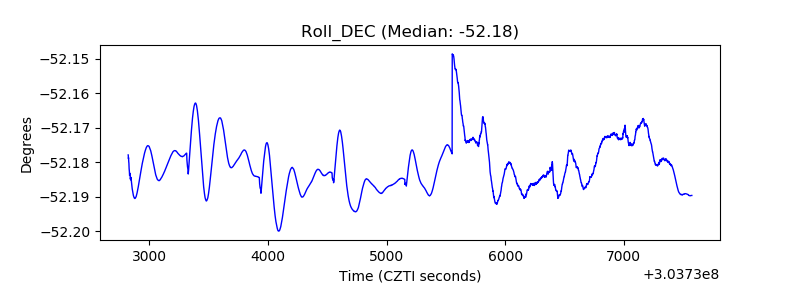 |
| _Roll_RA |  |
| Veto Counter | 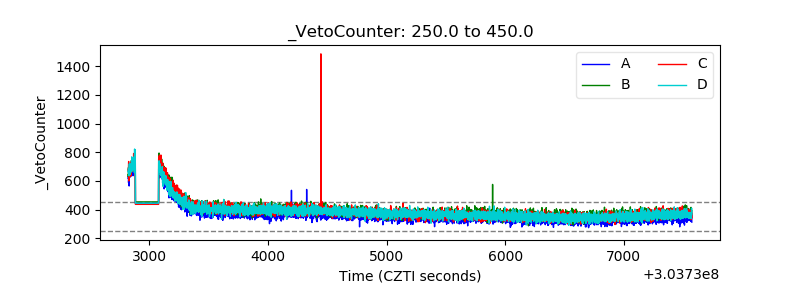 |