| Param | Original file | Final file |
|---|---|---|
| Filename | modeM0/AS1A05_101T08_9000003102cztM0_level2.fits | modeM0/AS1A05_101T08_9000003102cztM0_level2_quad_clean.evt |
| Size (bytes) | 138,795,840 | 67,731,840 |
| Size | 132.4 MB | 64.6 MB |
| Events in quadrant A | 857,942 | 295,039 |
| Events in quadrant B | 838,996 | 296,340 |
| Events in quadrant C | 861,382 | 285,795 |
| Events in quadrant D | 733,378 | 260,132 |
| Mode M0 | |||
|---|---|---|---|
| Quadrant | BADHDUFLAG | Total packets | Discarded packets |
| A | 0 | 27434 | 0 |
| B | 0 | 28665 | 0 |
| C | 0 | 27655 | 0 |
| D | 0 | 30456 | 0 |
| Mode M9 | |||
|---|---|---|---|
| Quadrant | BADHDUFLAG | Total packets | Discarded packets |
| A | 0 | 37 | 0 |
| B | 0 | 37 | 0 |
| C | 0 | 37 | 0 |
| D | 0 | 37 | 0 |
| Mode SS | |||
|---|---|---|---|
| Quadrant | BADHDUFLAG | Total packets | Discarded packets |
| A | 0 | 270 | 0 |
| B | 0 | 270 | 0 |
| C | 0 | 270 | 0 |
| D | 0 | 270 | 0 |
| Quadrant | Total seconds | Saturated seconds | Saturation percentage |
|---|---|---|---|
| A | 13201 | 80 | 0.606015% |
| B | 13201 | 154 | 1.166578% |
| C | 13201 | 112 | 0.848421% |
| D | 13201 | 279 | 2.113476% |
Noise dominated data is calculated using 1-second bins in cleaned event files. If a bin has >2000 counts, and if more than 50% of those come from <1% of pixels, then it is considered to be noise-dominated and hence unusable.
| Quadrant | # 1 sec bins | Bins with >0 counts | Bins with >2000 counts | High rate bins dominated by noise | Noise dominated (total time) | Noise dominated (detector-on time) | Marked lightcurve |
|---|---|---|---|---|---|---|---|
| A | 16911 | 13201 | 0 | 0 | 0.00% | 0.00% |  |
| B | 16911 | 13201 | 0 | 0 | 0.00% | 0.00% |  |
| C | 16911 | 13201 | 0 | 0 | 0.00% | 0.00% |  |
| D | 16911 | 13200 | 0 | 0 | 0.00% | 0.00% | 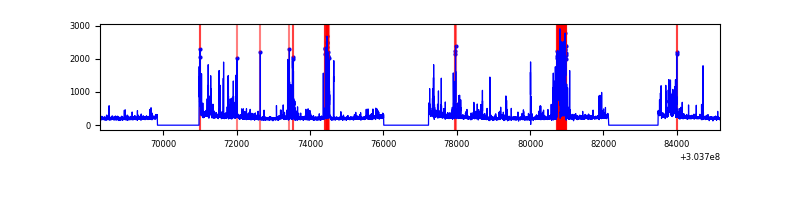 |
Top three noisy pixels from each quadrant. If the there are fewer than three noisy pixels in the level2.evt file, extra rows are filled as -1
| Pixel properties | Quadrant properties | ||||||
|---|---|---|---|---|---|---|---|
| Quadrant | DetID | PixID | Counts | Sigma | Mean | Median | Sigma |
| A | 0 | 29 | 773 | 9.86 | 223 | 210 | 57.1 |
| A | 7 | 110 | 668 | 8.02 | 223 | 210 | 57.1 |
| A | 0 | 30 | 644 | 7.6 | 223 | 210 | 57.1 |
| B | 2 | 9 | 671 | 10.17 | 221 | 213 | 45.0 |
| B | 3 | 17 | 554 | 7.57 | 221 | 213 | 45.0 |
| B | 5 | 225 | 549 | 7.46 | 221 | 213 | 45.0 |
| C | 1 | 80 | 671 | 7.58 | 227 | 214 | 60.3 |
| C | 1 | 81 | 643 | 7.11 | 227 | 214 | 60.3 |
| C | 9 | 209 | 613 | 6.62 | 227 | 214 | 60.3 |
| D | 6 | 231 | 515 | 5.72 | 209 | 191 | 56.6 |
| D | 6 | 38 | 512 | 5.67 | 209 | 191 | 56.6 |
| D | 3 | 14 | 505 | 5.55 | 209 | 191 | 56.6 |
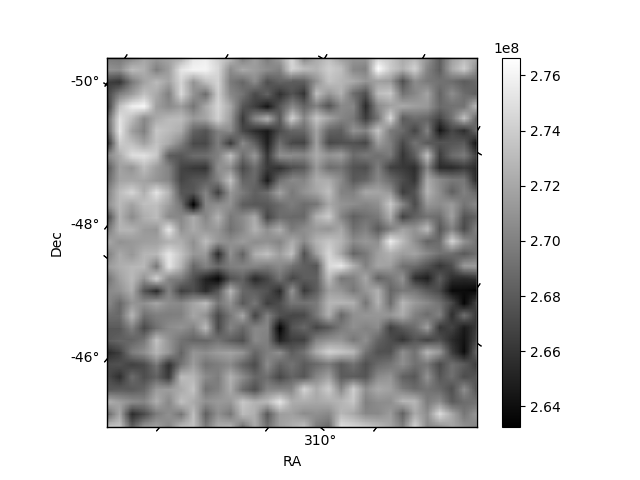
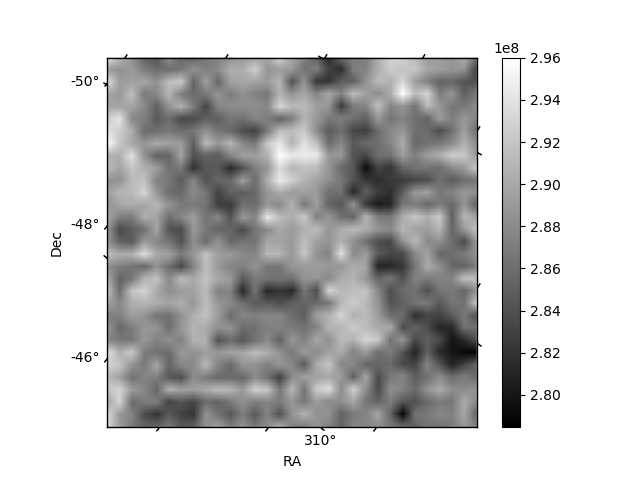
Histogram calculated using DETX and DETY for each event in the final _common_clean file
| Quadrant A | 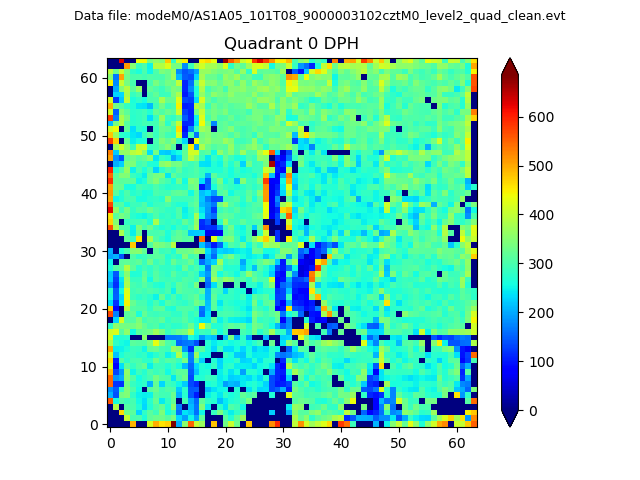 |
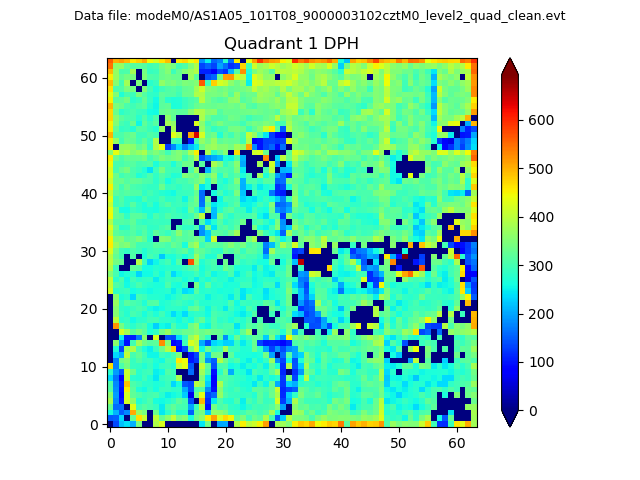 |
Quadrant B |
|---|---|---|---|
| Quadrant D |  |
 |
Quadrant C |
| Plot type | Count rate plots | Images |
|---|---|---|
| Comparison with Poisson distribution Blue bars denote a histogram of data divided into 1 sec bins. Red curve is a Poisson curve with rate = median count rate of data. |
 |
 |
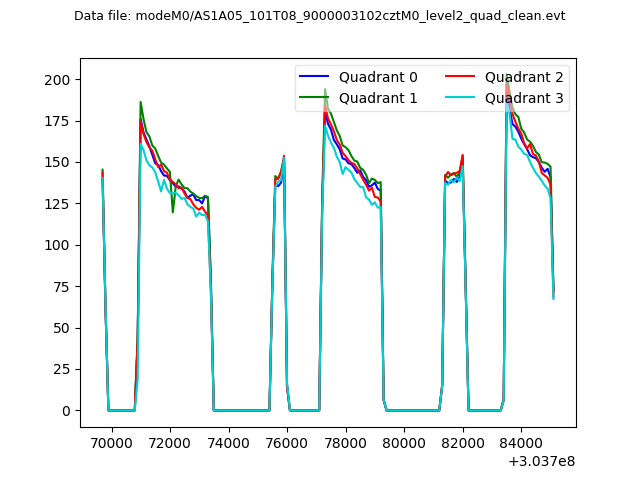
| Quadrant-wise count rates Data is divided into 100 sec bins |
 |
|
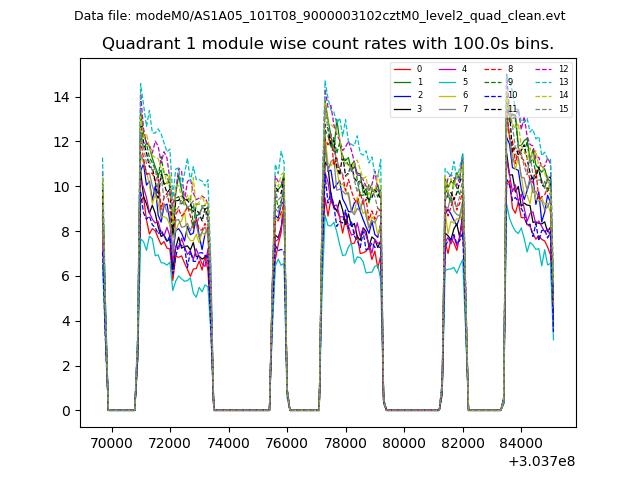
| Module-wise count rates for Quadrant A Data is divided into 100 sec bins |
 |
 |
| Module-wise count rates for Quadrant B Data is divided into 100 sec bins |
 |
 |
| Module-wise count rates for Quadrant C Data is divided into 100 sec bins |
 |
 |
| Module-wise count rates for Quadrant D Data is divided into 100 sec bins |
 |
 |
| Parameter | Plot |
|---|---|
| CZT HV Monitor | 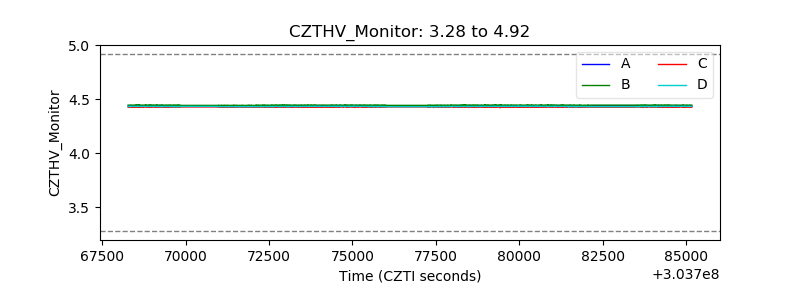 |
| D_VDD |  |
| Temperature 1 | 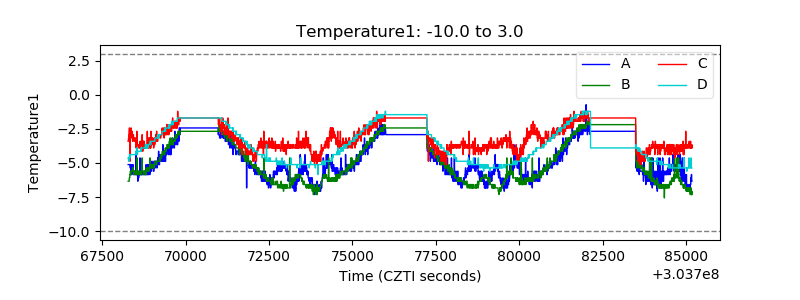 |
| Veto HV Monitor |  |
| Veto LLD | 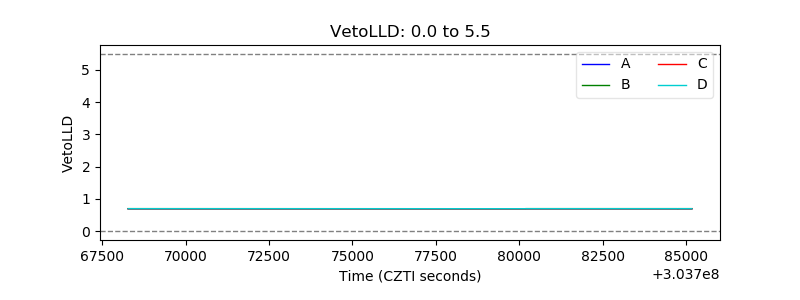 |
| Alpha Counter |  |
| _CPM_Rate |  |
| CZT Counter |  |
| +2.5 Volts monitor | 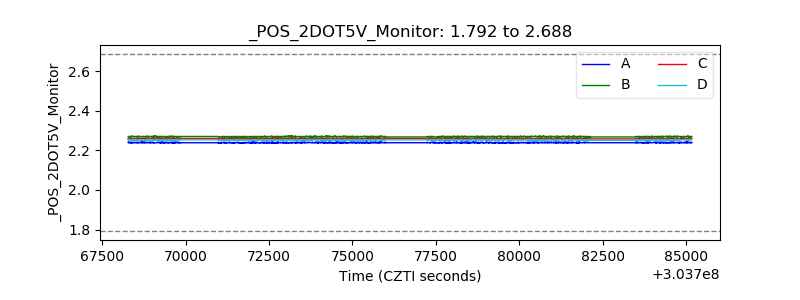 |
| +5 Volts monitor |  |
| _ROLL_ROT | 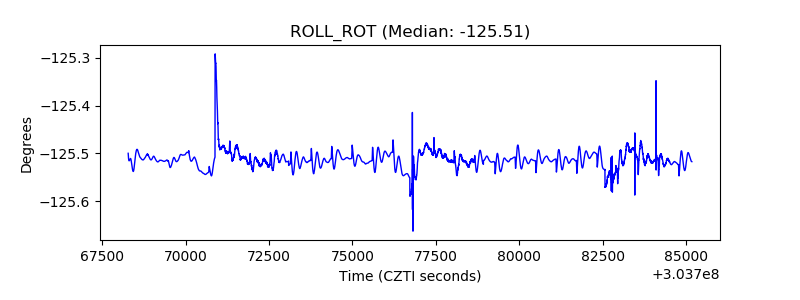 |
| _Roll_DEC | 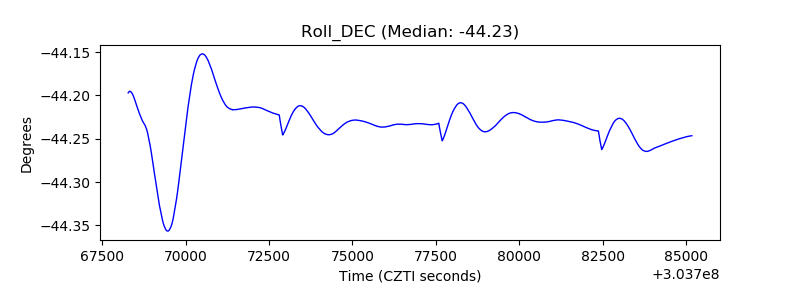 |
| _Roll_RA | 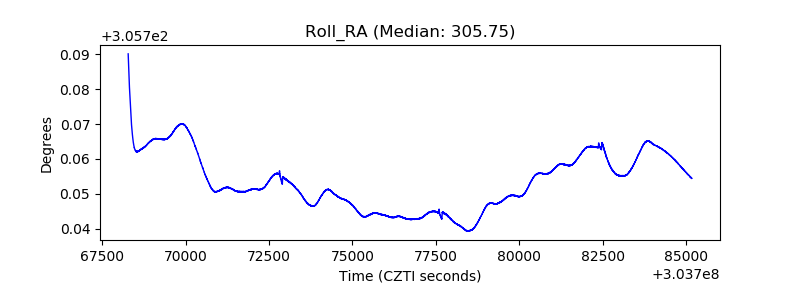 |
| Veto Counter |  |