| Param | Original file | Final file |
|---|---|---|
| Filename | modeM0/AS1A05_101T08_9000003102_21014cztM0_level2.evt | modeM0/AS1A05_101T08_9000003102_21014cztM0_level2_quad_clean.evt |
| Size (bytes) | 211,152,960 | 35,208,000 |
| Size | 201.4 MB | 33.6 MB |
| Events in quadrant A | 1,462,887 | 216,431 |
| Events in quadrant B | 1,639,671 | 223,273 |
| Events in quadrant C | 1,485,825 | 217,516 |
| Events in quadrant D | 1,609,693 | 203,850 |
| Mode M0 | |||
|---|---|---|---|
| Quadrant | BADHDUFLAG | Total packets | Discarded packets |
| A | 0 | 6070 | 1 |
| B | 0 | 6583 | 1 |
| C | 0 | 6043 | 1 |
| D | 0 | 6559 | 1 |
| Mode M9 | |||
|---|---|---|---|
| Quadrant | BADHDUFLAG | Total packets | Discarded packets |
| A | 0 | 11 | 0 |
| B | 0 | 11 | 0 |
| C | 0 | 11 | 0 |
| D | 0 | 11 | 0 |
| Mode SS | |||
|---|---|---|---|
| Quadrant | BADHDUFLAG | Total packets | Discarded packets |
| A | 0 | 60 | 0 |
| B | 0 | 60 | 0 |
| C | 0 | 60 | 0 |
| D | 0 | 60 | 0 |
| Quadrant | Total seconds | Saturated seconds | Saturation percentage |
|---|---|---|---|
| A | 2863 | 27 | 0.943067% |
| B | 2863 | 76 | 2.654558% |
| C | 2863 | 32 | 1.117709% |
| D | 2863 | 50 | 1.746420% |
Noise dominated data is calculated using 1-second bins in cleaned event files. If a bin has >2000 counts, and if more than 50% of those come from <1% of pixels, then it is considered to be noise-dominated and hence unusable.
| Quadrant | # 1 sec bins | Bins with >0 counts | Bins with >2000 counts | High rate bins dominated by noise | Noise dominated (total time) | Noise dominated (detector-on time) | Marked lightcurve |
|---|---|---|---|---|---|---|---|
| A | 3998 | 2864 | 0 | 0 | 0.00% | 0.00% | 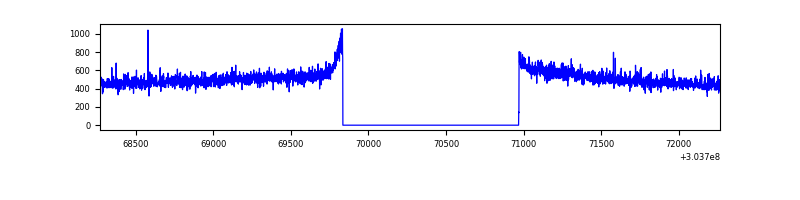 |
| B | 3998 | 2864 | 30 | 30 | 0.75% | 1.05% | 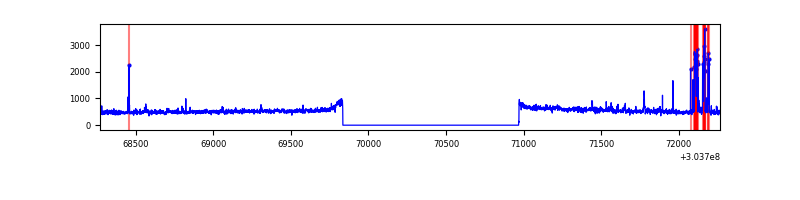 |
| C | 3998 | 2864 | 0 | 0 | 0.00% | 0.00% | 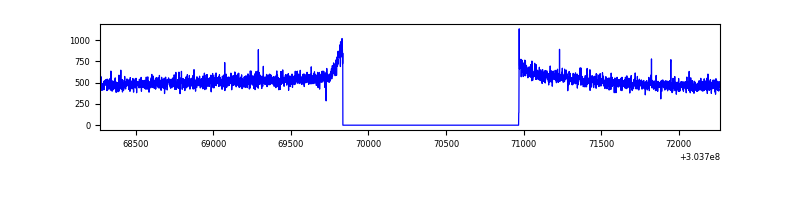 |
| D | 3998 | 2864 | 32 | 32 | 0.80% | 1.12% | 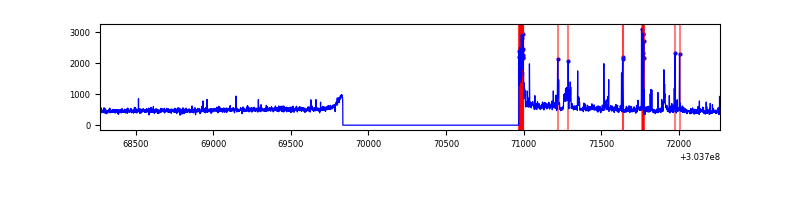 |
Top three noisy pixels from each quadrant. If the there are fewer than three noisy pixels in the level2.evt file, extra rows are filled as -1
| Pixel properties | Quadrant properties | ||||||
|---|---|---|---|---|---|---|---|
| Quadrant | DetID | PixID | Counts | Sigma | Mean | Median | Sigma |
| A | 0 | 226 | 3370 | 38.69 | 379 | 372 | 77.5 |
| A | 3 | 137 | 3240 | 37.01 | 379 | 372 | 77.5 |
| A | 12 | 194 | 2766 | 30.9 | 379 | 372 | 77.5 |
| B | 7 | 220 | 102479 | 1400.61 | 379 | 370 | 72.9 |
| B | 0 | 189 | 28012 | 379.16 | 379 | 370 | 72.9 |
| B | 12 | 111 | 8780 | 115.36 | 379 | 370 | 72.9 |
| C | 14 | 238 | 56933 | 653.58 | 365 | 368 | 86.5 |
| C | 9 | 54 | 3345 | 34.4 | 365 | 368 | 86.5 |
| C | 13 | 61 | 2561 | 25.34 | 365 | 368 | 86.5 |
| D | 1 | 52 | 58632 | 650.19 | 365 | 354 | 89.6 |
| D | 7 | 238 | 55362 | 613.71 | 365 | 354 | 89.6 |
| D | 13 | 200 | 36494 | 403.2 | 365 | 354 | 89.6 |
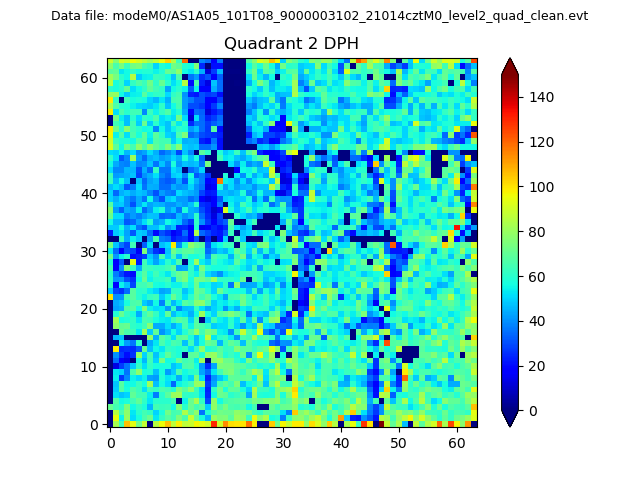
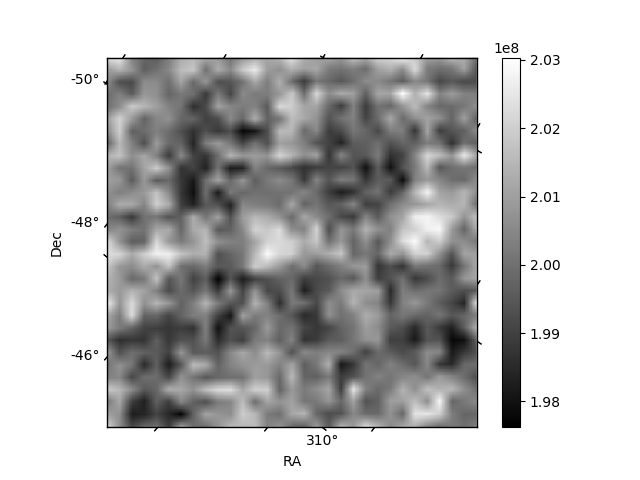
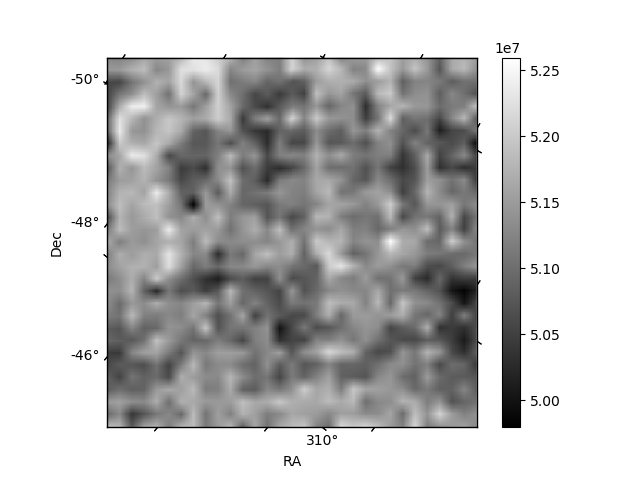
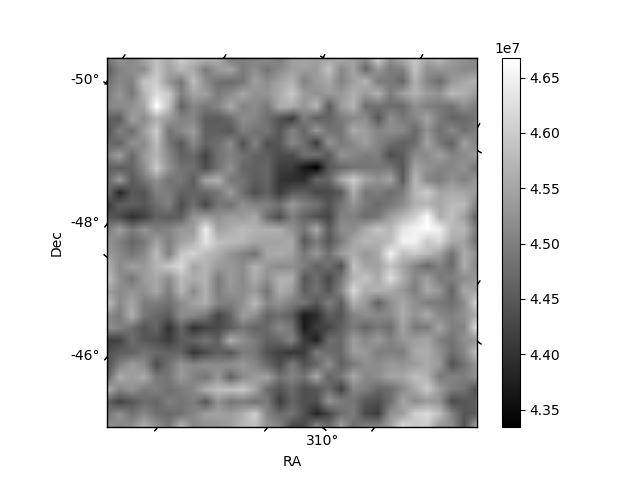
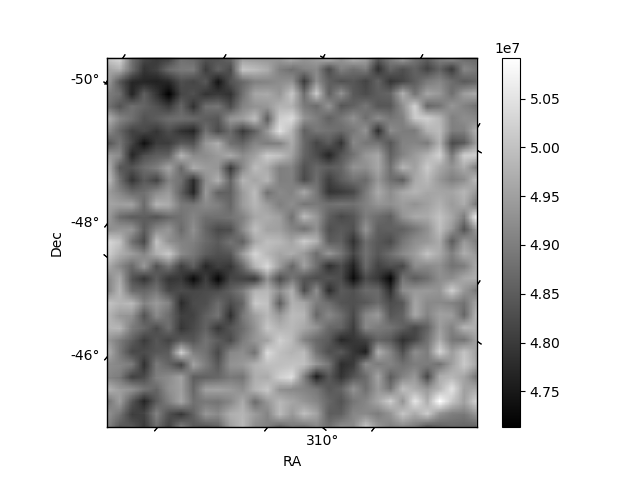
Histogram calculated using DETX and DETY for each event in the final _common_clean file
| Quadrant A | 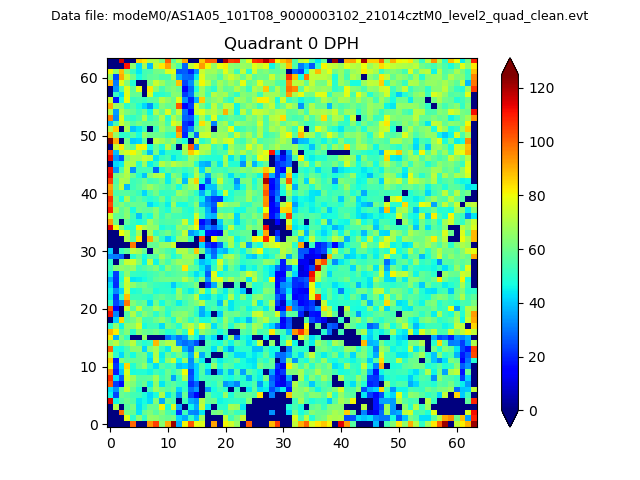 |
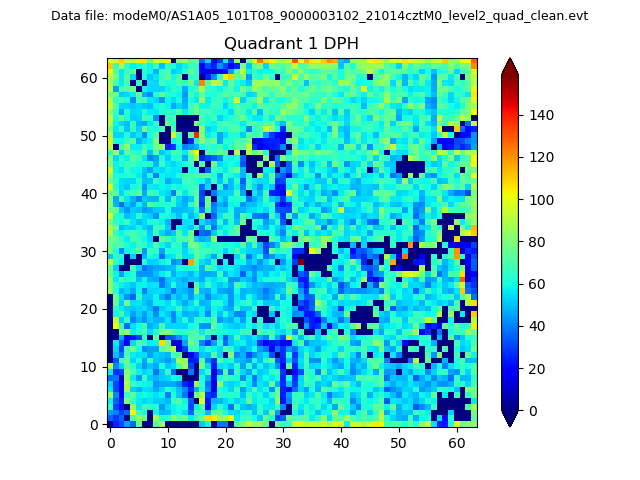 |
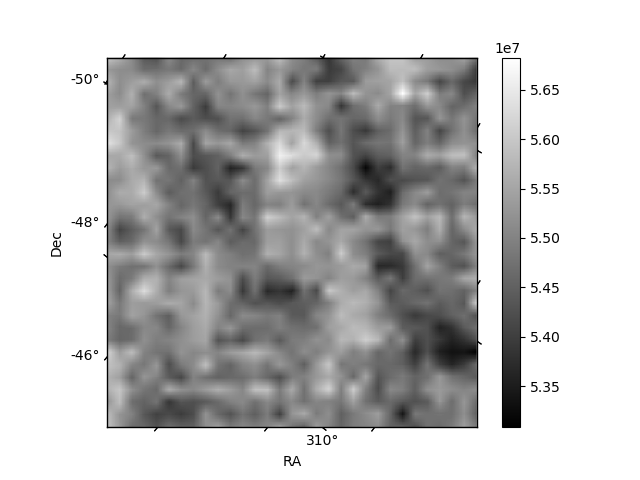
Quadrant B |
|---|---|---|---|
| Quadrant D | 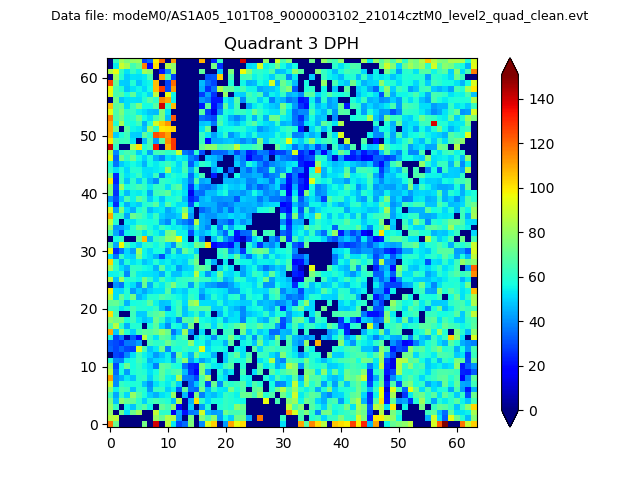 |
 |
Quadrant C |
| Plot type | Count rate plots | Images |
|---|---|---|
| Comparison with Poisson distribution Blue bars denote a histogram of data divided into 1 sec bins. Red curve is a Poisson curve with rate = median count rate of data. |
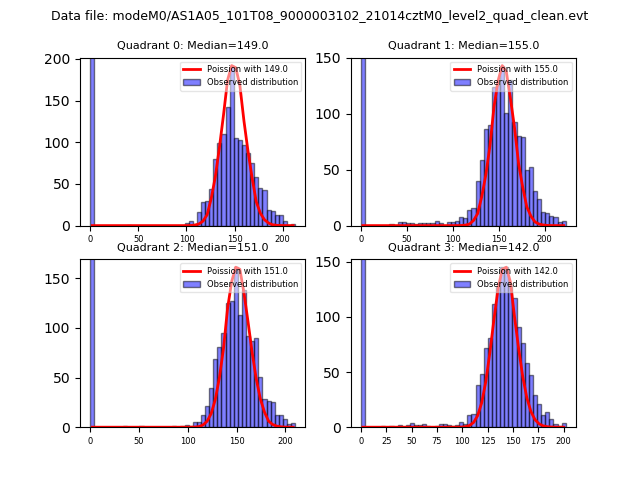 |
 |
| Quadrant-wise count rates Data is divided into 100 sec bins |
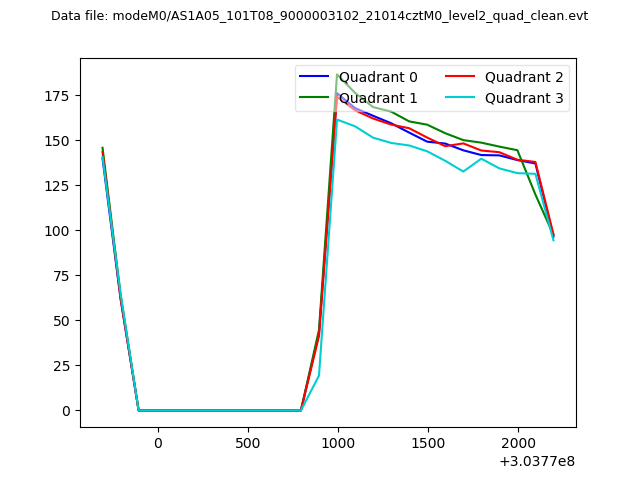 |
|
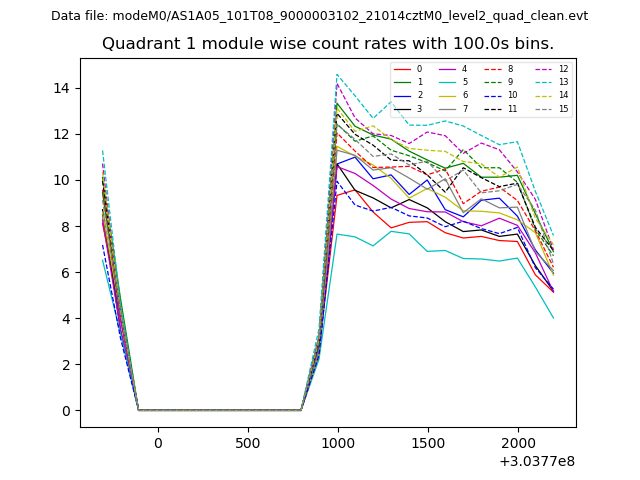
| Module-wise count rates for Quadrant A Data is divided into 100 sec bins |
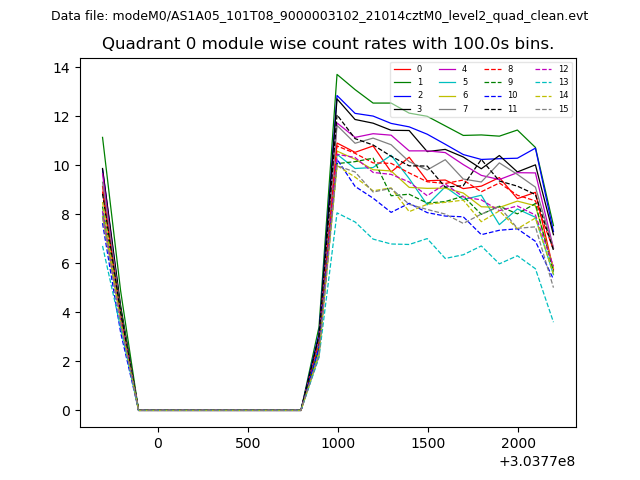 |
 |
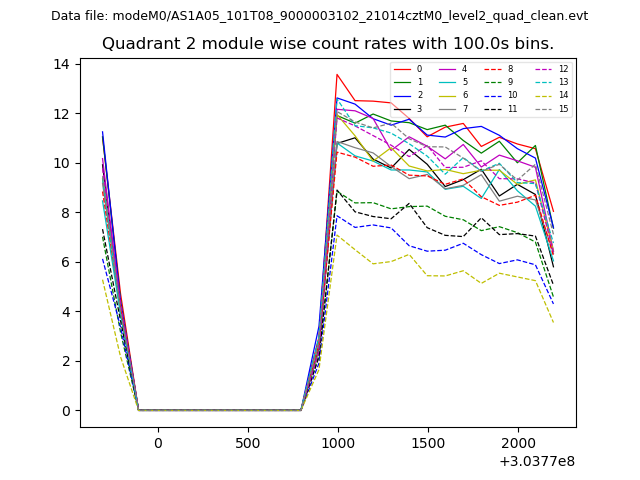
| Module-wise count rates for Quadrant B Data is divided into 100 sec bins |
 |
 |
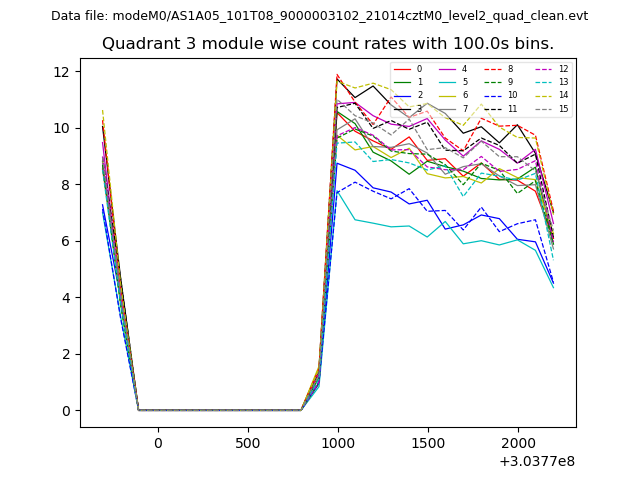
| Module-wise count rates for Quadrant C Data is divided into 100 sec bins |
 |
 |
| Module-wise count rates for Quadrant D Data is divided into 100 sec bins |
 |
 |
| Parameter | Plot |
|---|---|
| CZT HV Monitor | 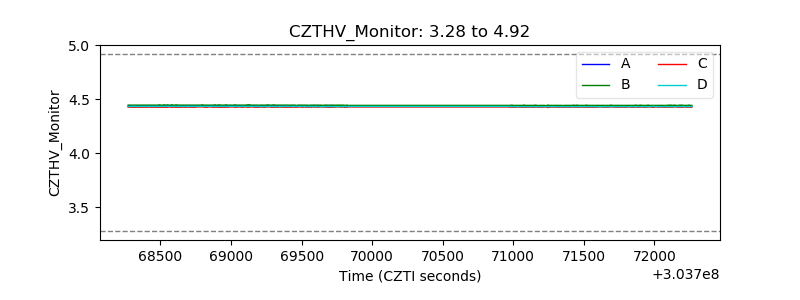 |
| D_VDD |  |
| Temperature 1 | 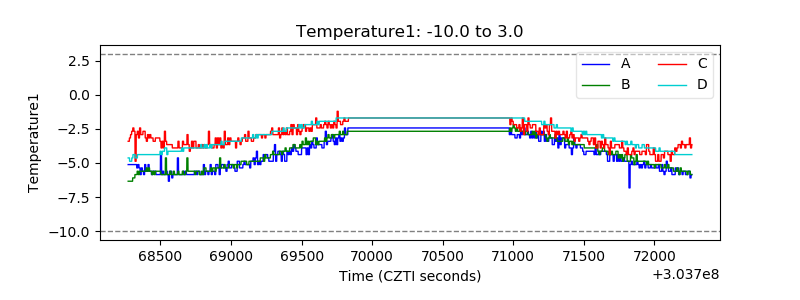 |
| Veto HV Monitor | 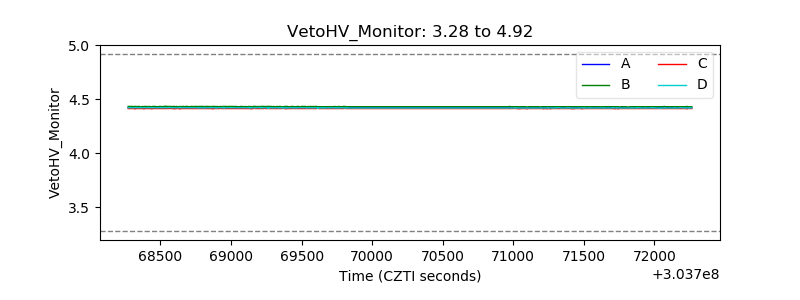 |
| Veto LLD | 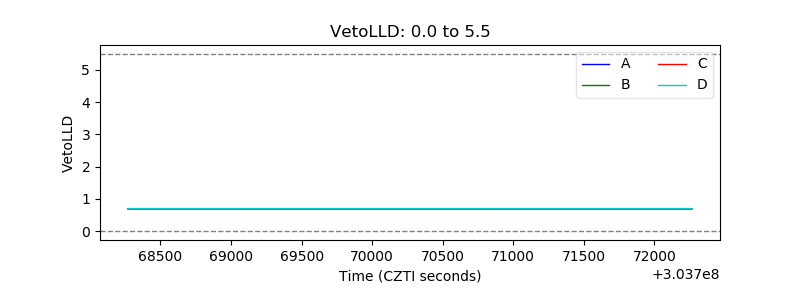 |
| Alpha Counter | 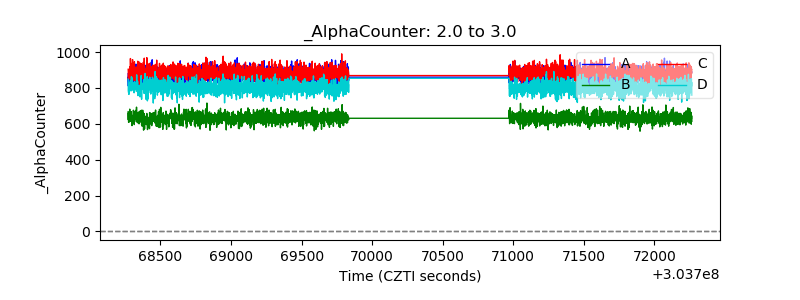 |
| _CPM_Rate | 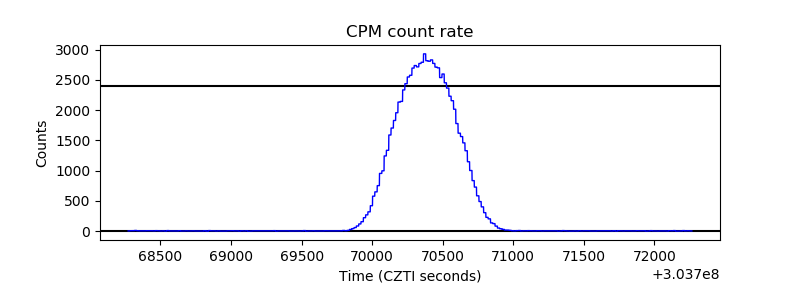 |
| CZT Counter | 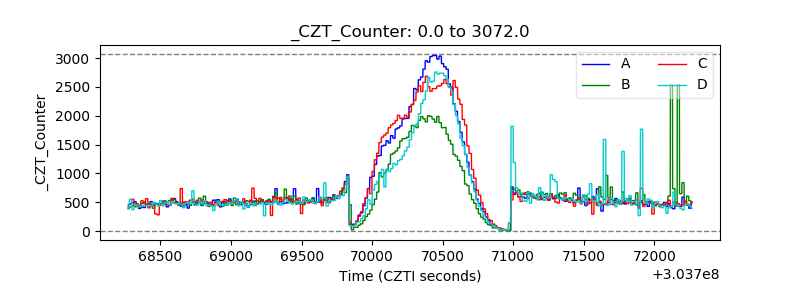 |
| +2.5 Volts monitor |  |
| +5 Volts monitor |  |
| _ROLL_ROT | 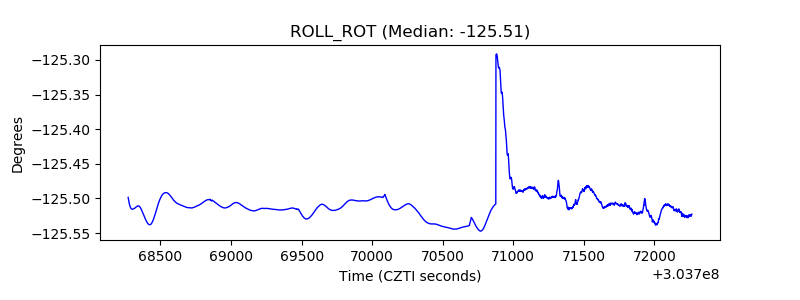 |
| _Roll_DEC | 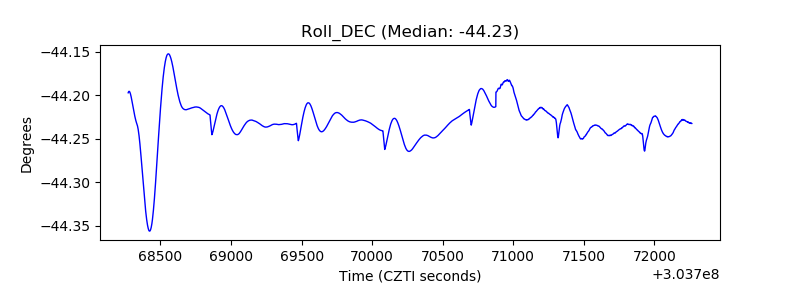 |
| _Roll_RA | 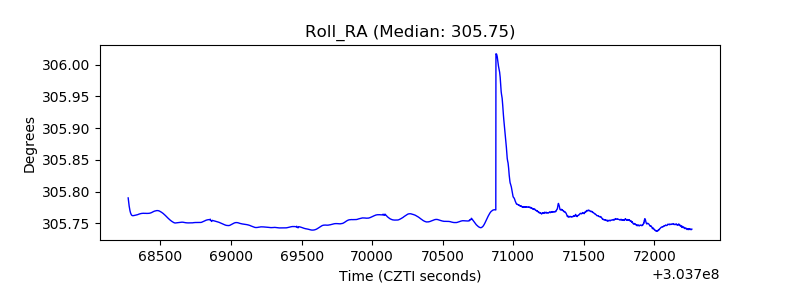 |
| Veto Counter | 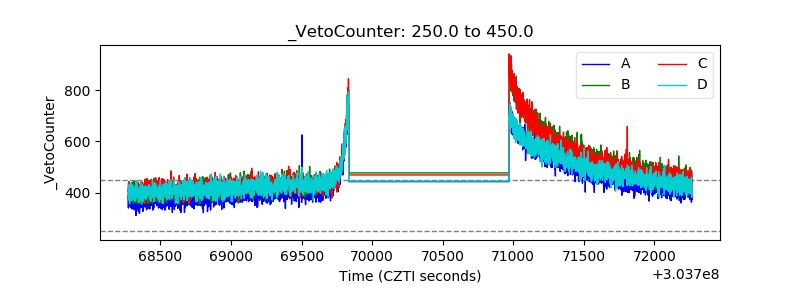 |