| Param | Original file | Final file |
|---|---|---|
| Filename | modeM0/AS1A05_101T08_9000003102_21015cztM0_level2.evt | modeM0/AS1A05_101T08_9000003102_21015cztM0_level2_quad_clean.evt |
| Size (bytes) | 456,526,080 | 99,840,960 |
| Size | 435.4 MB | 95.2 MB |
| Events in quadrant A | 3,149,403 | 644,819 |
| Events in quadrant B | 3,399,798 | 667,363 |
| Events in quadrant C | 3,245,463 | 646,236 |
| Events in quadrant D | 3,589,399 | 611,796 |
| Mode M0 | |||
|---|---|---|---|
| Quadrant | BADHDUFLAG | Total packets | Discarded packets |
| A | 0 | 13551 | 2 |
| B | 0 | 14247 | 2 |
| C | 0 | 13647 | 2 |
| D | 0 | 14940 | 2 |
| Mode M9 | |||
|---|---|---|---|
| Quadrant | BADHDUFLAG | Total packets | Discarded packets |
| A | 0 | 18 | 0 |
| B | 0 | 19 | 0 |
| C | 0 | 19 | 0 |
| D | 0 | 19 | 0 |
| Mode SS | |||
|---|---|---|---|
| Quadrant | BADHDUFLAG | Total packets | Discarded packets |
| A | 0 | 134 | 0 |
| B | 0 | 134 | 0 |
| C | 0 | 134 | 0 |
| D | 0 | 134 | 0 |
| Quadrant | Total seconds | Saturated seconds | Saturation percentage |
|---|---|---|---|
| A | 6496 | 44 | 0.677340% |
| B | 6496 | 93 | 1.431650% |
| C | 6496 | 64 | 0.985222% |
| D | 6496 | 129 | 1.985837% |
Noise dominated data is calculated using 1-second bins in cleaned event files. If a bin has >2000 counts, and if more than 50% of those come from <1% of pixels, then it is considered to be noise-dominated and hence unusable.
| Quadrant | # 1 sec bins | Bins with >0 counts | Bins with >2000 counts | High rate bins dominated by noise | Noise dominated (total time) | Noise dominated (detector-on time) | Marked lightcurve |
|---|---|---|---|---|---|---|---|
| A | 7721 | 6497 | 0 | 0 | 0.00% | 0.00% | 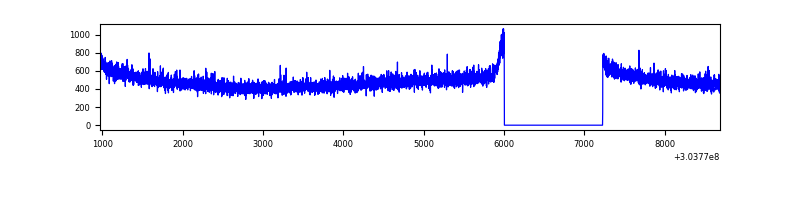 |
| B | 7721 | 6497 | 29 | 29 | 0.38% | 0.45% | 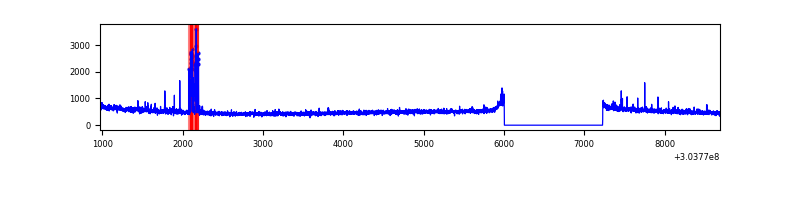 |
| C | 7721 | 6497 | 0 | 0 | 0.00% | 0.00% | 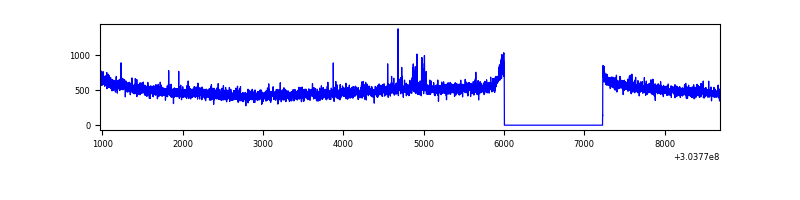 |
| D | 7721 | 6497 | 97 | 97 | 1.26% | 1.49% | 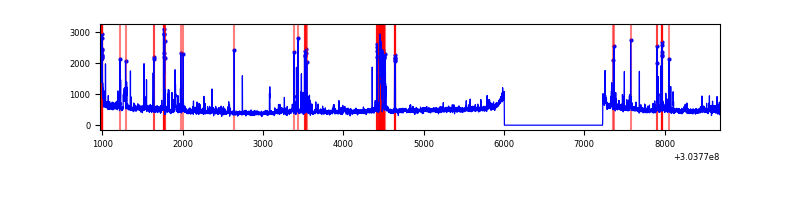 |
Top three noisy pixels from each quadrant. If the there are fewer than three noisy pixels in the level2.evt file, extra rows are filled as -1
| Pixel properties | Quadrant properties | ||||||
|---|---|---|---|---|---|---|---|
| Quadrant | DetID | PixID | Counts | Sigma | Mean | Median | Sigma |
| A | 0 | 226 | 7028 | 38.05 | 817 | 802 | 163.6 |
| A | 3 | 137 | 6669 | 35.85 | 817 | 802 | 163.6 |
| A | 12 | 194 | 5749 | 30.23 | 817 | 802 | 163.6 |
| B | 7 | 220 | 110370 | 715.79 | 824 | 805 | 153.1 |
| B | 0 | 189 | 22070 | 138.93 | 824 | 805 | 153.1 |
| B | 12 | 111 | 18328 | 114.48 | 824 | 805 | 153.1 |
| C | 14 | 238 | 125956 | 679.53 | 792 | 800 | 184.2 |
| C | 9 | 54 | 31009 | 164.02 | 792 | 800 | 184.2 |
| C | 13 | 61 | 5596 | 26.04 | 792 | 800 | 184.2 |
| D | 1 | 52 | 292897 | 1539.07 | 786 | 768 | 189.8 |
| D | 2 | 16 | 108065 | 565.29 | 786 | 768 | 189.8 |
| D | 7 | 238 | 64455 | 335.53 | 786 | 768 | 189.8 |
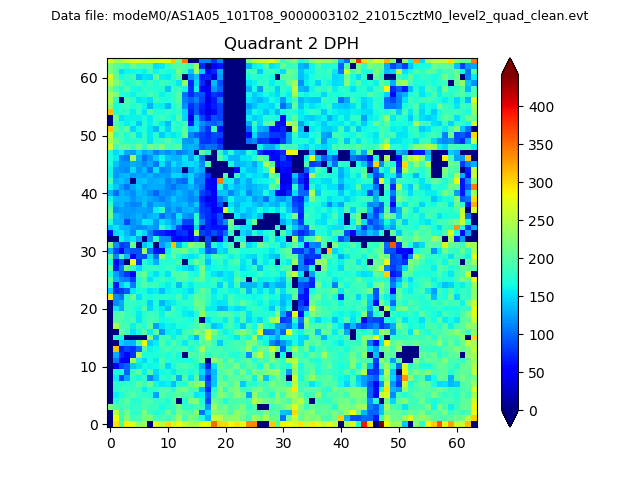
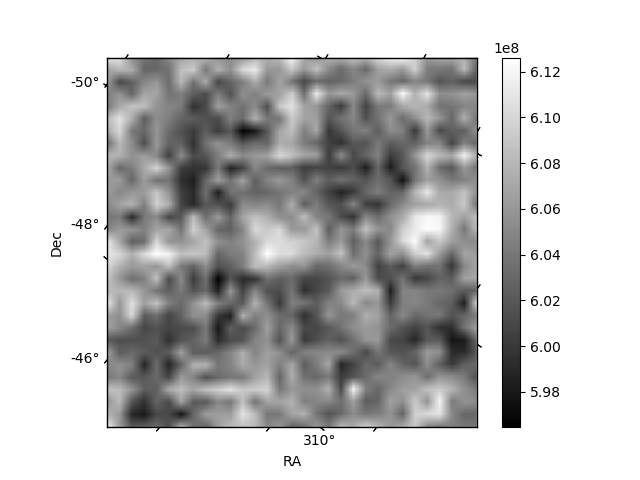
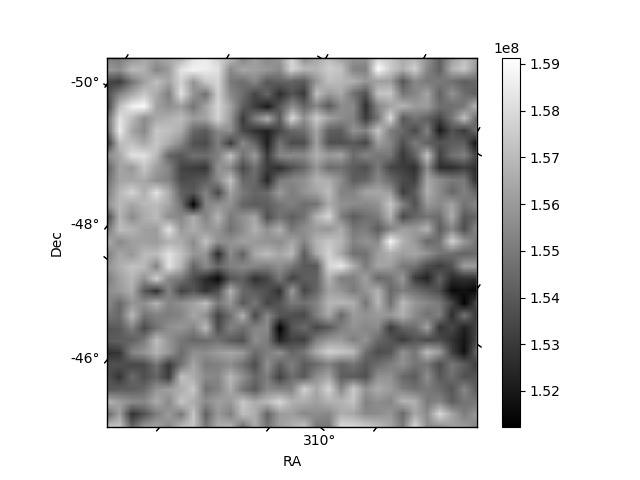
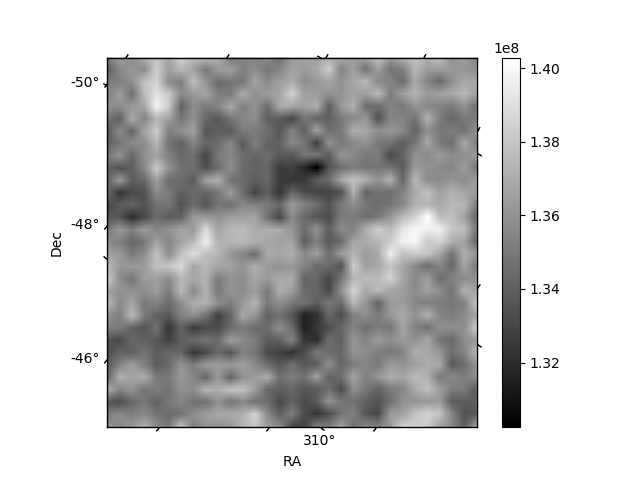
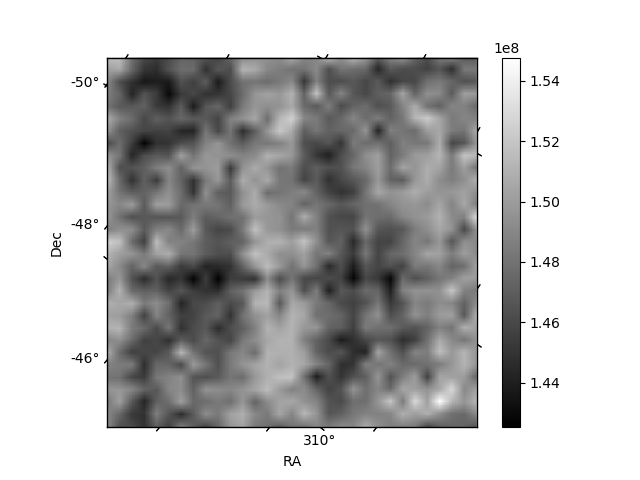
Histogram calculated using DETX and DETY for each event in the final _common_clean file
| Quadrant A | 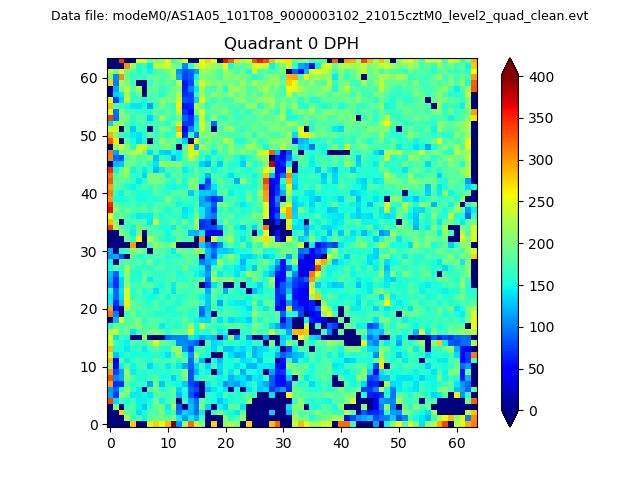 |
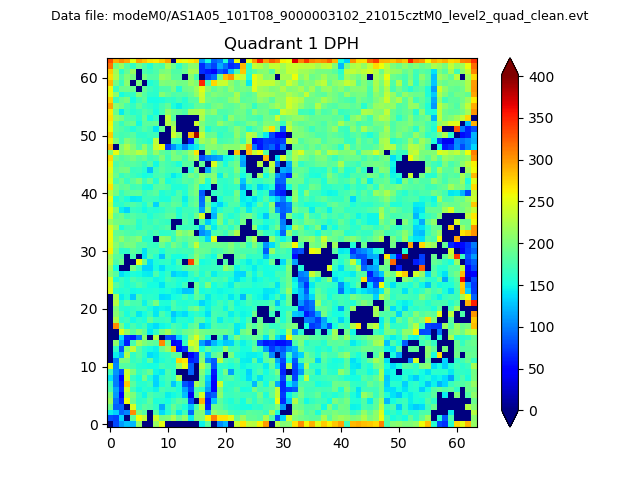 |
Quadrant B |
|---|---|---|---|
| Quadrant D | 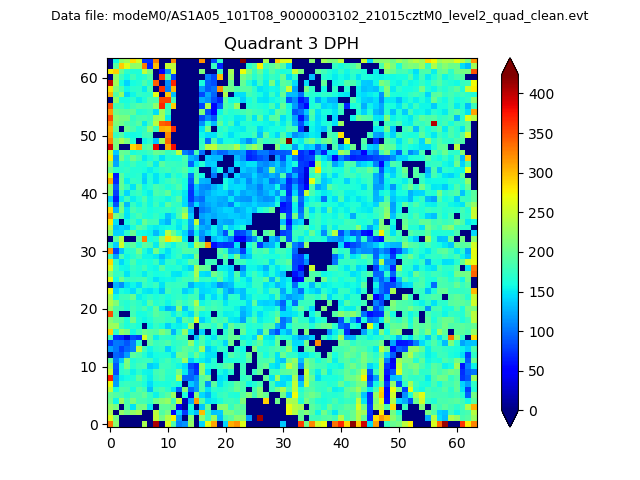 |
 |
Quadrant C |
| Plot type | Count rate plots | Images |
|---|---|---|
| Comparison with Poisson distribution Blue bars denote a histogram of data divided into 1 sec bins. Red curve is a Poisson curve with rate = median count rate of data. |
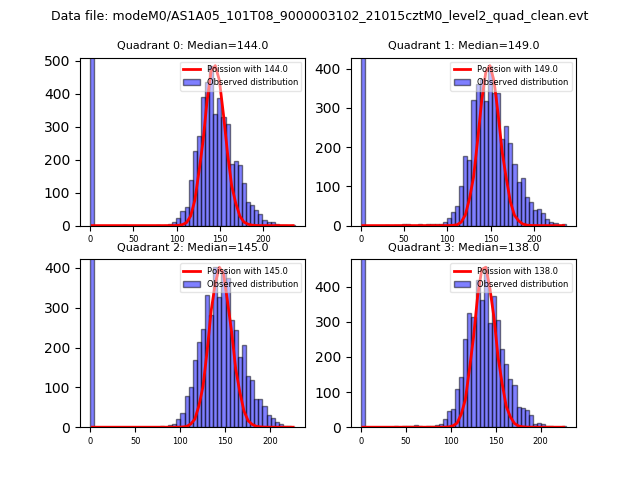 |
 |
| Quadrant-wise count rates Data is divided into 100 sec bins |
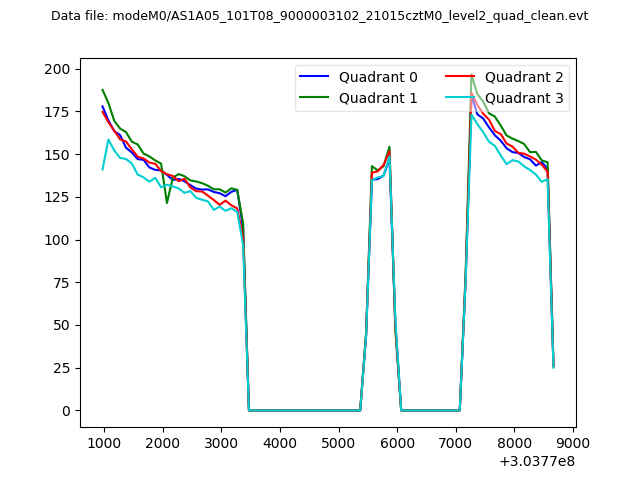 |
|
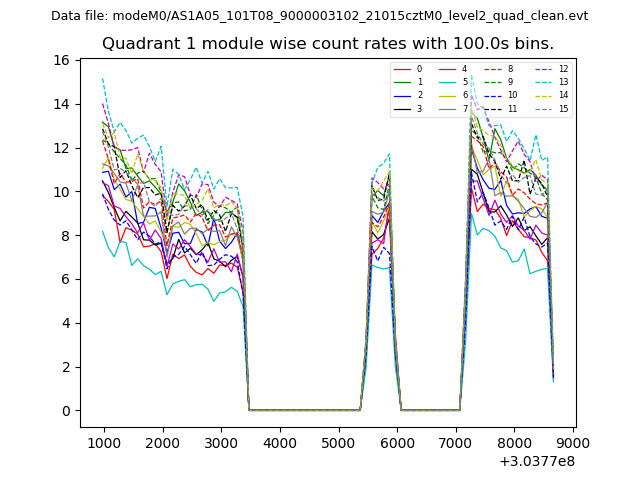
| Module-wise count rates for Quadrant A Data is divided into 100 sec bins |
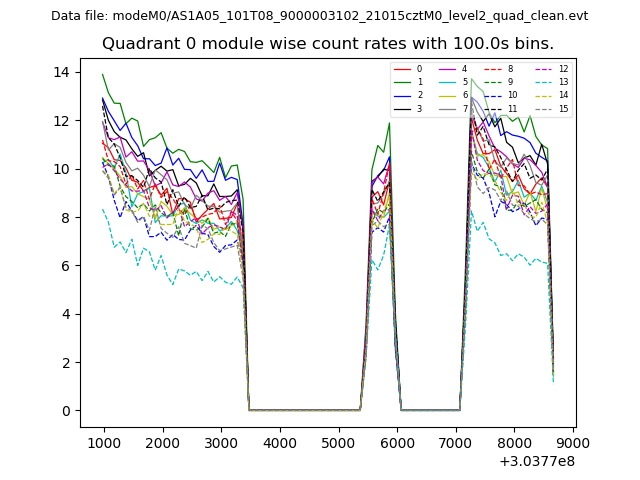 |
 |
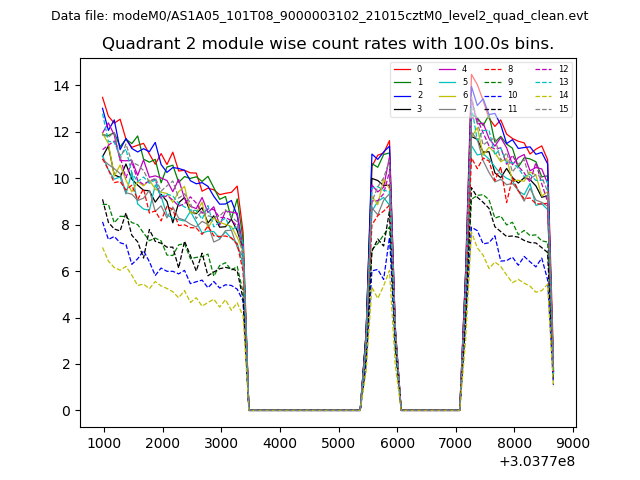
| Module-wise count rates for Quadrant B Data is divided into 100 sec bins |
 |
 |
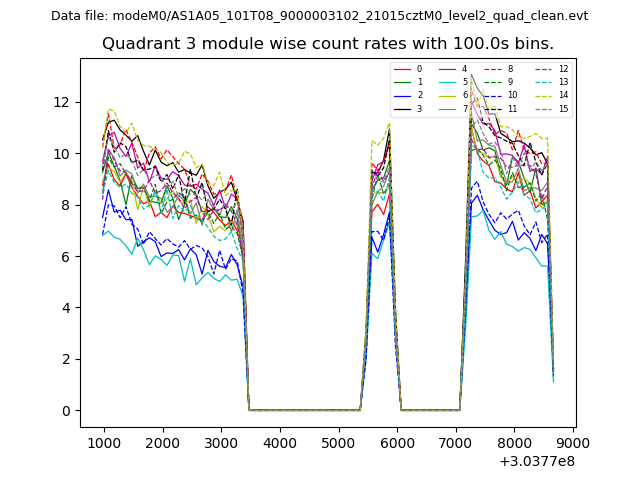
| Module-wise count rates for Quadrant C Data is divided into 100 sec bins |
 |
 |
| Module-wise count rates for Quadrant D Data is divided into 100 sec bins |
 |
 |
| Parameter | Plot |
|---|---|
| CZT HV Monitor | 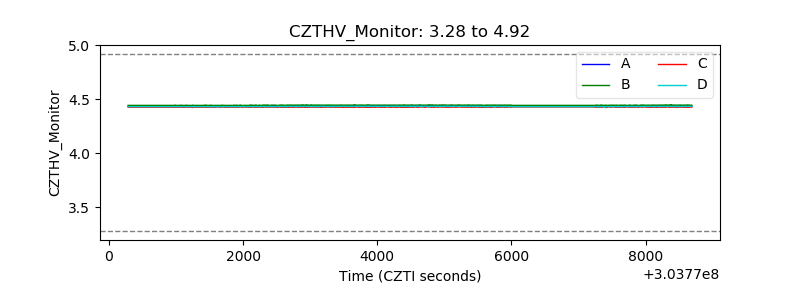 |
| D_VDD | 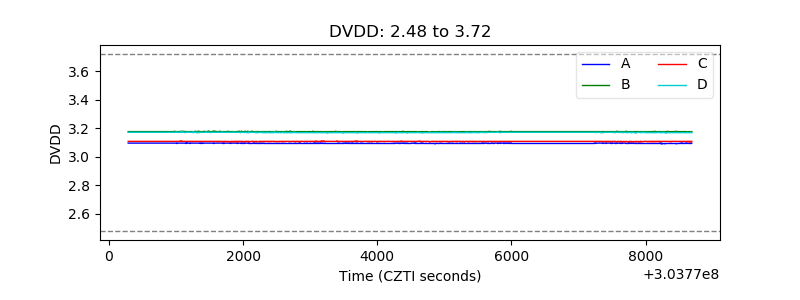 |
| Temperature 1 | 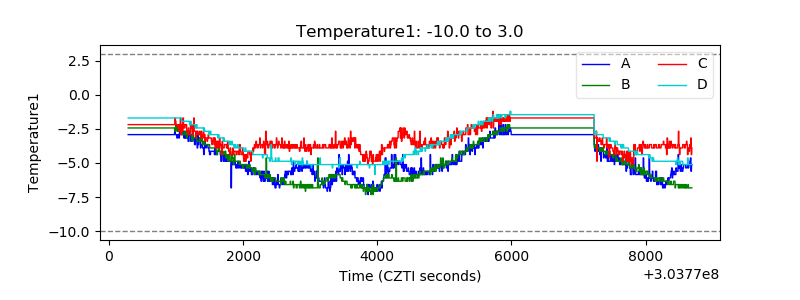 |
| Veto HV Monitor | 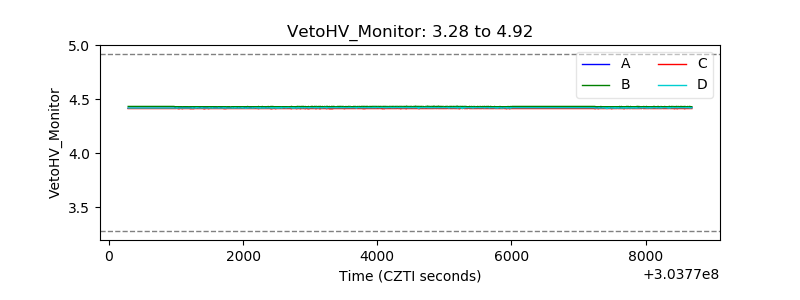 |
| Veto LLD | 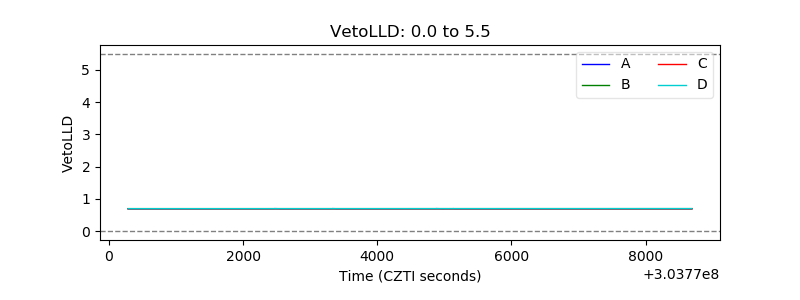 |
| Alpha Counter | 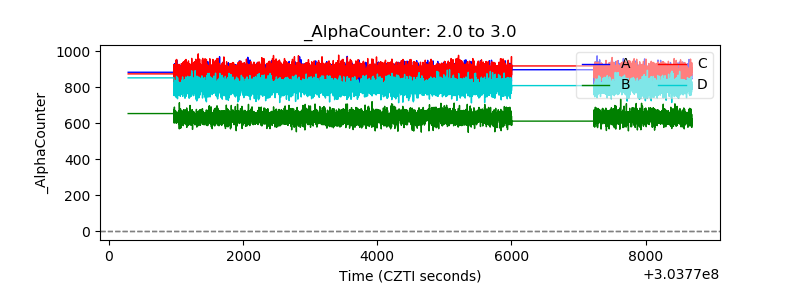 |
| _CPM_Rate | 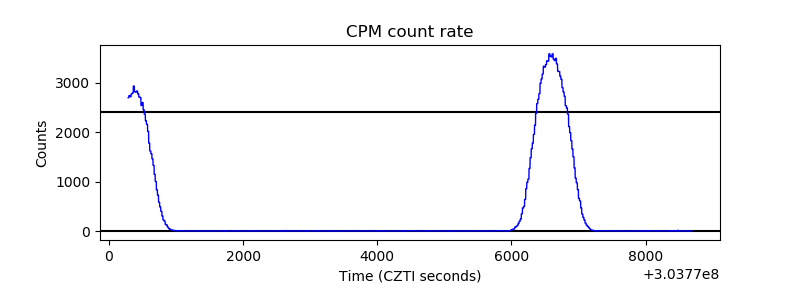 |
| CZT Counter | 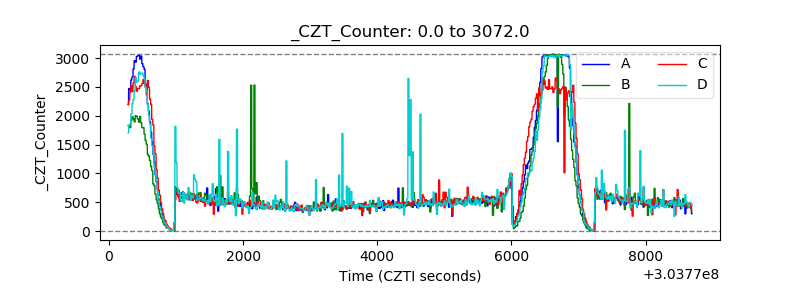 |
| +2.5 Volts monitor |  |
| +5 Volts monitor |  |
| _ROLL_ROT | 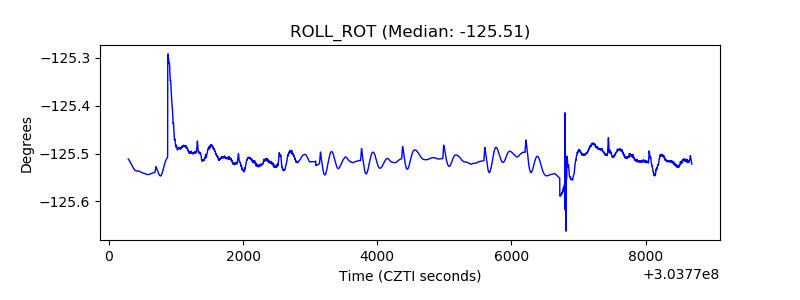 |
| _Roll_DEC |  |
| _Roll_RA | 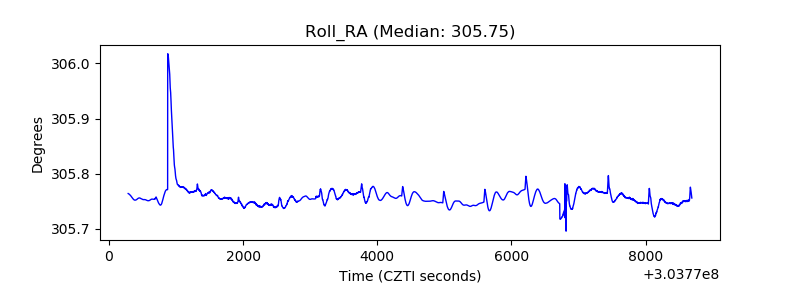 |
| Veto Counter | 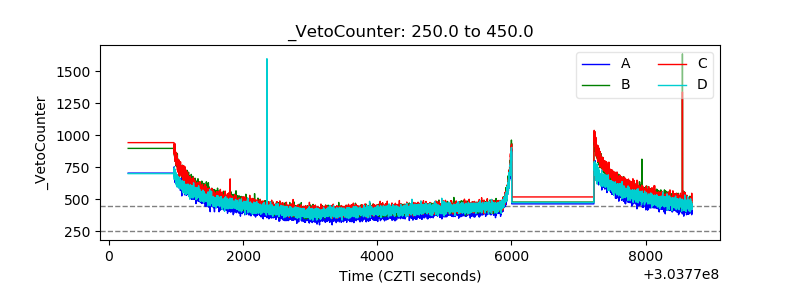 |