| Param | Original file | Final file |
|---|---|---|
| Filename | modeM0/AS1A05_101T08_9000003102_21016cztM0_level2.evt | modeM0/AS1A05_101T08_9000003102_21016cztM0_level2_quad_clean.evt |
| Size (bytes) | 441,411,840 | 95,365,440 |
| Size | 421.0 MB | 90.9 MB |
| Events in quadrant A | 3,016,014 | 614,462 |
| Events in quadrant B | 3,248,594 | 638,711 |
| Events in quadrant C | 3,112,335 | 620,986 |
| Events in quadrant D | 3,578,000 | 589,296 |
| Mode M0 | |||
|---|---|---|---|
| Quadrant | BADHDUFLAG | Total packets | Discarded packets |
| A | 0 | 12686 | 2 |
| B | 0 | 13365 | 2 |
| C | 0 | 12828 | 2 |
| D | 0 | 14605 | 2 |
| Mode M9 | |||
|---|---|---|---|
| Quadrant | BADHDUFLAG | Total packets | Discarded packets |
| A | 0 | 16 | 0 |
| B | 0 | 17 | 0 |
| C | 0 | 17 | 0 |
| D | 0 | 17 | 0 |
| Mode SS | |||
|---|---|---|---|
| Quadrant | BADHDUFLAG | Total packets | Discarded packets |
| A | 0 | 122 | 0 |
| B | 0 | 122 | 0 |
| C | 0 | 122 | 0 |
| D | 0 | 122 | 0 |
| Quadrant | Total seconds | Saturated seconds | Saturation percentage |
|---|---|---|---|
| A | 6088 | 12 | 0.197109% |
| B | 6088 | 35 | 0.574901% |
| C | 6088 | 26 | 0.427070% |
| D | 6088 | 158 | 2.595269% |
Noise dominated data is calculated using 1-second bins in cleaned event files. If a bin has >2000 counts, and if more than 50% of those come from <1% of pixels, then it is considered to be noise-dominated and hence unusable.
| Quadrant | # 1 sec bins | Bins with >0 counts | Bins with >2000 counts | High rate bins dominated by noise | Noise dominated (total time) | Noise dominated (detector-on time) | Marked lightcurve |
|---|---|---|---|---|---|---|---|
| A | 7438 | 6089 | 0 | 0 | 0.00% | 0.00% |  |
| B | 7438 | 6089 | 6 | 6 | 0.08% | 0.10% | 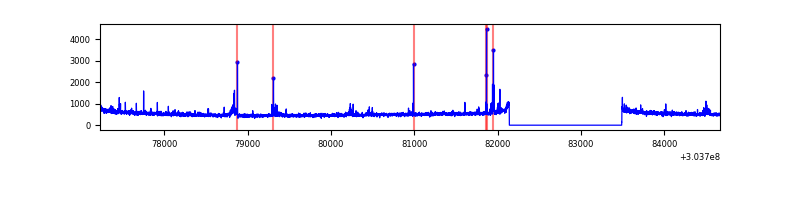 |
| C | 7438 | 6089 | 0 | 0 | 0.00% | 0.00% | 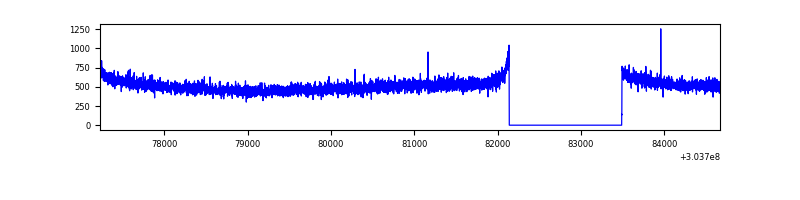 |
| D | 7438 | 6089 | 127 | 127 | 1.71% | 2.09% | 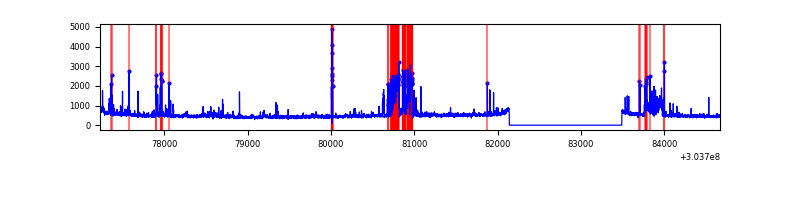 |
Top three noisy pixels from each quadrant. If the there are fewer than three noisy pixels in the level2.evt file, extra rows are filled as -1
| Pixel properties | Quadrant properties | ||||||
|---|---|---|---|---|---|---|---|
| Quadrant | DetID | PixID | Counts | Sigma | Mean | Median | Sigma |
| A | 13 | 170 | 13508 | 82.24 | 779 | 765 | 155.0 |
| A | 0 | 226 | 6765 | 38.72 | 779 | 765 | 155.0 |
| A | 3 | 137 | 6144 | 34.71 | 779 | 765 | 155.0 |
| B | 0 | 230 | 56205 | 376.52 | 792 | 776 | 147.2 |
| B | 7 | 220 | 38809 | 258.35 | 792 | 776 | 147.2 |
| B | 3 | 64 | 19536 | 127.44 | 792 | 776 | 147.2 |
| C | 14 | 238 | 121546 | 683.47 | 765 | 774 | 176.7 |
| C | 10 | 91 | 5590 | 27.25 | 765 | 774 | 176.7 |
| C | 13 | 61 | 5439 | 26.4 | 765 | 774 | 176.7 |
| D | 6 | 143 | 351380 | 1942.45 | 754 | 737 | 180.5 |
| D | 1 | 52 | 168036 | 926.78 | 754 | 737 | 180.5 |
| D | 1 | 20 | 115620 | 636.41 | 754 | 737 | 180.5 |
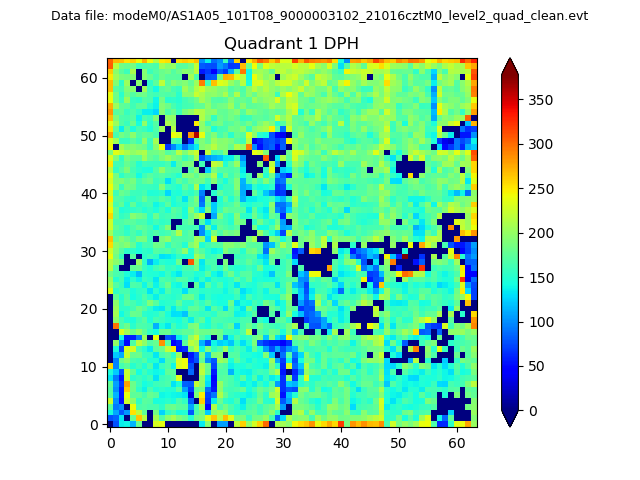
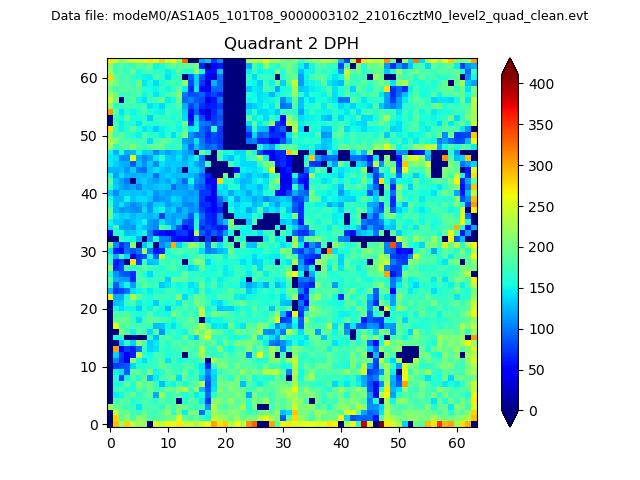
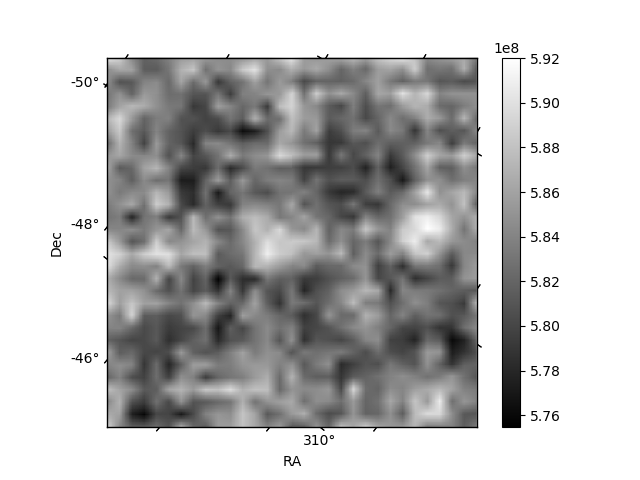
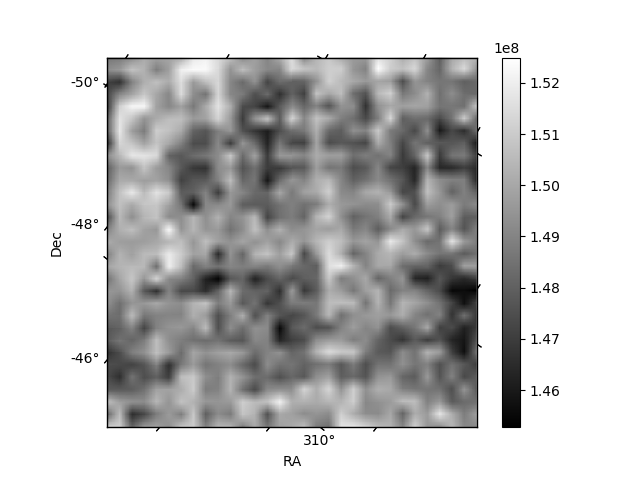
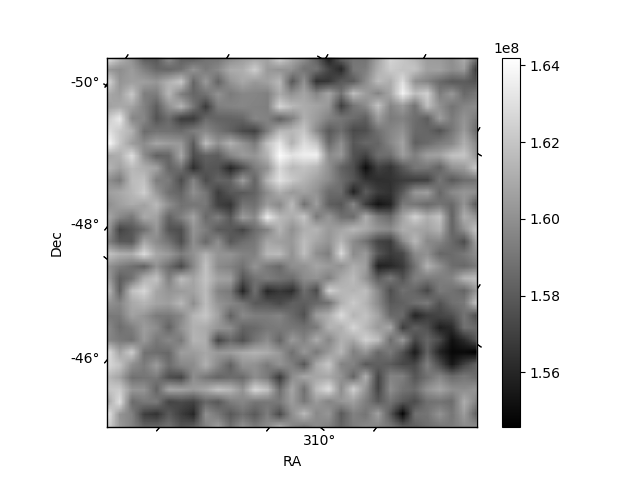
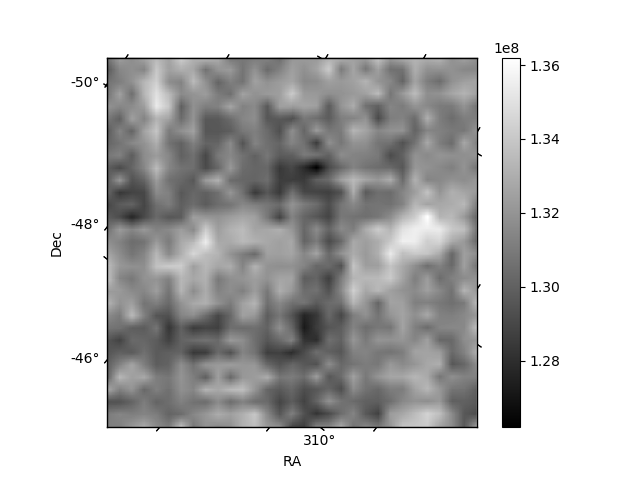
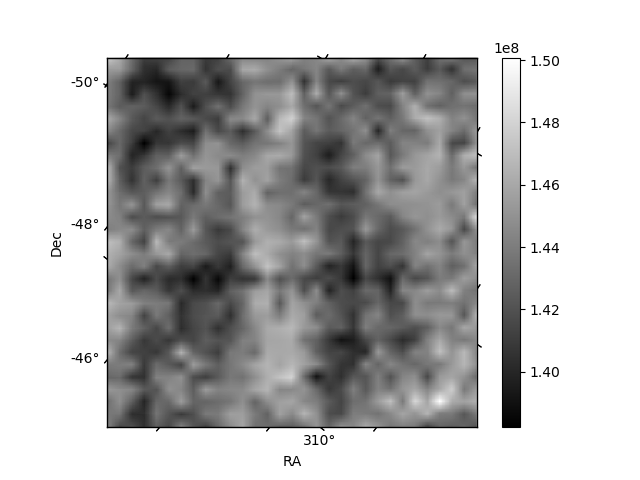
Histogram calculated using DETX and DETY for each event in the final _common_clean file
| Quadrant A | 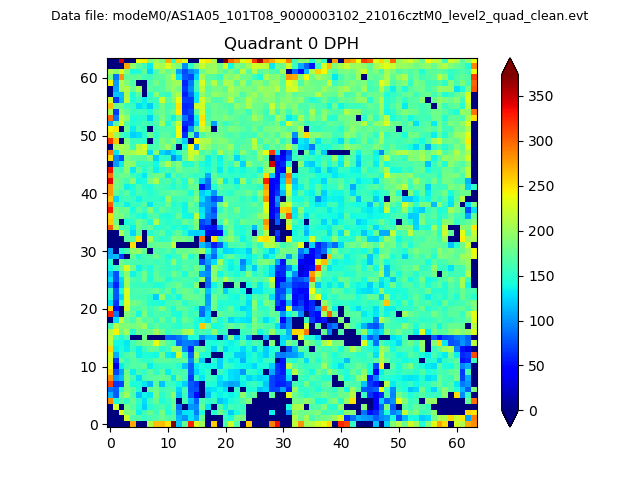 |
 |
Quadrant B |
|---|---|---|---|
| Quadrant D | 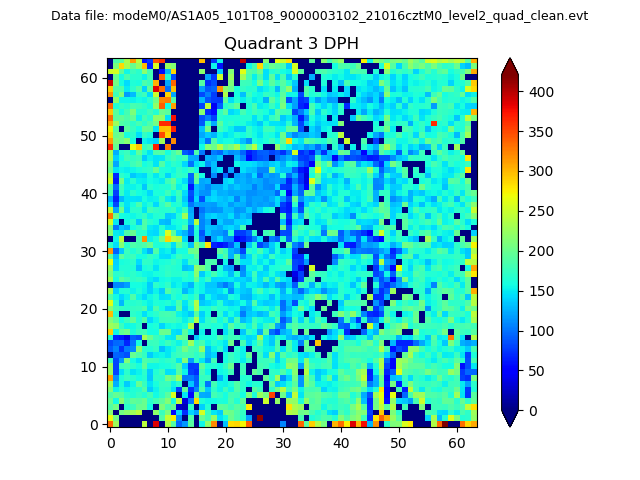 |
 |
Quadrant C |
| Plot type | Count rate plots | Images |
|---|---|---|
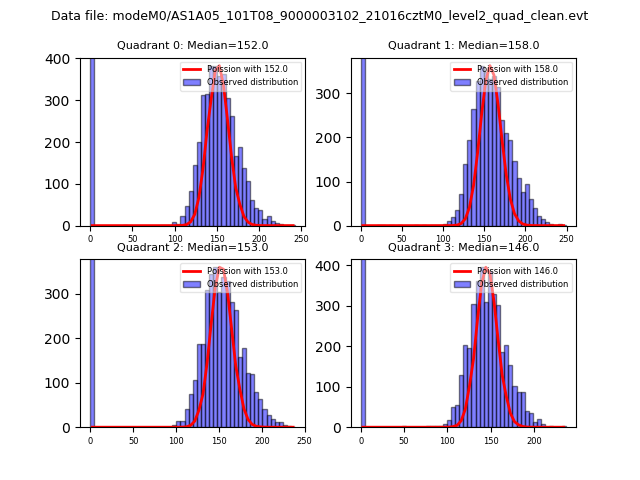
| Comparison with Poisson distribution Blue bars denote a histogram of data divided into 1 sec bins. Red curve is a Poisson curve with rate = median count rate of data. |
 |
 |
| Quadrant-wise count rates Data is divided into 100 sec bins |
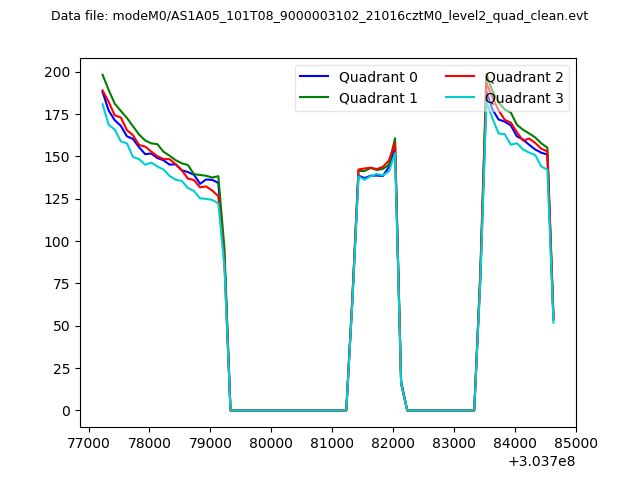 |
|
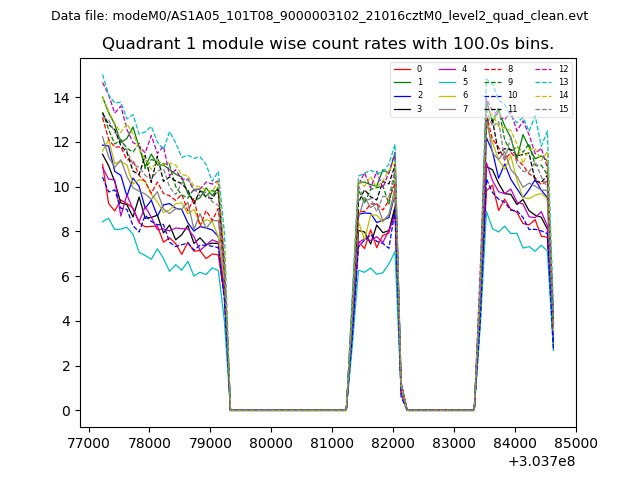
| Module-wise count rates for Quadrant A Data is divided into 100 sec bins |
 |
 |
| Module-wise count rates for Quadrant B Data is divided into 100 sec bins |
 |
 |
| Module-wise count rates for Quadrant C Data is divided into 100 sec bins |
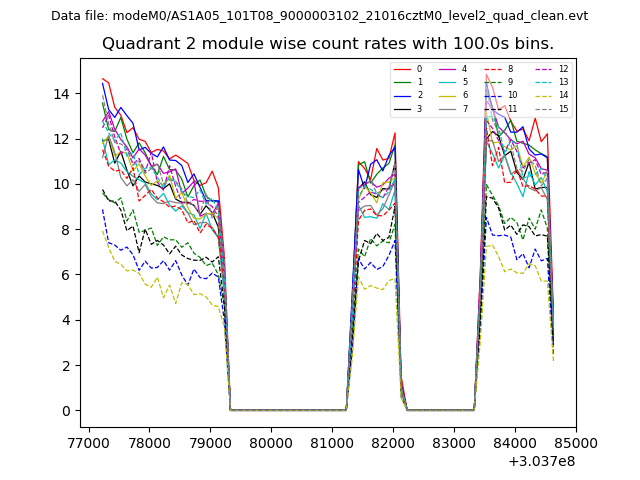 |
 |
| Module-wise count rates for Quadrant D Data is divided into 100 sec bins |
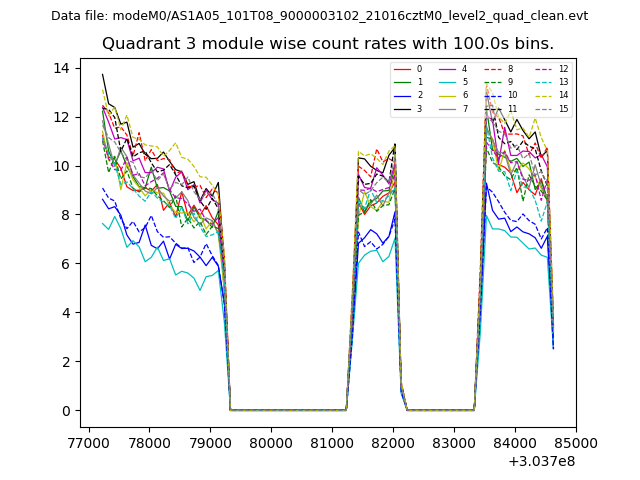 |
 |
| Parameter | Plot |
|---|---|
| CZT HV Monitor | 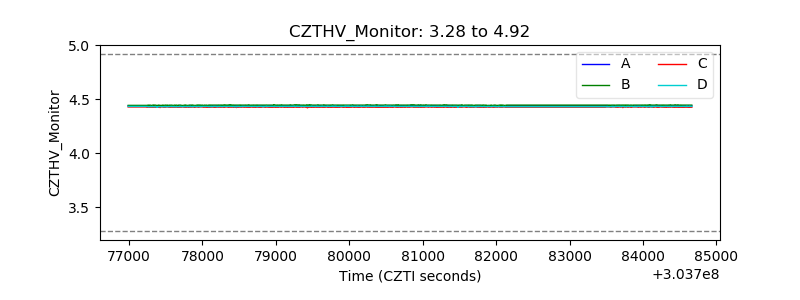 |
| D_VDD | 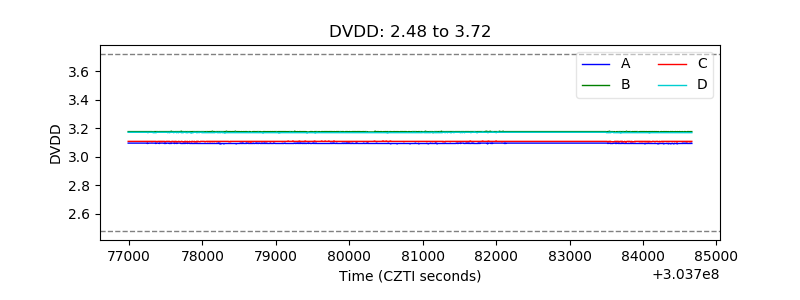 |
| Temperature 1 | 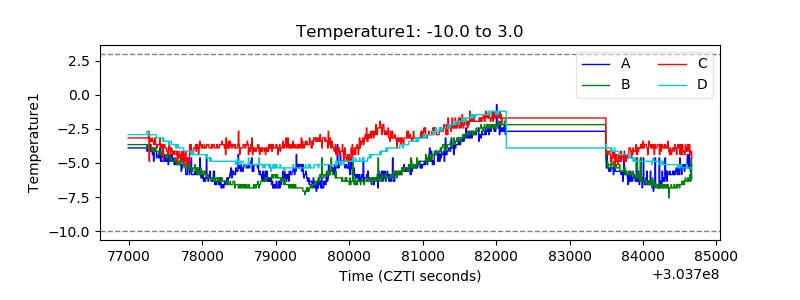 |
| Veto HV Monitor | 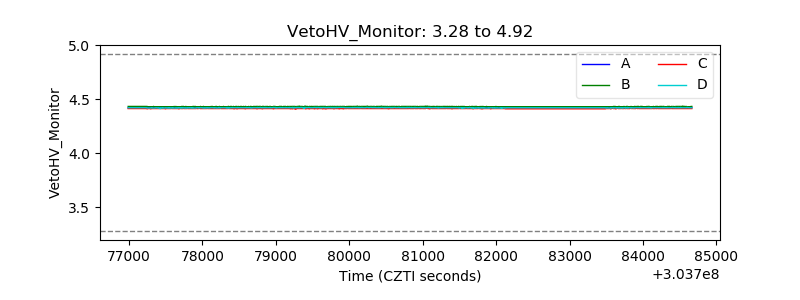 |
| Veto LLD | 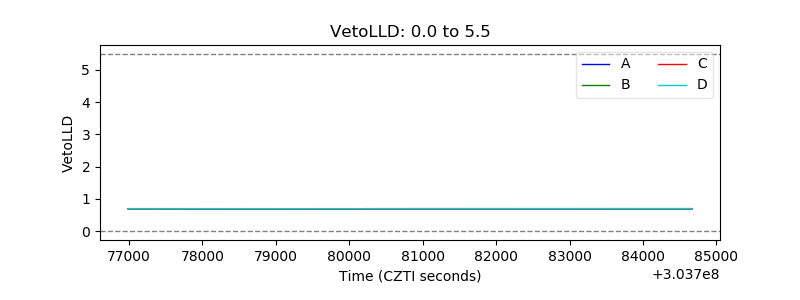 |
| Alpha Counter | 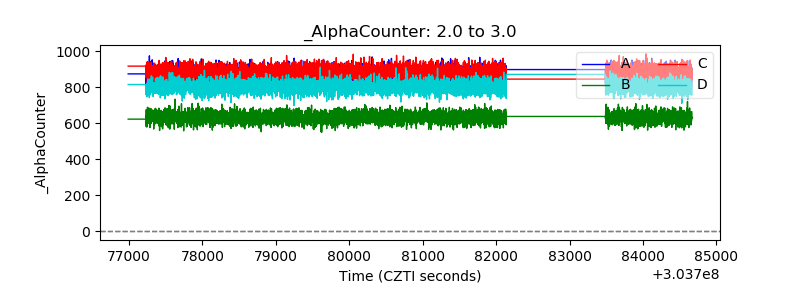 |
| _CPM_Rate | 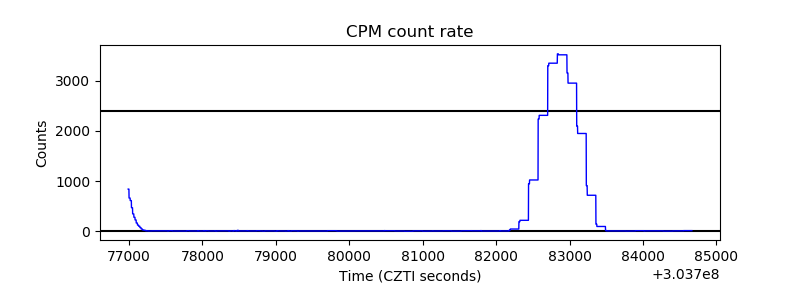 |
| CZT Counter | 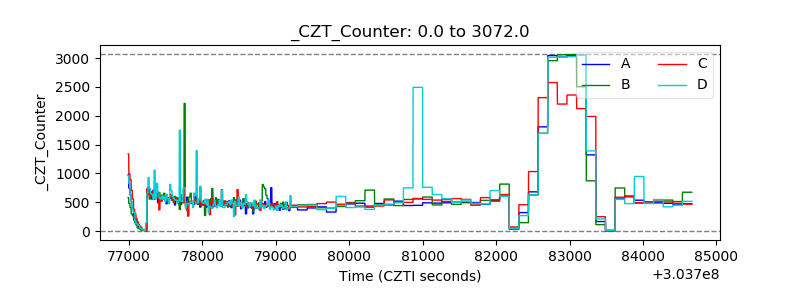 |
| +2.5 Volts monitor |  |
| +5 Volts monitor |  |
| _ROLL_ROT | 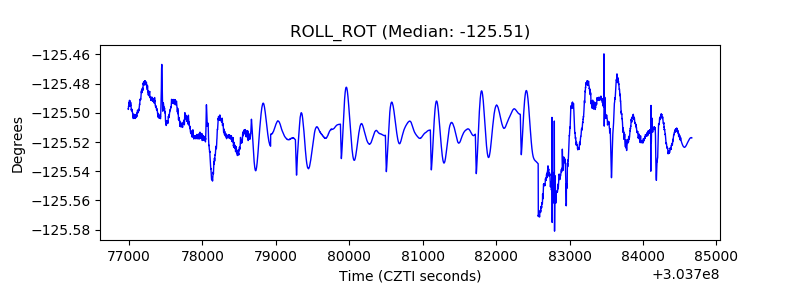 |
| _Roll_DEC | 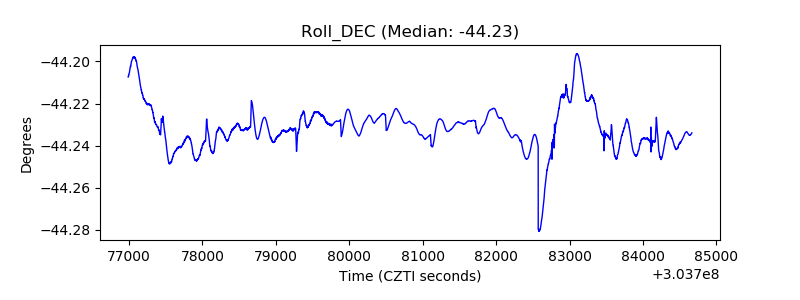 |
| _Roll_RA | 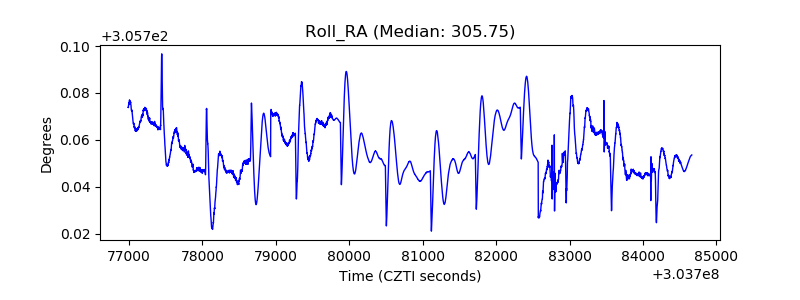 |
| Veto Counter |  |