| Param | Original file | Final file |
|---|---|---|
| Filename | modeM0/AS1A05_225T02_9000003100cztM0_level2.fits | modeM0/AS1A05_225T02_9000003100cztM0_level2_quad_clean.evt |
| Size (bytes) | 140,382,720 | 153,884,160 |
| Size | 133.9 MB | 146.8 MB |
| Events in quadrant A | 853,000 | 945,848 |
| Events in quadrant B | 818,640 | 955,370 |
| Events in quadrant C | 845,498 | 935,458 |
| Events in quadrant D | 705,602 | 794,892 |
| Mode M0 | |||
|---|---|---|---|
| Quadrant | BADHDUFLAG | Total packets | Discarded packets |
| A | 0 | 30442 | 0 |
| B | 0 | 33487 | 0 |
| C | 0 | 30715 | 0 |
| D | 0 | 44025 | 0 |
| Mode SS | |||
|---|---|---|---|
| Quadrant | BADHDUFLAG | Total packets | Discarded packets |
| A | 0 | 300 | 0 |
| B | 0 | 300 | 0 |
| C | 0 | 300 | 0 |
| D | 0 | 300 | 0 |
| Mode M9 | |||
|---|---|---|---|
| Quadrant | BADHDUFLAG | Total packets | Discarded packets |
| A | 0 | 27 | 0 |
| B | 0 | 27 | 0 |
| C | 0 | 27 | 0 |
| D | 0 | 27 | 0 |
| Quadrant | Total seconds | Saturated seconds | Saturation percentage |
|---|---|---|---|
| A | 14917 | 99 | 0.663672% |
| B | 14917 | 200 | 1.340752% |
| C | 14917 | 177 | 1.186566% |
| D | 14917 | 1227 | 8.225515% |
Noise dominated data is calculated using 1-second bins in cleaned event files. If a bin has >2000 counts, and if more than 50% of those come from <1% of pixels, then it is considered to be noise-dominated and hence unusable.
| Quadrant | # 1 sec bins | Bins with >0 counts | Bins with >2000 counts | High rate bins dominated by noise | Noise dominated (total time) | Noise dominated (detector-on time) | Marked lightcurve |
|---|---|---|---|---|---|---|---|
| A | 17492 | 14917 | 0 | 0 | 0.00% | 0.00% | 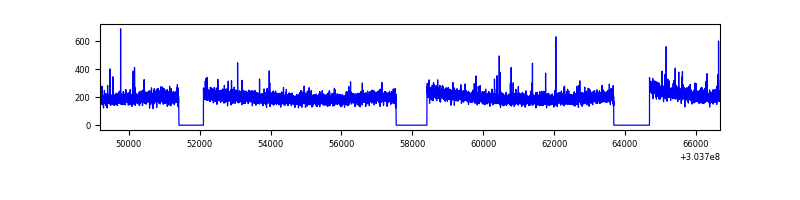 |
| B | 17492 | 14917 | 0 | 0 | 0.00% | 0.00% |  |
| C | 17492 | 14917 | 0 | 0 | 0.00% | 0.00% |  |
| D | 17492 | 14913 | 0 | 0 | 0.00% | 0.00% | 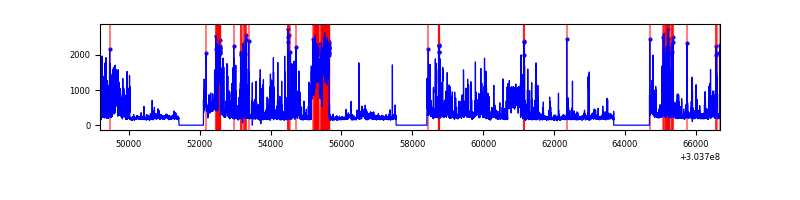 |
Top three noisy pixels from each quadrant. If the there are fewer than three noisy pixels in the level2.evt file, extra rows are filled as -1
| Pixel properties | Quadrant properties | ||||||
|---|---|---|---|---|---|---|---|
| Quadrant | DetID | PixID | Counts | Sigma | Mean | Median | Sigma |
| A | 0 | 29 | 827 | 10.65 | 222 | 208 | 58.1 |
| A | 7 | 110 | 717 | 8.75 | 222 | 208 | 58.1 |
| A | 0 | 30 | 667 | 7.89 | 222 | 208 | 58.1 |
| B | 2 | 9 | 629 | 9.43 | 216 | 207 | 44.7 |
| B | 3 | 17 | 591 | 8.58 | 216 | 207 | 44.7 |
| B | 5 | 128 | 518 | 6.95 | 216 | 207 | 44.7 |
| C | 12 | 241 | 635 | 7.16 | 223 | 208 | 59.6 |
| C | 3 | 126 | 590 | 6.41 | 223 | 208 | 59.6 |
| C | 2 | 191 | 586 | 6.34 | 223 | 208 | 59.6 |
| D | 4 | 246 | 533 | 6.42 | 201 | 183 | 54.5 |
| D | 3 | 14 | 516 | 6.11 | 201 | 183 | 54.5 |
| D | 6 | 231 | 512 | 6.03 | 201 | 183 | 54.5 |
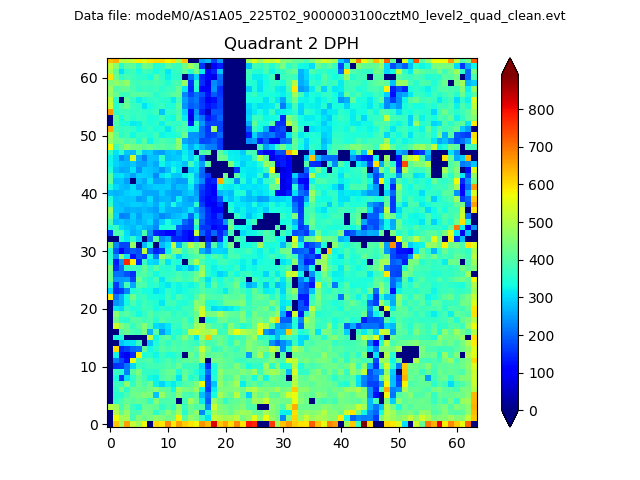
Histogram calculated using DETX and DETY for each event in the final _common_clean file
| Quadrant A | 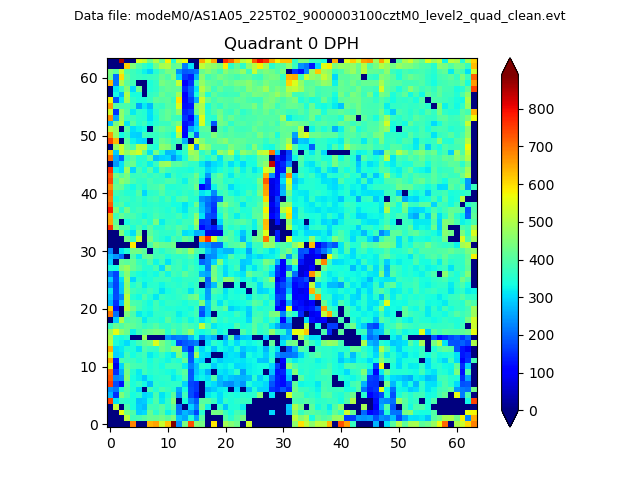 |
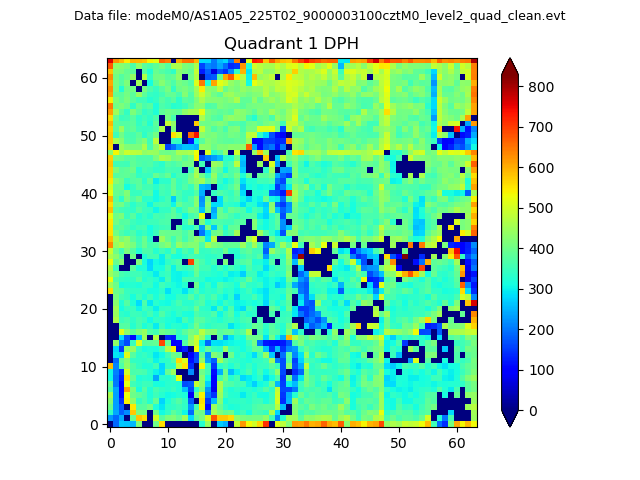 |
Quadrant B |
|---|---|---|---|
| Quadrant D |  |
 |
Quadrant C |
| Plot type | Count rate plots | Images |
|---|---|---|
| Comparison with Poisson distribution Blue bars denote a histogram of data divided into 1 sec bins. Red curve is a Poisson curve with rate = median count rate of data. |
 |
 |
| Quadrant-wise count rates Data is divided into 100 sec bins |
 |
|
| Module-wise count rates for Quadrant A Data is divided into 100 sec bins |
 |
 |
| Module-wise count rates for Quadrant B Data is divided into 100 sec bins |
 |
 |
| Module-wise count rates for Quadrant C Data is divided into 100 sec bins |
 |
 |
| Module-wise count rates for Quadrant D Data is divided into 100 sec bins |
 |
 |
| Parameter | Plot |
|---|---|
| CZT HV Monitor |  |
| D_VDD | 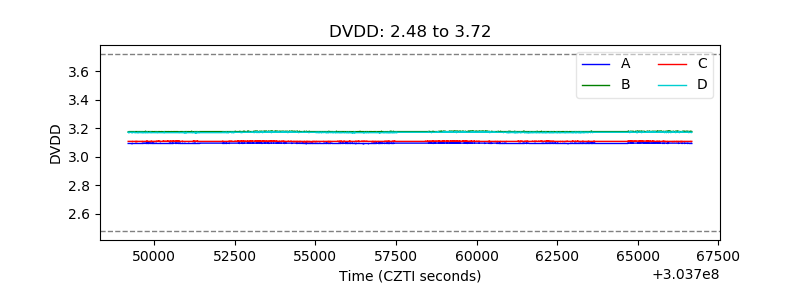 |
| Temperature 1 |  |
| Veto HV Monitor | 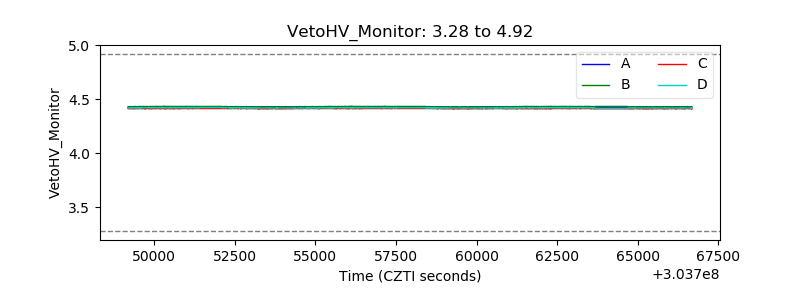 |
| Veto LLD | 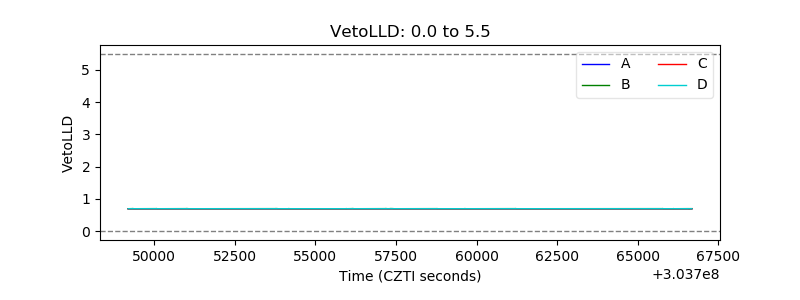 |
| Alpha Counter |  |
| _CPM_Rate |  |
| CZT Counter |  |
| +2.5 Volts monitor |  |
| +5 Volts monitor |  |
| _ROLL_ROT |  |
| _Roll_DEC |  |
| _Roll_RA |  |
| Veto Counter |  |