| Param | Original file | Final file |
|---|---|---|
| Filename | modeM0/AS1A05_225T02_9000003100_21012cztM0_level2.evt | modeM0/AS1A05_225T02_9000003100_21012cztM0_level2_quad_clean.evt |
| Size (bytes) | 1,085,483,520 | 203,428,800 |
| Size | 1.0 GB | 194.0 MB |
| Events in quadrant A | 6,575,763 | 1,304,592 |
| Events in quadrant B | 7,580,441 | 1,335,907 |
| Events in quadrant C | 6,779,066 | 1,306,993 |
| Events in quadrant D | 10,969,613 | 1,223,914 |
| Mode M0 | |||
|---|---|---|---|
| Quadrant | BADHDUFLAG | Total packets | Discarded packets |
| A | 0 | 29293 | 3 |
| B | 0 | 32203 | 3 |
| C | 0 | 29569 | 3 |
| D | 0 | 42497 | 3 |
| Mode SS | |||
|---|---|---|---|
| Quadrant | BADHDUFLAG | Total packets | Discarded packets |
| A | 0 | 290 | 0 |
| B | 0 | 290 | 0 |
| C | 0 | 290 | 0 |
| D | 0 | 290 | 0 |
| Mode M9 | |||
|---|---|---|---|
| Quadrant | BADHDUFLAG | Total packets | Discarded packets |
| A | 0 | 27 | 0 |
| B | 0 | 27 | 0 |
| C | 0 | 27 | 0 |
| D | 0 | 27 | 0 |
| Quadrant | Total seconds | Saturated seconds | Saturation percentage |
|---|---|---|---|
| A | 14343 | 99 | 0.690232% |
| B | 14343 | 195 | 1.359548% |
| C | 14343 | 177 | 1.234051% |
| D | 14343 | 1205 | 8.401311% |
Noise dominated data is calculated using 1-second bins in cleaned event files. If a bin has >2000 counts, and if more than 50% of those come from <1% of pixels, then it is considered to be noise-dominated and hence unusable.
| Quadrant | # 1 sec bins | Bins with >0 counts | Bins with >2000 counts | High rate bins dominated by noise | Noise dominated (total time) | Noise dominated (detector-on time) | Marked lightcurve |
|---|---|---|---|---|---|---|---|
| A | 16918 | 14346 | 0 | 0 | 0.00% | 0.00% | 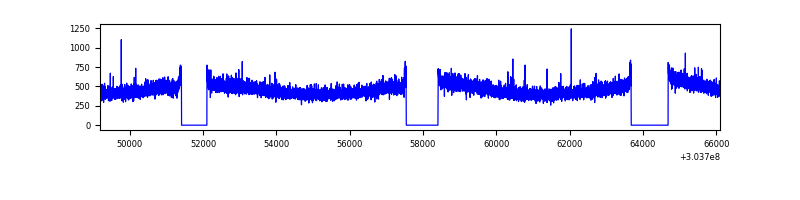 |
| B | 16918 | 14346 | 30 | 30 | 0.18% | 0.21% | 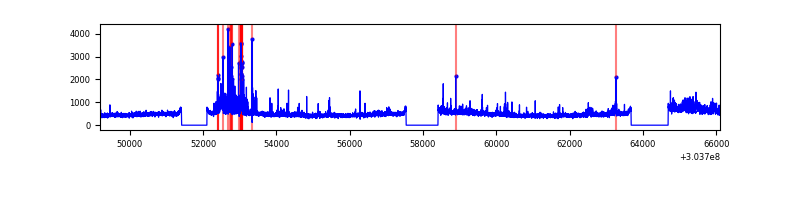 |
| C | 16918 | 14346 | 1 | 1 | 0.01% | 0.01% | 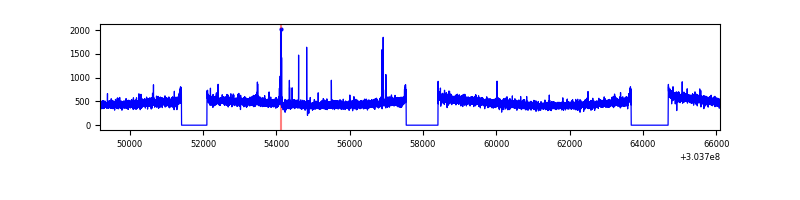 |
| D | 16918 | 14345 | 1051 | 1051 | 6.21% | 7.33% | 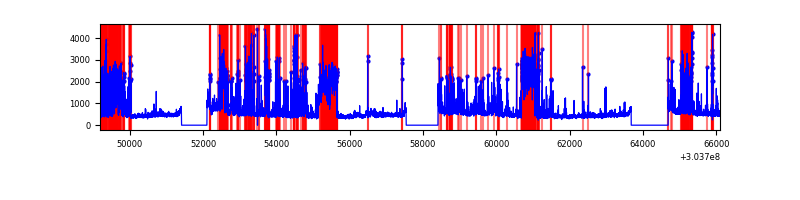 |
Top three noisy pixels from each quadrant. If the there are fewer than three noisy pixels in the level2.evt file, extra rows are filled as -1
| Pixel properties | Quadrant properties | ||||||
|---|---|---|---|---|---|---|---|
| Quadrant | DetID | PixID | Counts | Sigma | Mean | Median | Sigma |
| A | 0 | 226 | 14888 | 38.48 | 1705 | 1666 | 343.6 |
| A | 3 | 137 | 14066 | 36.08 | 1705 | 1666 | 343.6 |
| A | 12 | 194 | 12245 | 30.79 | 1705 | 1666 | 343.6 |
| B | 7 | 220 | 277754 | 860.41 | 1708 | 1663 | 320.9 |
| B | 0 | 182 | 254220 | 787.06 | 1708 | 1663 | 320.9 |
| B | 0 | 189 | 92494 | 283.06 | 1708 | 1663 | 320.9 |
| C | 14 | 238 | 261114 | 679.89 | 1651 | 1662 | 381.6 |
| C | 9 | 54 | 71838 | 183.89 | 1651 | 1662 | 381.6 |
| C | 13 | 61 | 11609 | 26.07 | 1651 | 1662 | 381.6 |
| D | 1 | 52 | 1904731 | 4918.45 | 1613 | 1567 | 386.9 |
| D | 9 | 1 | 1143414 | 2950.94 | 1613 | 1567 | 386.9 |
| D | 2 | 16 | 708425 | 1826.77 | 1613 | 1567 | 386.9 |
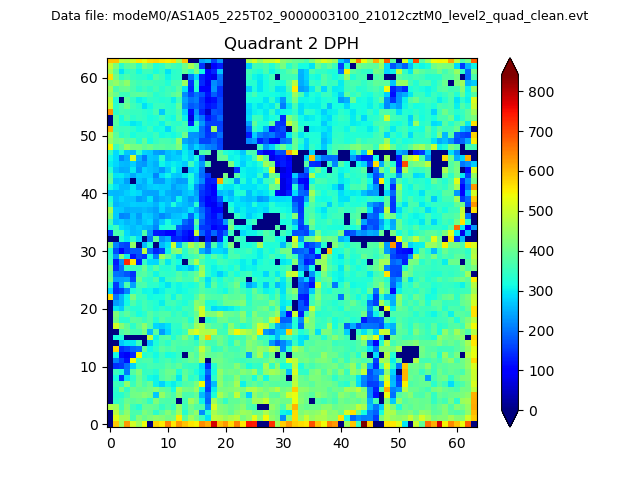
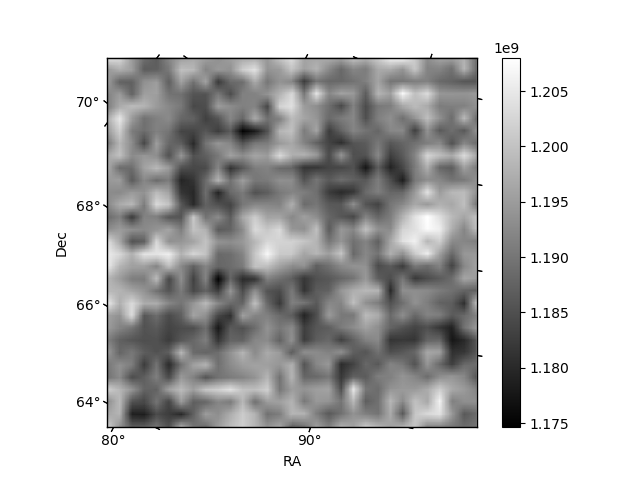
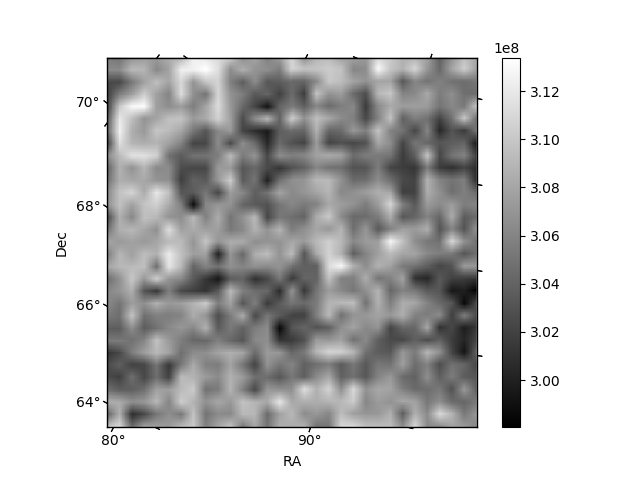
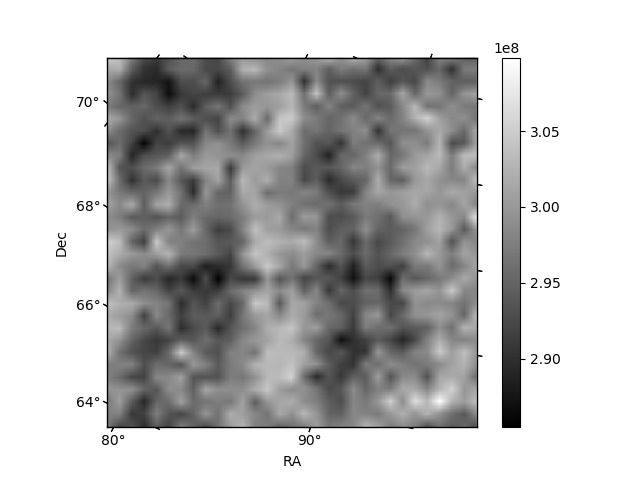
Histogram calculated using DETX and DETY for each event in the final _common_clean file
| Quadrant A | 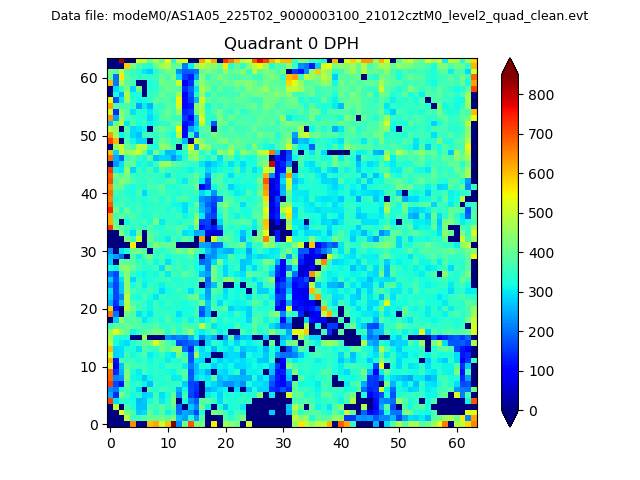 |
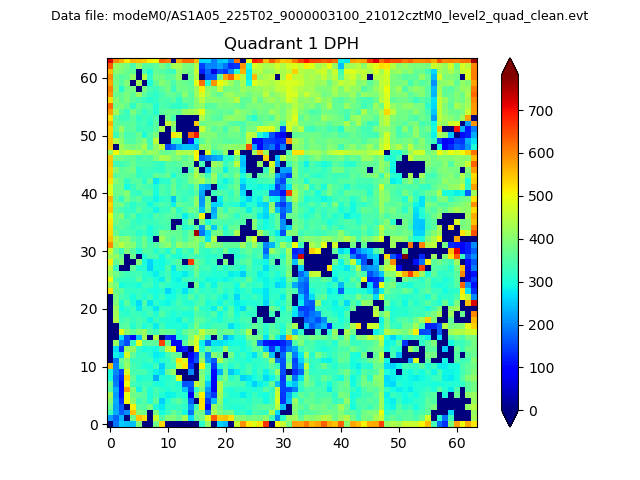 |
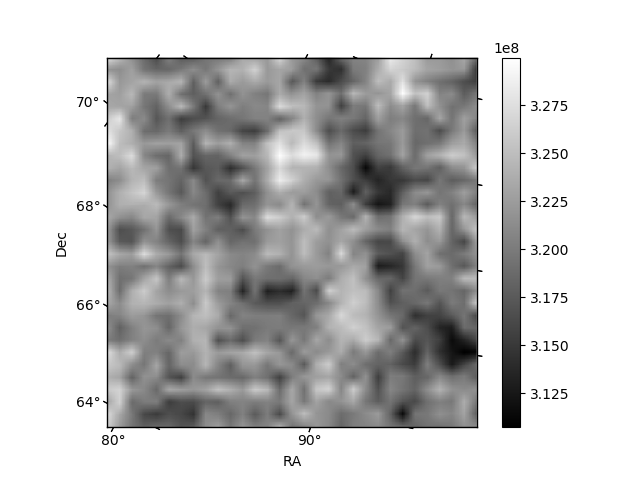
Quadrant B |
|---|---|---|---|
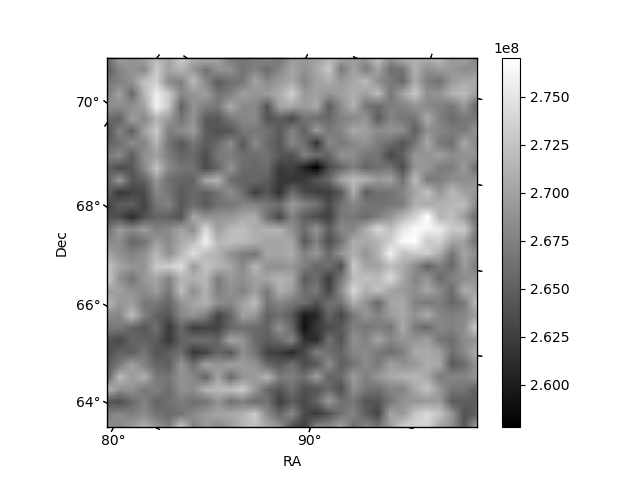
| Quadrant D | 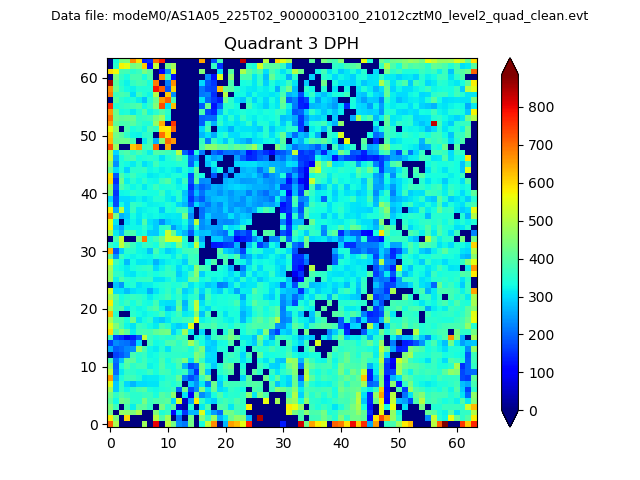 |
 |
Quadrant C |
| Plot type | Count rate plots | Images |
|---|---|---|
| Comparison with Poisson distribution Blue bars denote a histogram of data divided into 1 sec bins. Red curve is a Poisson curve with rate = median count rate of data. |
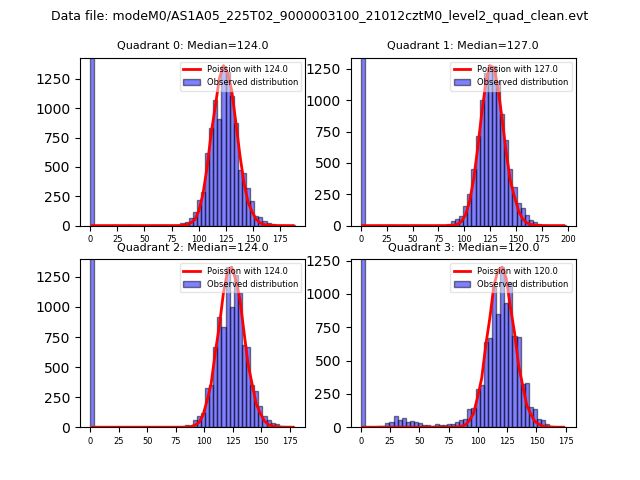 |
 |
| Quadrant-wise count rates Data is divided into 100 sec bins |
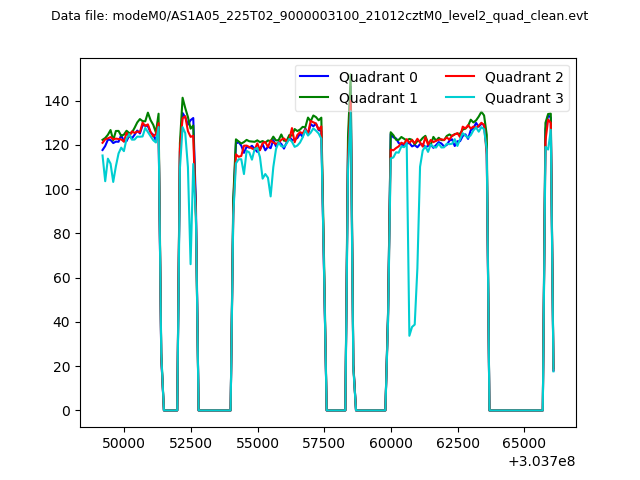 |
|
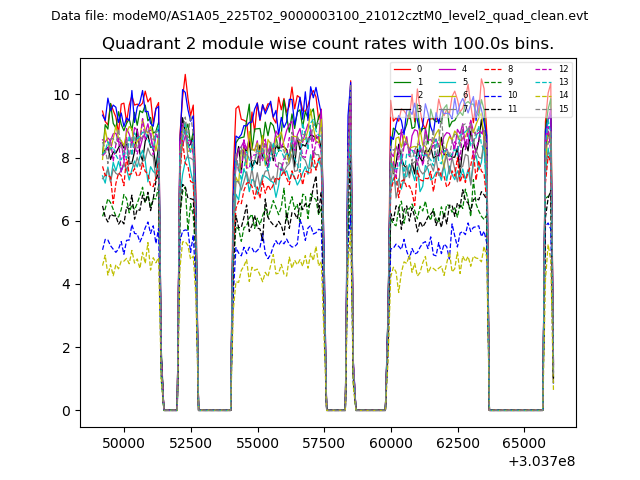
| Module-wise count rates for Quadrant A Data is divided into 100 sec bins |
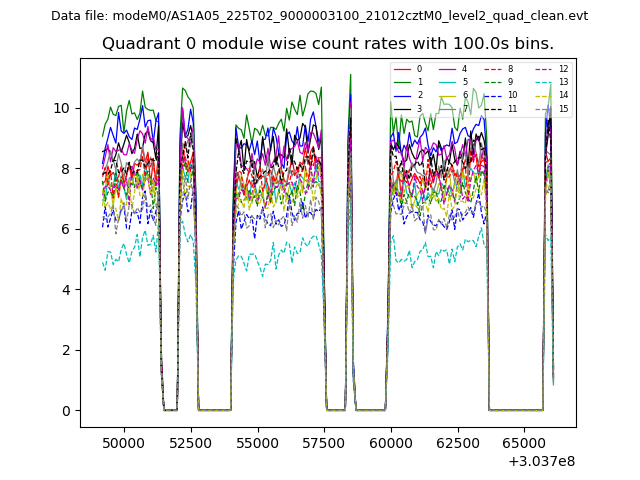 |
 |
| Module-wise count rates for Quadrant B Data is divided into 100 sec bins |
 |
 |
| Module-wise count rates for Quadrant C Data is divided into 100 sec bins |
 |
 |
| Module-wise count rates for Quadrant D Data is divided into 100 sec bins |
 |
 |
| Parameter | Plot |
|---|---|
| CZT HV Monitor | 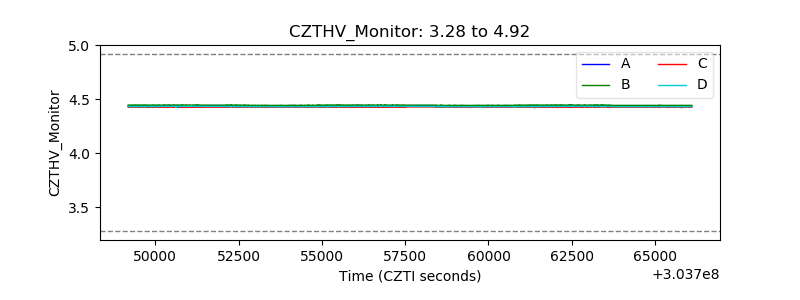 |
| D_VDD | 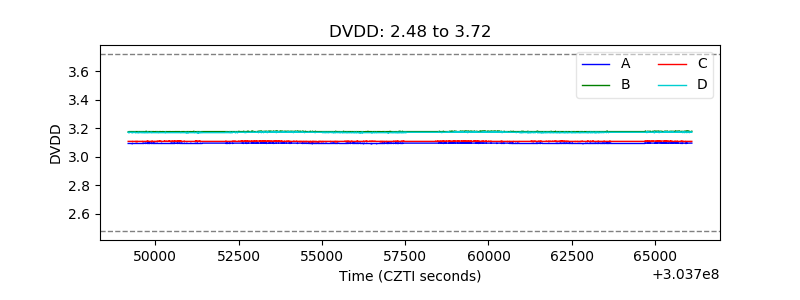 |
| Temperature 1 | 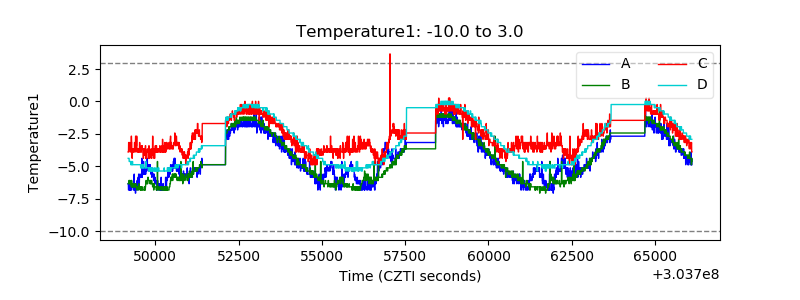 |
| Veto HV Monitor | 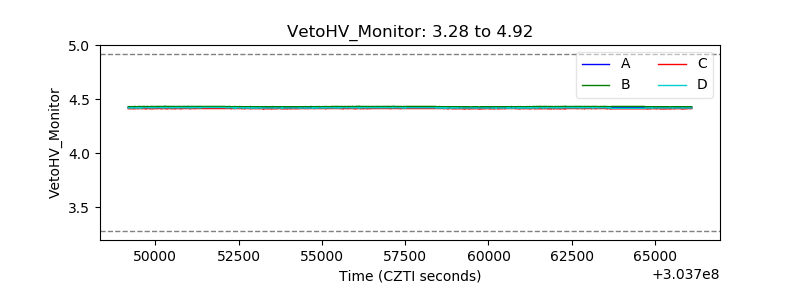 |
| Veto LLD |  |
| Alpha Counter | 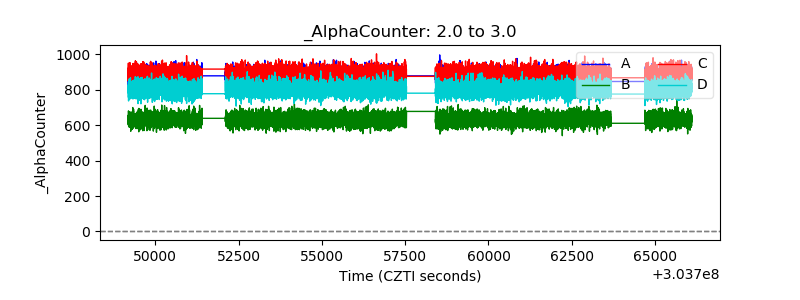 |
| _CPM_Rate | 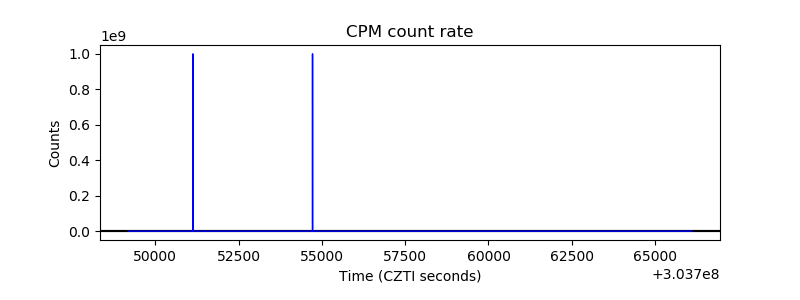 |
| CZT Counter | 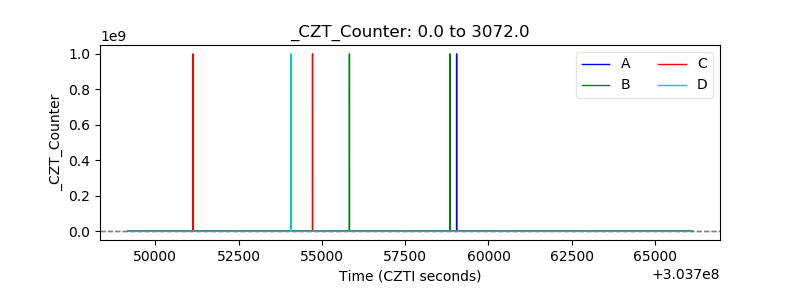 |
| +2.5 Volts monitor |  |
| +5 Volts monitor |  |
| _ROLL_ROT | 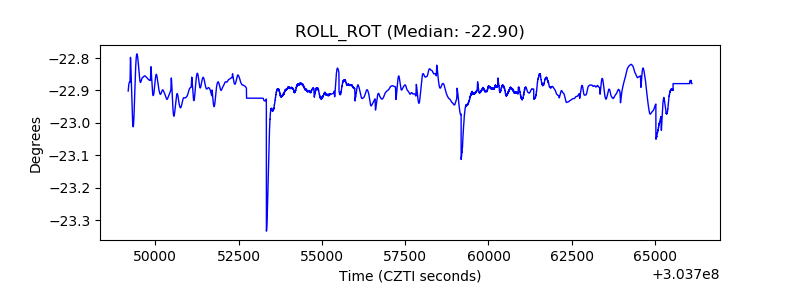 |
| _Roll_DEC | 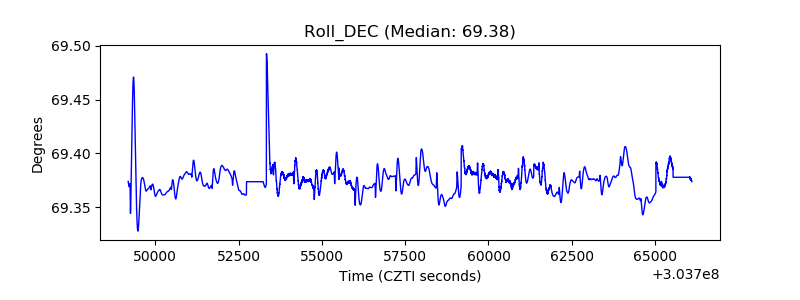 |
| _Roll_RA | 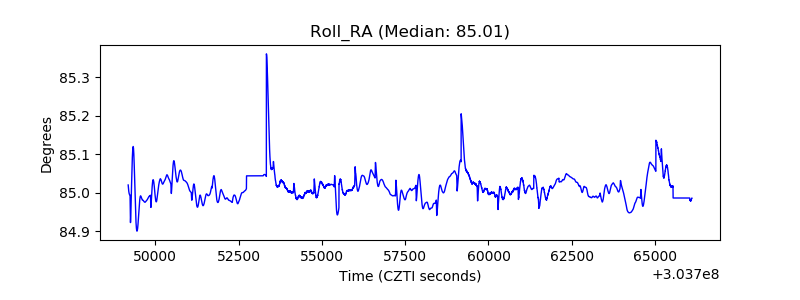 |
| Veto Counter |  |