| Param | Original file | Final file |
|---|---|---|
| Filename | modeM0/AS1A05_225T02_9000003100_21014cztM0_level2.evt | modeM0/AS1A05_225T02_9000003100_21014cztM0_level2_quad_clean.evt |
| Size (bytes) | 139,409,280 | 19,117,440 |
| Size | 133.0 MB | 18.2 MB |
| Events in quadrant A | 823,132 | 113,970 |
| Events in quadrant B | 1,119,132 | 116,160 |
| Events in quadrant C | 859,416 | 113,913 |
| Events in quadrant D | 1,302,479 | 109,586 |
| Mode M0 | |||
|---|---|---|---|
| Quadrant | BADHDUFLAG | Total packets | Discarded packets |
| A | 0 | 3490 | 0 |
| B | 0 | 4533 | 0 |
| C | 0 | 3553 | 0 |
| D | 0 | 4961 | 0 |
| Mode SS | |||
|---|---|---|---|
| Quadrant | BADHDUFLAG | Total packets | Discarded packets |
| A | 0 | 34 | 0 |
| B | 0 | 34 | 0 |
| C | 0 | 34 | 0 |
| D | 0 | 34 | 0 |
| Quadrant | Total seconds | Saturated seconds | Saturation percentage |
|---|---|---|---|
| A | 1698 | 3 | 0.176678% |
| B | 1698 | 8 | 0.471143% |
| C | 1698 | 12 | 0.706714% |
| D | 1698 | 123 | 7.243816% |
Noise dominated data is calculated using 1-second bins in cleaned event files. If a bin has >2000 counts, and if more than 50% of those come from <1% of pixels, then it is considered to be noise-dominated and hence unusable.
| Quadrant | # 1 sec bins | Bins with >0 counts | Bins with >2000 counts | High rate bins dominated by noise | Noise dominated (total time) | Noise dominated (detector-on time) | Marked lightcurve |
|---|---|---|---|---|---|---|---|
| A | 1698 | 1698 | 0 | 0 | 0.00% | 0.00% | 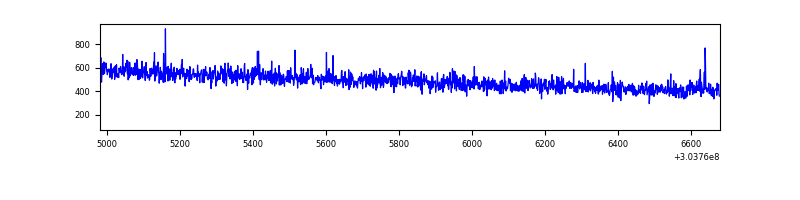 |
| B | 1698 | 1698 | 2 | 2 | 0.12% | 0.12% | 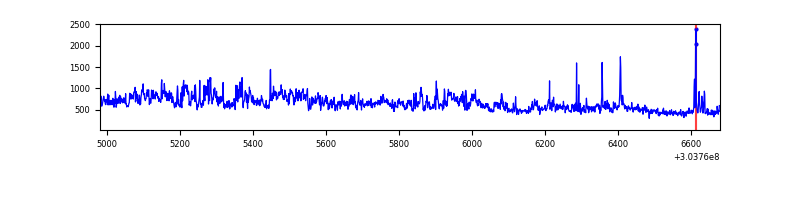 |
| C | 1698 | 1698 | 0 | 0 | 0.00% | 0.00% | 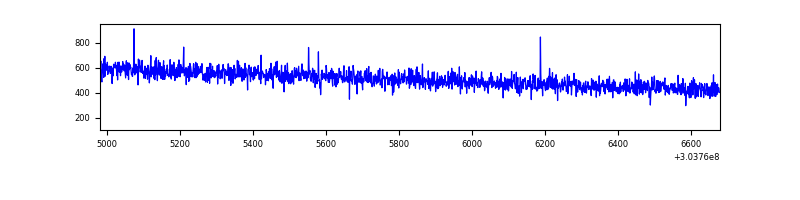 |
| D | 1698 | 1698 | 92 | 92 | 5.42% | 5.42% | 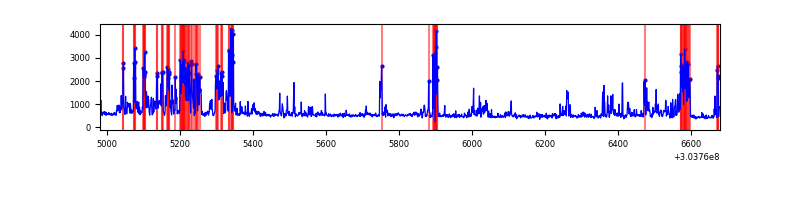 |
Top three noisy pixels from each quadrant. If the there are fewer than three noisy pixels in the level2.evt file, extra rows are filled as -1
| Pixel properties | Quadrant properties | ||||||
|---|---|---|---|---|---|---|---|
| Quadrant | DetID | PixID | Counts | Sigma | Mean | Median | Sigma |
| A | 0 | 31 | 2204 | 44.78 | 212 | 208 | 44.6 |
| A | 0 | 226 | 1809 | 35.92 | 212 | 208 | 44.6 |
| A | 10 | 229 | 1771 | 35.07 | 212 | 208 | 44.6 |
| B | 0 | 182 | 230006 | 5484.56 | 213 | 208 | 41.9 |
| B | 7 | 220 | 21792 | 515.14 | 213 | 208 | 41.9 |
| B | 0 | 190 | 9640 | 225.11 | 213 | 208 | 41.9 |
| C | 14 | 238 | 33418 | 651.55 | 211 | 212 | 51.0 |
| C | 13 | 61 | 1490 | 25.08 | 211 | 212 | 51.0 |
| C | 9 | 54 | 807 | 11.67 | 211 | 212 | 51.0 |
| D | 1 | 52 | 243446 | 4776.45 | 206 | 199 | 50.9 |
| D | 9 | 1 | 208943 | 4098.94 | 206 | 199 | 50.9 |
| D | 13 | 104 | 30331 | 591.68 | 206 | 199 | 50.9 |
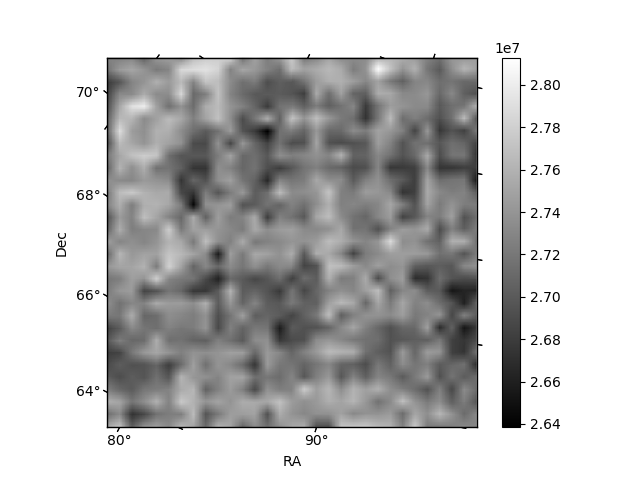
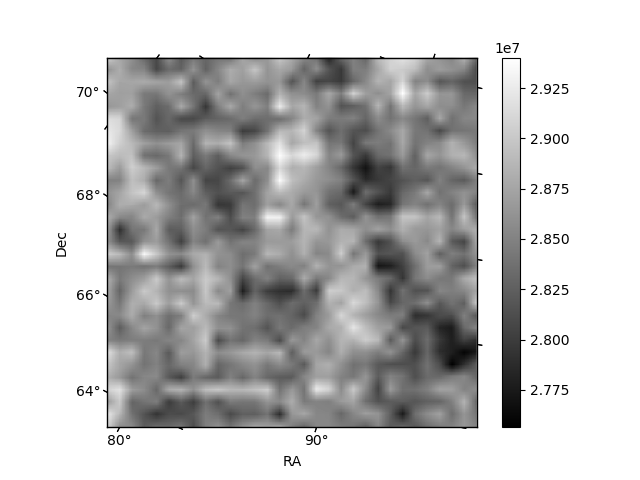
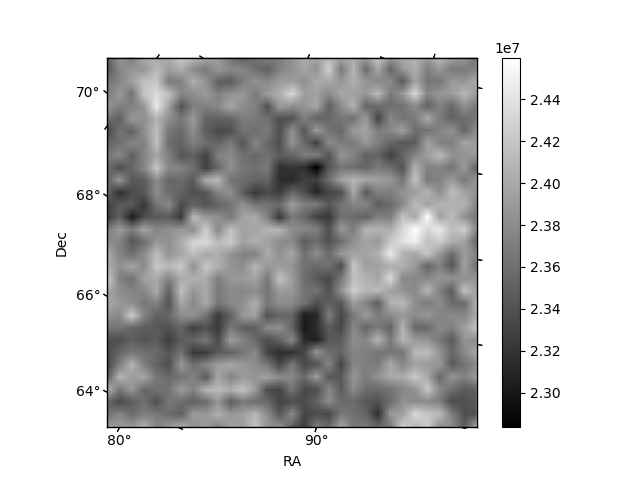
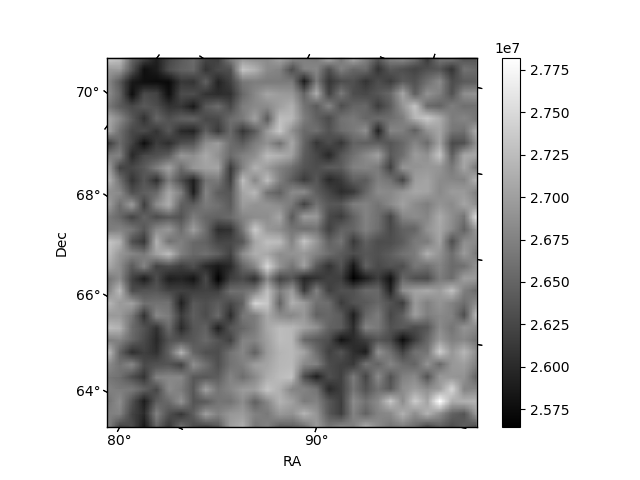
Histogram calculated using DETX and DETY for each event in the final _common_clean file
| Quadrant A | 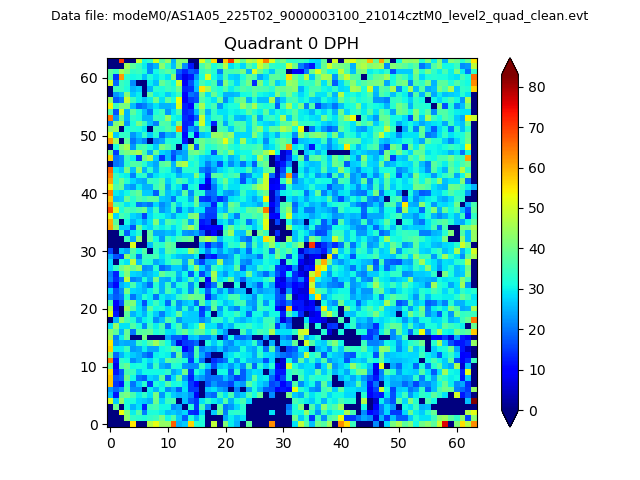 |
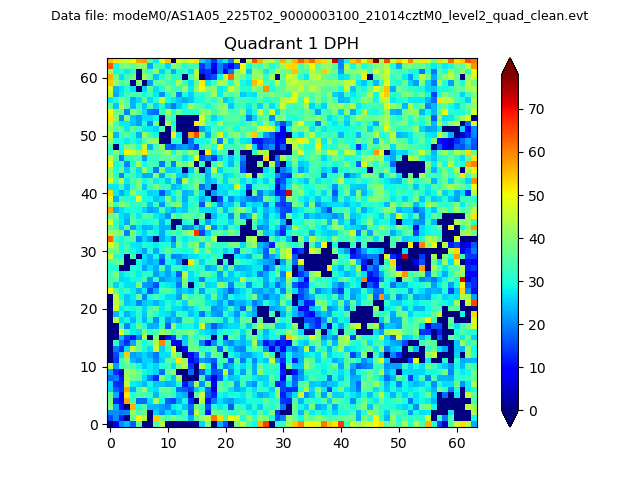 |
Quadrant B |
|---|---|---|---|
| Quadrant D | 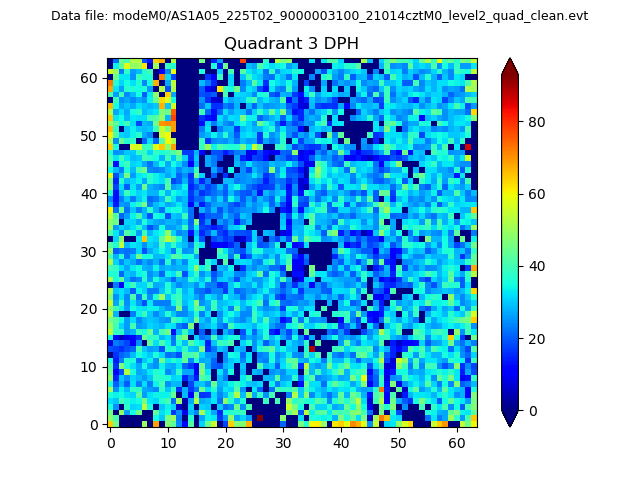 |
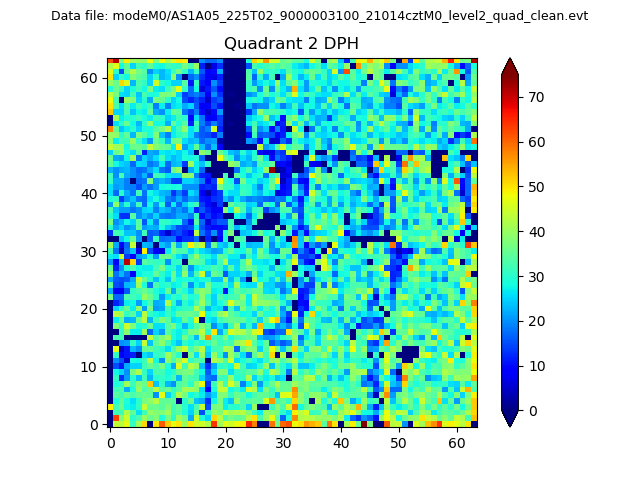 |
Quadrant C |
| Plot type | Count rate plots | Images |
|---|---|---|
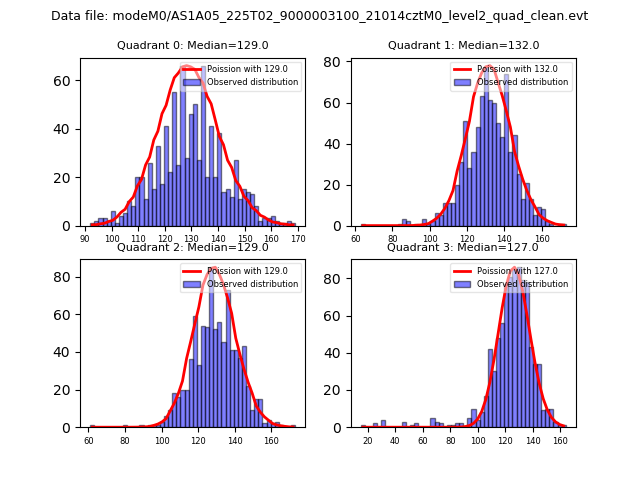
| Comparison with Poisson distribution Blue bars denote a histogram of data divided into 1 sec bins. Red curve is a Poisson curve with rate = median count rate of data. |
 |
 |
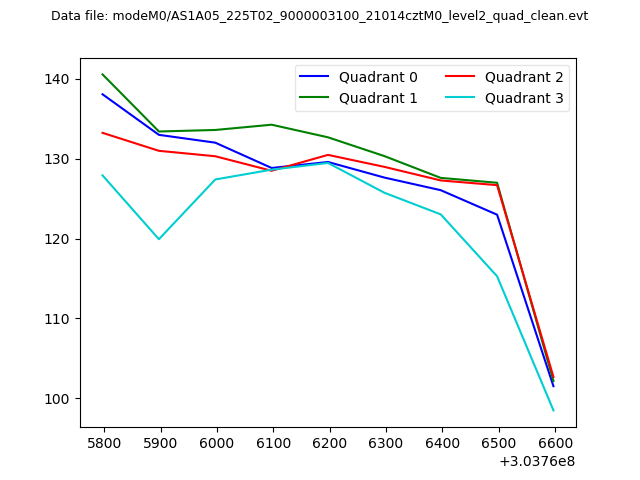
| Quadrant-wise count rates Data is divided into 100 sec bins |
 |
|
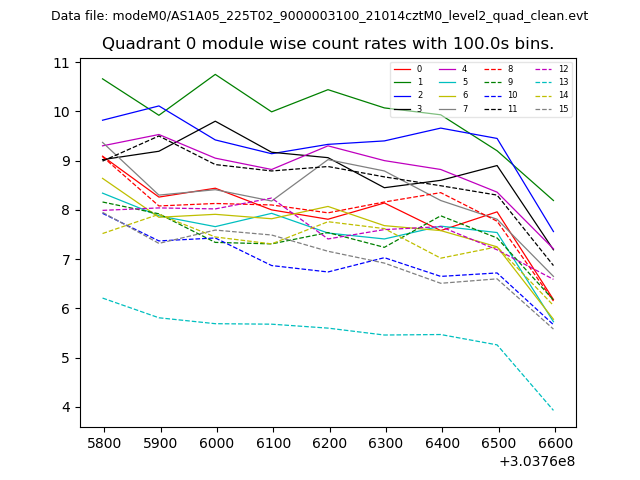
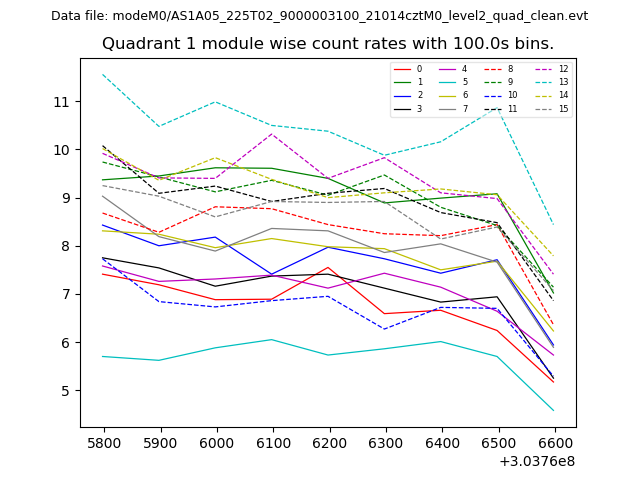
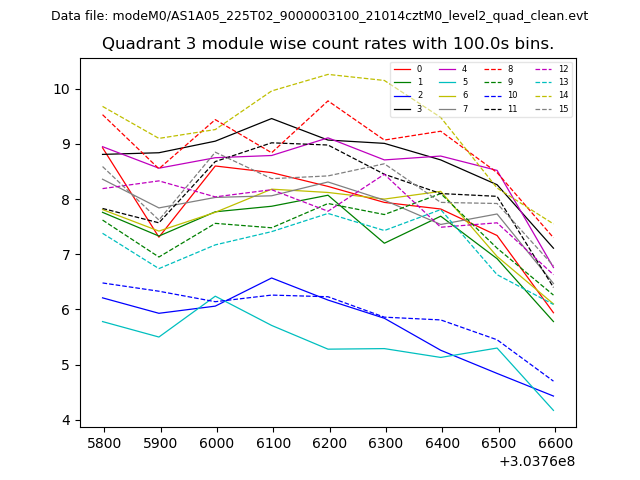
| Module-wise count rates for Quadrant A Data is divided into 100 sec bins |
 |
 |
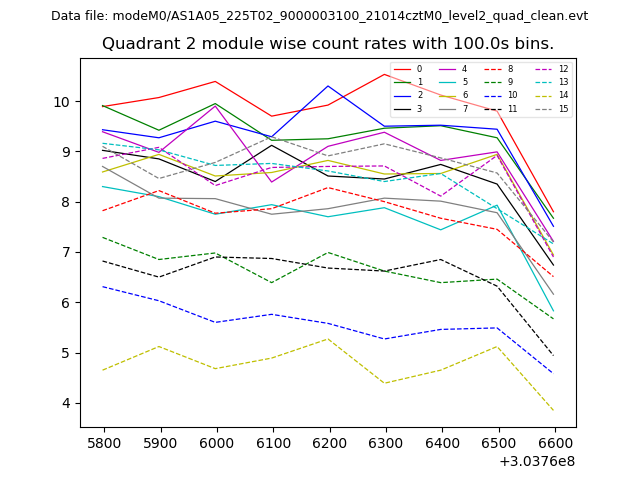
| Module-wise count rates for Quadrant B Data is divided into 100 sec bins |
 |
 |
| Module-wise count rates for Quadrant C Data is divided into 100 sec bins |
 |
 |
| Module-wise count rates for Quadrant D Data is divided into 100 sec bins |
 |
 |
| Parameter | Plot |
|---|---|
| CZT HV Monitor | 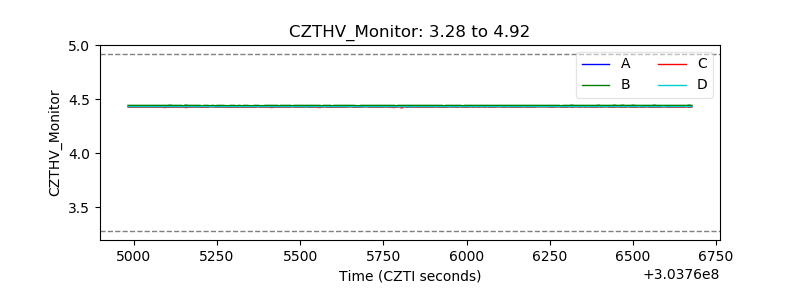 |
| D_VDD | 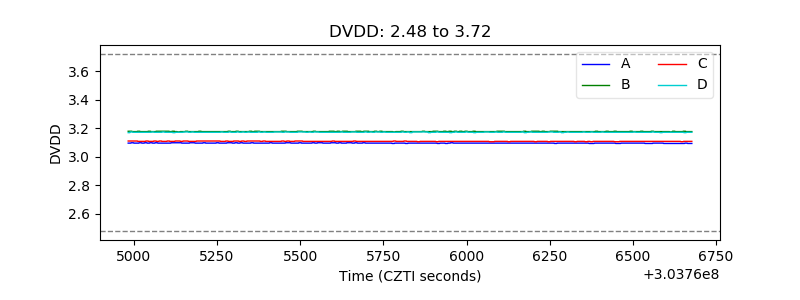 |
| Temperature 1 | 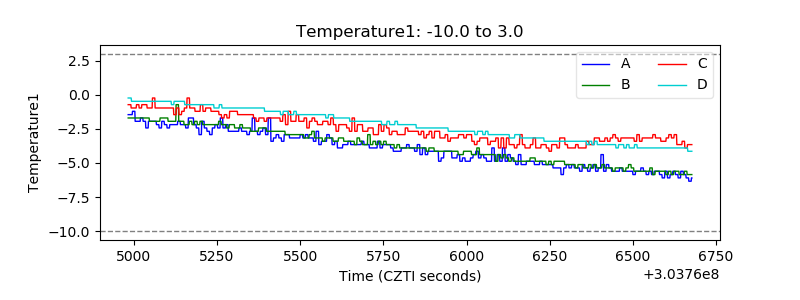 |
| Veto HV Monitor | 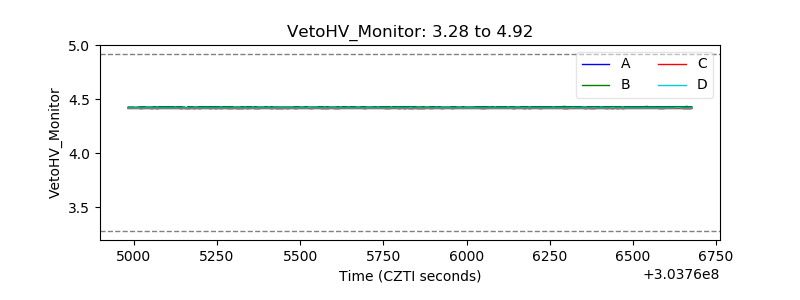 |
| Veto LLD | 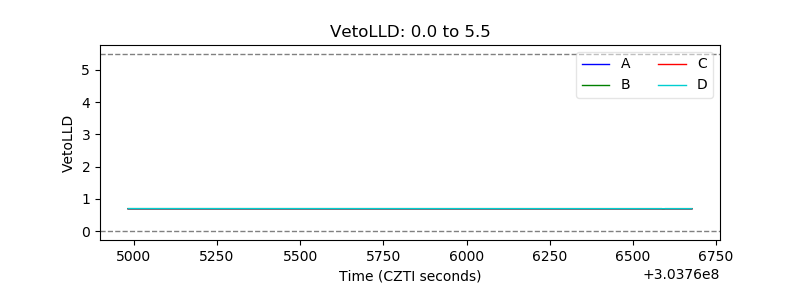 |
| Alpha Counter | 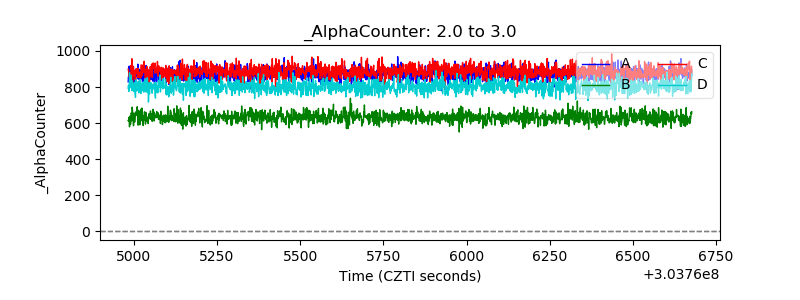 |
| _CPM_Rate | 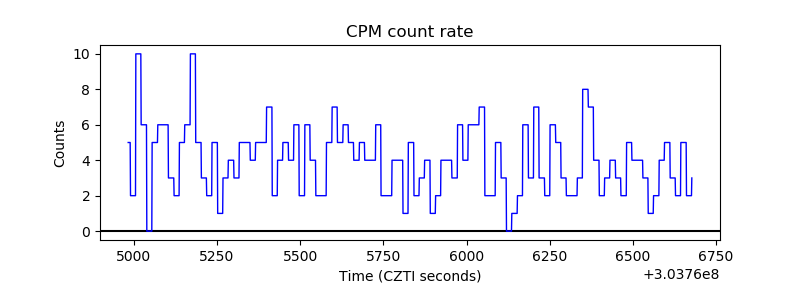 |
| CZT Counter | 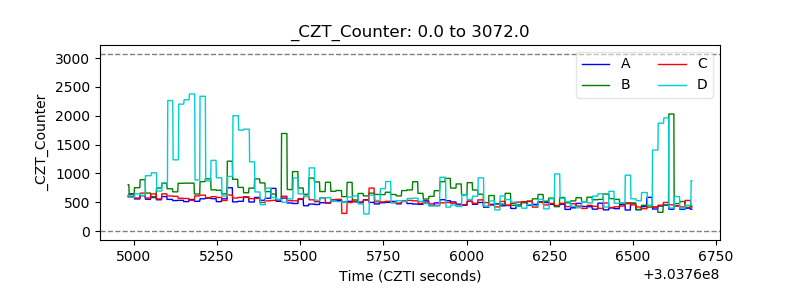 |
| +2.5 Volts monitor |  |
| +5 Volts monitor | 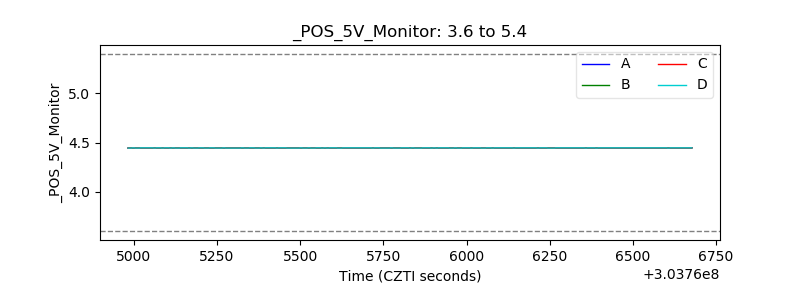 |
| _ROLL_ROT | 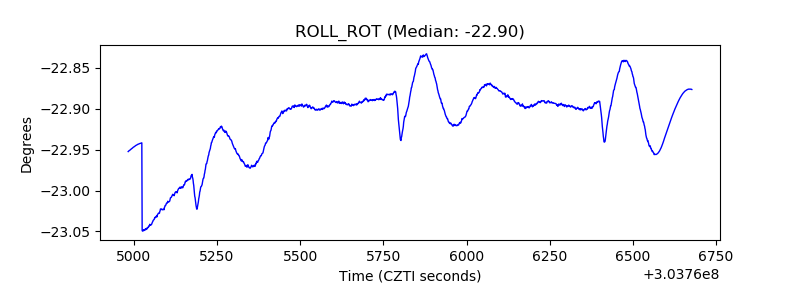 |
| _Roll_DEC | 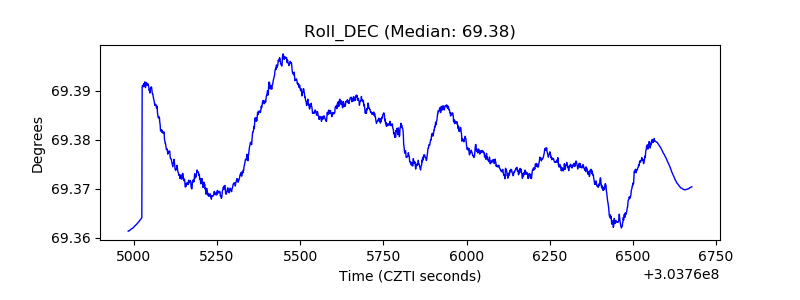 |
| _Roll_RA | 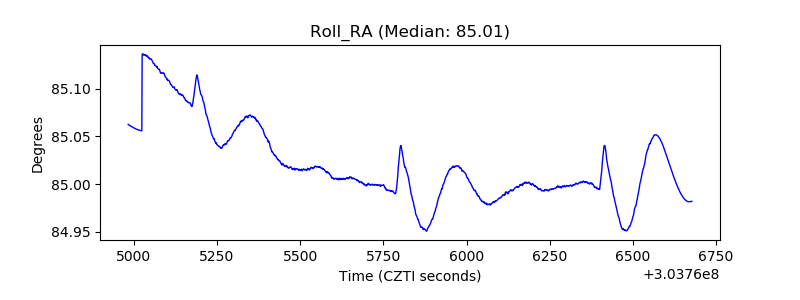 |
| Veto Counter | 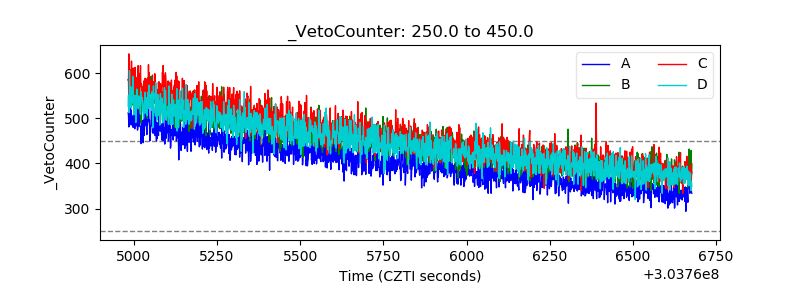 |