| Param | Original file | Final file |
|---|---|---|
| Filename | modeM0/AS1A06_009T03_9000003098cztM0_level2.fits | modeM0/AS1A06_009T03_9000003098cztM0_level2_quad_clean.evt |
| Size (bytes) | 84,692,160 | 93,156,480 |
| Size | 80.8 MB | 88.8 MB |
| Events in quadrant A | 514,358 | 579,679 |
| Events in quadrant B | 493,678 | 572,459 |
| Events in quadrant C | 505,890 | 556,057 |
| Events in quadrant D | 433,534 | 495,039 |
| Mode SS | |||
|---|---|---|---|
| Quadrant | BADHDUFLAG | Total packets | Discarded packets |
| A | 0 | 180 | 0 |
| B | 0 | 180 | 0 |
| C | 0 | 180 | 0 |
| D | 0 | 180 | 0 |
| Mode M9 | |||
|---|---|---|---|
| Quadrant | BADHDUFLAG | Total packets | Discarded packets |
| A | 0 | 9 | 0 |
| B | 0 | 9 | 0 |
| C | 0 | 9 | 0 |
| D | 0 | 9 | 0 |
| Mode M0 | |||
|---|---|---|---|
| Quadrant | BADHDUFLAG | Total packets | Discarded packets |
| A | 0 | 18310 | 0 |
| B | 0 | 20352 | 0 |
| C | 0 | 18364 | 0 |
| D | 0 | 22071 | 0 |
| Quadrant | Total seconds | Saturated seconds | Saturation percentage |
|---|---|---|---|
| A | 8903 | 164 | 1.842076% |
| B | 8903 | 314 | 3.526901% |
| C | 8903 | 234 | 2.628328% |
| D | 8903 | 342 | 3.841402% |
Noise dominated data is calculated using 1-second bins in cleaned event files. If a bin has >2000 counts, and if more than 50% of those come from <1% of pixels, then it is considered to be noise-dominated and hence unusable.
| Quadrant | # 1 sec bins | Bins with >0 counts | Bins with >2000 counts | High rate bins dominated by noise | Noise dominated (total time) | Noise dominated (detector-on time) | Marked lightcurve |
|---|---|---|---|---|---|---|---|
| A | 9753 | 8903 | 0 | 0 | 0.00% | 0.00% |  |
| B | 9753 | 8903 | 0 | 0 | 0.00% | 0.00% | 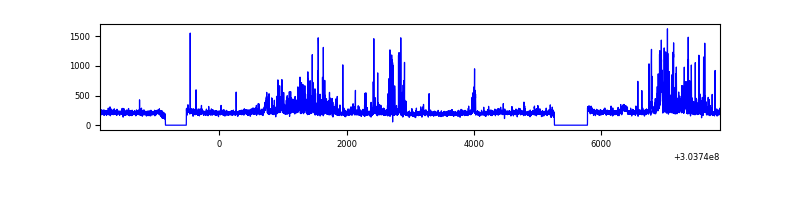 |
| C | 9753 | 8903 | 0 | 0 | 0.00% | 0.00% | 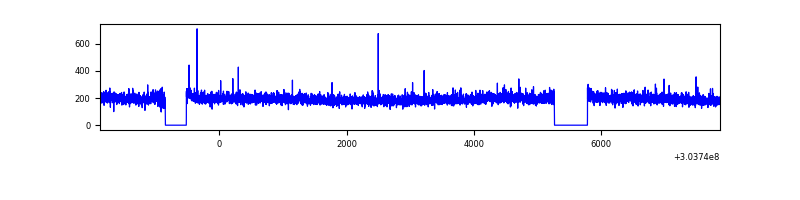 |
| D | 9753 | 8903 | 0 | 0 | 0.00% | 0.00% |  |
Top three noisy pixels from each quadrant. If the there are fewer than three noisy pixels in the level2.evt file, extra rows are filled as -1
| Pixel properties | Quadrant properties | ||||||
|---|---|---|---|---|---|---|---|
| Quadrant | DetID | PixID | Counts | Sigma | Mean | Median | Sigma |
| A | 0 | 29 | 477 | 10.0 | 133 | 125 | 35.2 |
| A | 7 | 110 | 436 | 8.84 | 133 | 125 | 35.2 |
| A | 9 | 19 | 394 | 7.64 | 133 | 125 | 35.2 |
| B | 2 | 9 | 353 | 8.04 | 130 | 123 | 28.6 |
| B | 3 | 17 | 333 | 7.34 | 130 | 123 | 28.6 |
| B | 4 | 227 | 332 | 7.3 | 130 | 123 | 28.6 |
| C | 12 | 241 | 360 | 6.5 | 133 | 124 | 36.3 |
| C | 7 | 111 | 353 | 6.31 | 133 | 124 | 36.3 |
| C | 12 | 250 | 332 | 5.73 | 133 | 124 | 36.3 |
| D | 7 | 3 | 348 | 6.85 | 123 | 112 | 34.4 |
| D | 6 | 231 | 324 | 6.15 | 123 | 112 | 34.4 |
| D | 1 | 31 | 305 | 5.6 | 123 | 112 | 34.4 |
Histogram calculated using DETX and DETY for each event in the final _common_clean file
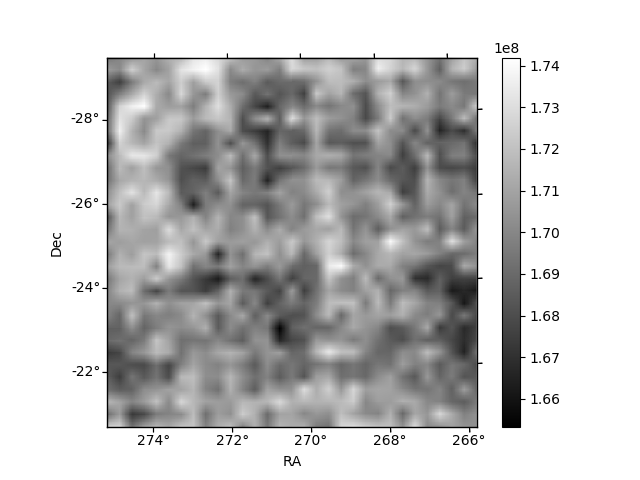
| Quadrant A |  |
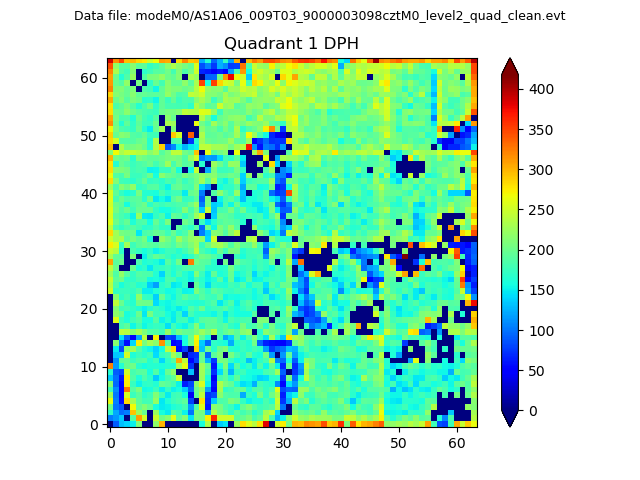 |
Quadrant B |
|---|---|---|---|
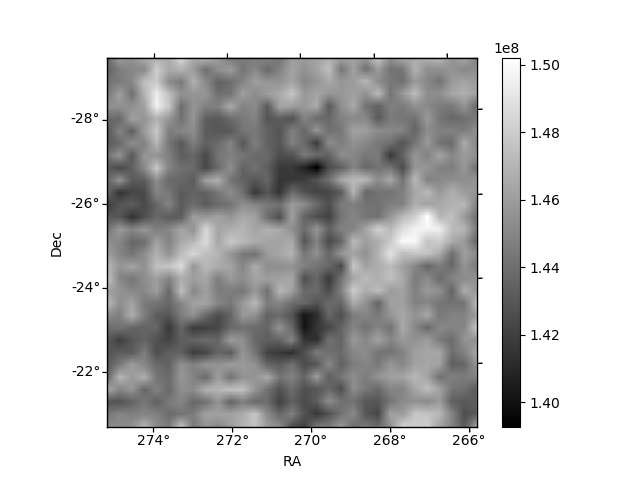
| Quadrant D | 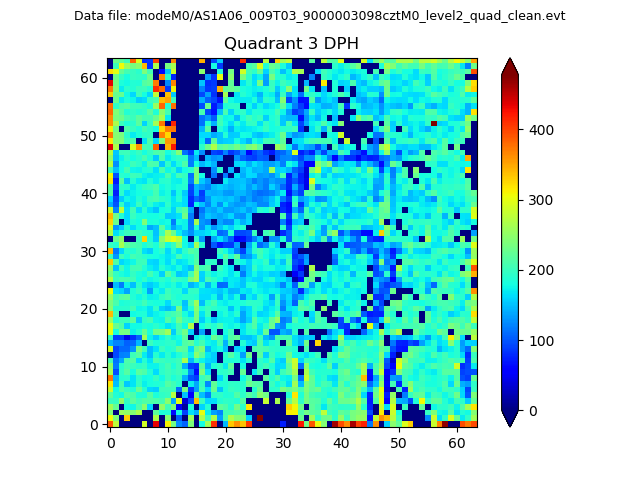 |
 |
Quadrant C |
| Plot type | Count rate plots | Images |
|---|---|---|
| Comparison with Poisson distribution Blue bars denote a histogram of data divided into 1 sec bins. Red curve is a Poisson curve with rate = median count rate of data. |
 |
 |
| Quadrant-wise count rates Data is divided into 100 sec bins |
 |
|
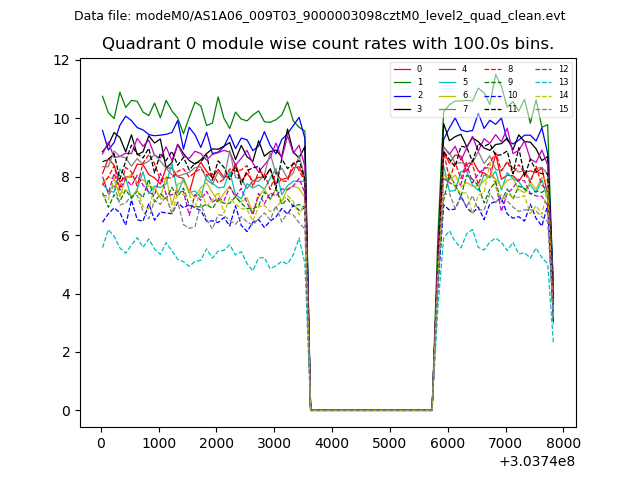
| Module-wise count rates for Quadrant A Data is divided into 100 sec bins |
 |
 |
| Module-wise count rates for Quadrant B Data is divided into 100 sec bins |
 |
 |
| Module-wise count rates for Quadrant C Data is divided into 100 sec bins |
 |
 |
| Module-wise count rates for Quadrant D Data is divided into 100 sec bins |
 |
 |
| Parameter | Plot |
|---|---|
| CZT HV Monitor |  |
| D_VDD | 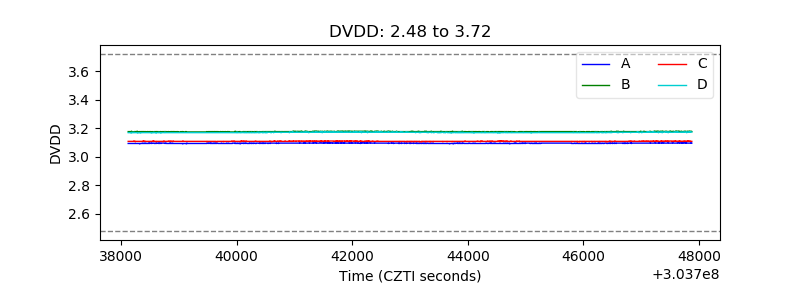 |
| Temperature 1 |  |
| Veto HV Monitor | 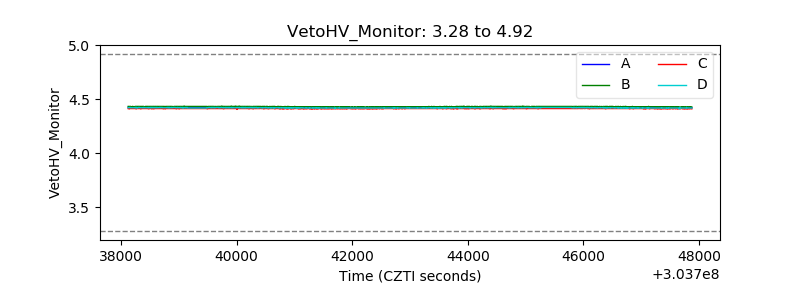 |
| Veto LLD | 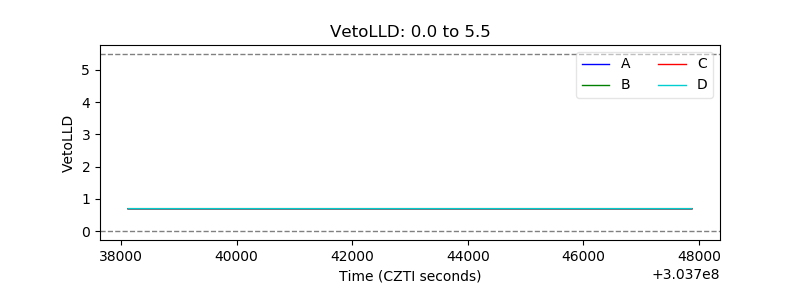 |
| Alpha Counter |  |
| _CPM_Rate | 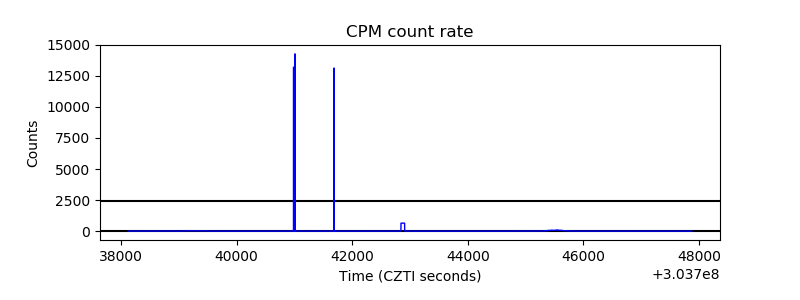 |
| CZT Counter |  |
| +2.5 Volts monitor |  |
| +5 Volts monitor | 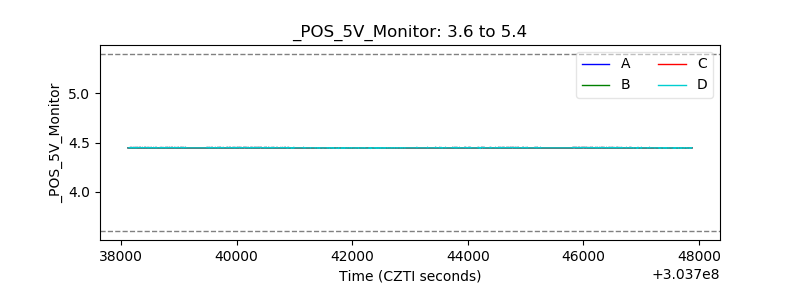 |
| _ROLL_ROT | 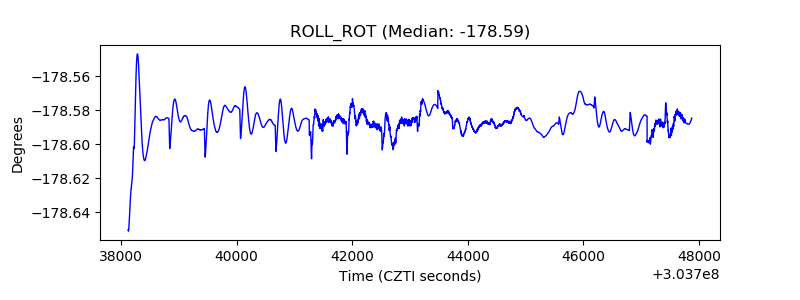 |
| _Roll_DEC |  |
| _Roll_RA |  |
| Veto Counter |  |