| Param | Original file | Final file |
|---|---|---|
| Filename | modeM0/AS1A06_009T03_9000003098_21012cztM0_level2.evt | modeM0/AS1A06_009T03_9000003098_21012cztM0_level2_quad_clean.evt |
| Size (bytes) | 502,542,720 | 101,018,880 |
| Size | 479.3 MB | 96.3 MB |
| Events in quadrant A | 3,223,636 | 659,878 |
| Events in quadrant B | 3,931,946 | 659,097 |
| Events in quadrant C | 3,240,789 | 642,235 |
| Events in quadrant D | 4,353,990 | 616,598 |
| Mode SS | |||
|---|---|---|---|
| Quadrant | BADHDUFLAG | Total packets | Discarded packets |
| A | 0 | 138 | 0 |
| B | 0 | 138 | 0 |
| C | 0 | 138 | 0 |
| D | 0 | 138 | 0 |
| Mode M9 | |||
|---|---|---|---|
| Quadrant | BADHDUFLAG | Total packets | Discarded packets |
| A | 0 | 6 | 0 |
| B | 0 | 6 | 0 |
| C | 0 | 6 | 0 |
| D | 0 | 6 | 0 |
| Mode M0 | |||
|---|---|---|---|
| Quadrant | BADHDUFLAG | Total packets | Discarded packets |
| A | 0 | 14071 | 1 |
| B | 0 | 16065 | 1 |
| C | 0 | 14092 | 1 |
| D | 0 | 17442 | 1 |
| Quadrant | Total seconds | Saturated seconds | Saturation percentage |
|---|---|---|---|
| A | 6918 | 50 | 0.722752% |
| B | 6918 | 178 | 2.572998% |
| C | 6918 | 86 | 1.243134% |
| D | 6919 | 200 | 2.890591% |
Noise dominated data is calculated using 1-second bins in cleaned event files. If a bin has >2000 counts, and if more than 50% of those come from <1% of pixels, then it is considered to be noise-dominated and hence unusable.
| Quadrant | # 1 sec bins | Bins with >0 counts | Bins with >2000 counts | High rate bins dominated by noise | Noise dominated (total time) | Noise dominated (detector-on time) | Marked lightcurve |
|---|---|---|---|---|---|---|---|
| A | 7438 | 6919 | 0 | 0 | 0.00% | 0.00% |  |
| B | 7438 | 6919 | 63 | 63 | 0.85% | 0.91% |  |
| C | 7438 | 6919 | 0 | 0 | 0.00% | 0.00% |  |
| D | 7439 | 6920 | 148 | 148 | 1.99% | 2.14% | 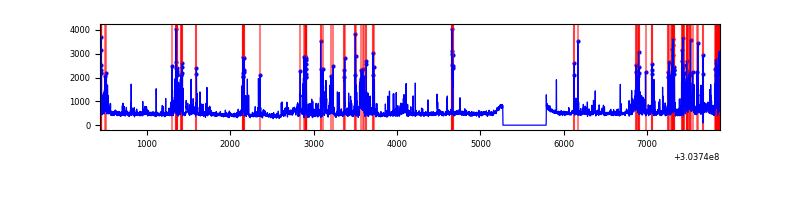 |
Top three noisy pixels from each quadrant. If the there are fewer than three noisy pixels in the level2.evt file, extra rows are filled as -1
| Pixel properties | Quadrant properties | ||||||
|---|---|---|---|---|---|---|---|
| Quadrant | DetID | PixID | Counts | Sigma | Mean | Median | Sigma |
| A | 0 | 226 | 7248 | 37.92 | 837 | 820 | 169.5 |
| A | 3 | 137 | 6931 | 36.05 | 837 | 820 | 169.5 |
| A | 12 | 194 | 6074 | 31.0 | 837 | 820 | 169.5 |
| B | 7 | 220 | 509589 | 3214.25 | 826 | 803 | 158.3 |
| B | 0 | 189 | 75723 | 473.31 | 826 | 803 | 158.3 |
| B | 0 | 230 | 29688 | 182.48 | 826 | 803 | 158.3 |
| C | 14 | 238 | 123806 | 650.92 | 798 | 807 | 189.0 |
| C | 13 | 61 | 5613 | 25.43 | 798 | 807 | 189.0 |
| C | 10 | 91 | 2865 | 10.89 | 798 | 807 | 189.0 |
| D | 9 | 1 | 826486 | 4212.71 | 805 | 781 | 196.0 |
| D | 15 | 0 | 119049 | 603.4 | 805 | 781 | 196.0 |
| D | 13 | 104 | 79839 | 403.35 | 805 | 781 | 196.0 |
Histogram calculated using DETX and DETY for each event in the final _common_clean file
| Quadrant A |  |
 |
Quadrant B |
|---|---|---|---|
| Quadrant D |  |
 |
Quadrant C |
| Plot type | Count rate plots | Images |
|---|---|---|
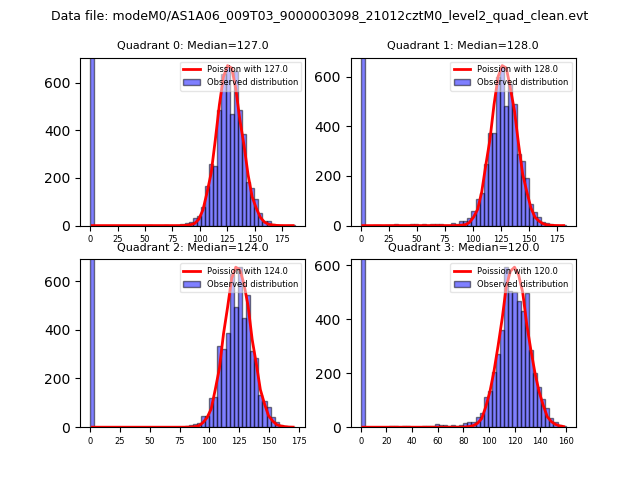
| Comparison with Poisson distribution Blue bars denote a histogram of data divided into 1 sec bins. Red curve is a Poisson curve with rate = median count rate of data. |
 |
 |
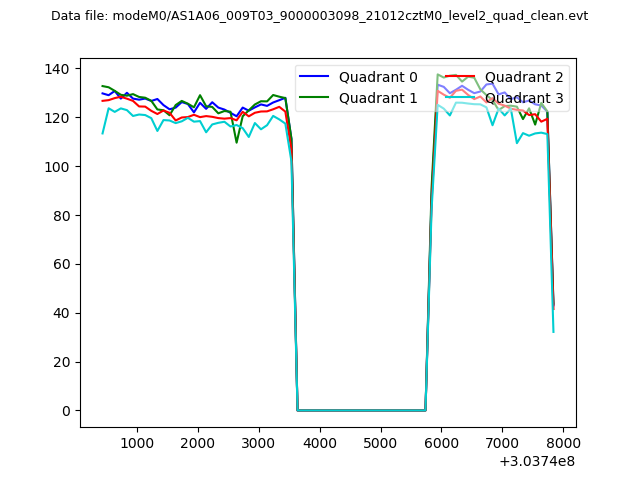
| Quadrant-wise count rates Data is divided into 100 sec bins |
 |
|
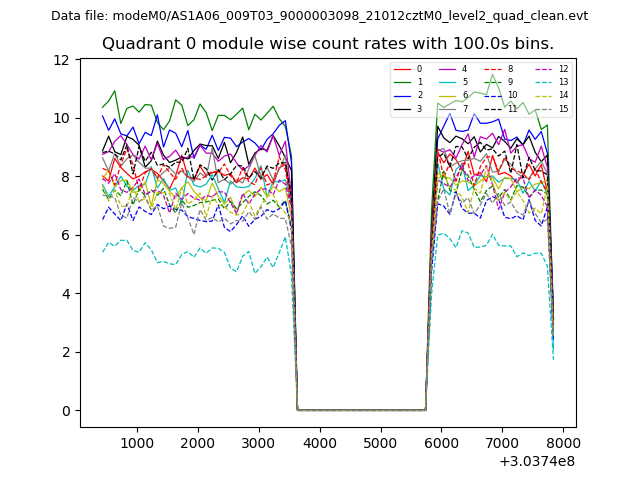
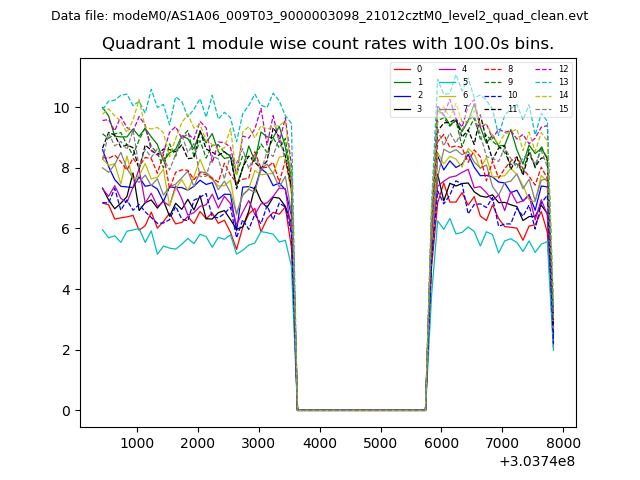
| Module-wise count rates for Quadrant A Data is divided into 100 sec bins |
 |
 |
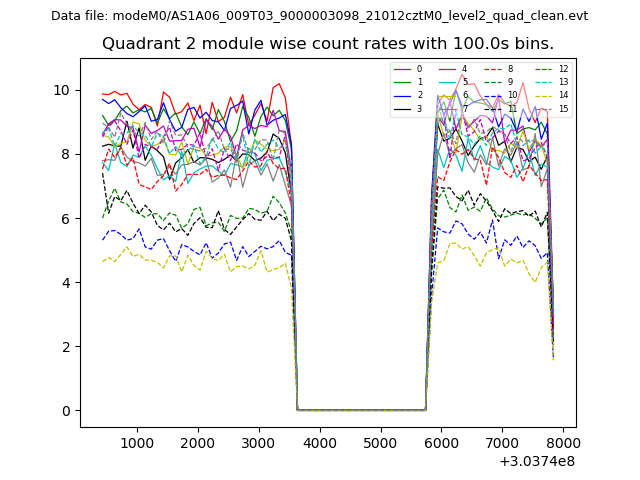
| Module-wise count rates for Quadrant B Data is divided into 100 sec bins |
 |
 |
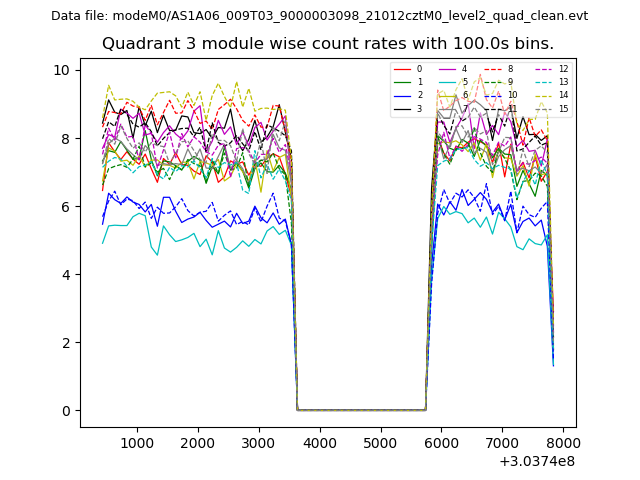
| Module-wise count rates for Quadrant C Data is divided into 100 sec bins |
 |
 |
| Module-wise count rates for Quadrant D Data is divided into 100 sec bins |
 |
 |
| Parameter | Plot |
|---|---|
| CZT HV Monitor | 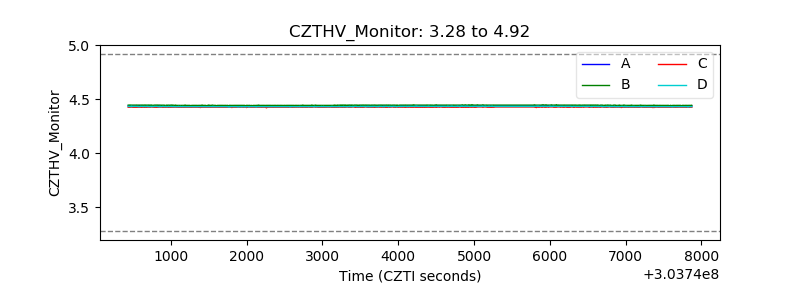 |
| D_VDD |  |
| Temperature 1 |  |
| Veto HV Monitor |  |
| Veto LLD |  |
| Alpha Counter | 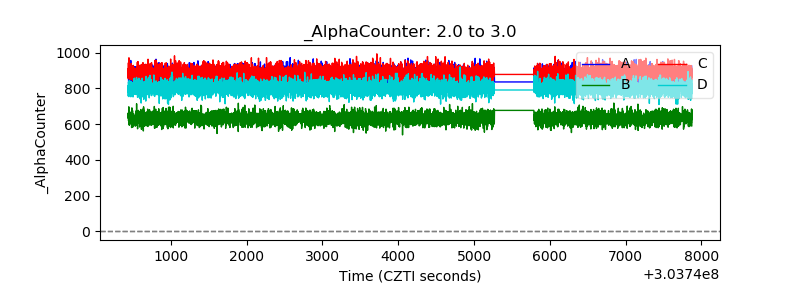 |
| _CPM_Rate | 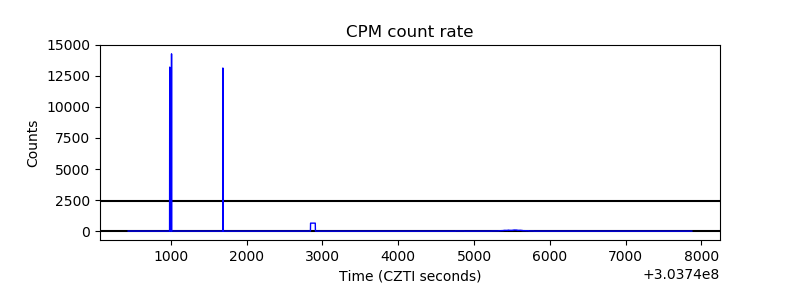 |
| CZT Counter |  |
| +2.5 Volts monitor |  |
| +5 Volts monitor |  |
| _ROLL_ROT | 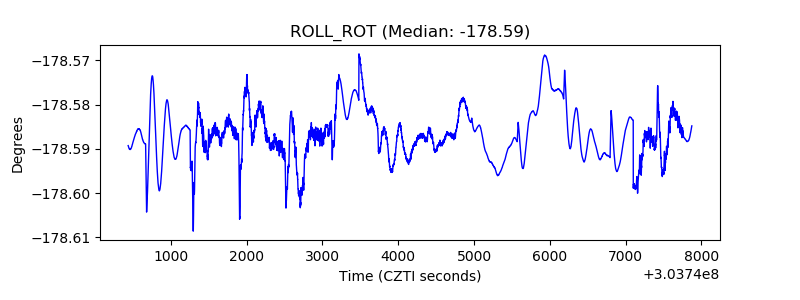 |
| _Roll_DEC |  |
| _Roll_RA |  |
| Veto Counter | 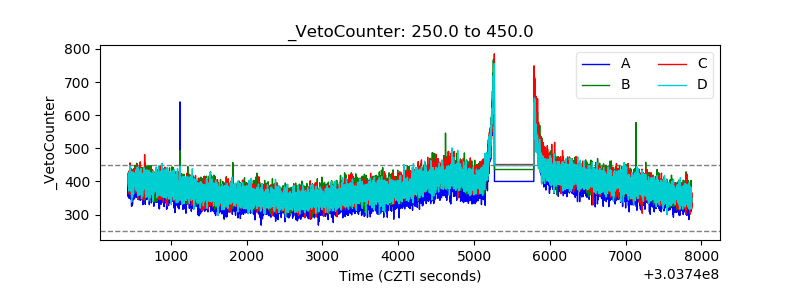 |