| Param | Original file | Final file |
|---|---|---|
| Filename | modeM0/AS1A05_075T06_9000003104cztM0_level2.fits | modeM0/AS1A05_075T06_9000003104cztM0_level2_quad_clean.evt |
| Size (bytes) | 555,396,480 | 567,008,640 |
| Size | 529.7 MB | 540.7 MB |
| Events in quadrant A | 3,416,560 | 3,490,228 |
| Events in quadrant B | 3,243,392 | 3,449,877 |
| Events in quadrant C | 3,307,622 | 3,253,075 |
| Events in quadrant D | 2,877,090 | 3,004,138 |
| Mode SS | |||
|---|---|---|---|
| Quadrant | BADHDUFLAG | Total packets | Discarded packets |
| A | 0 | 1182 | 0 |
| B | 0 | 1182 | 0 |
| C | 0 | 1182 | 0 |
| D | 0 | 1182 | 0 |
| Mode M9 | |||
|---|---|---|---|
| Quadrant | BADHDUFLAG | Total packets | Discarded packets |
| A | 0 | 89 | 0 |
| B | 0 | 89 | 0 |
| C | 0 | 89 | 0 |
| D | 0 | 89 | 0 |
| Mode M0 | |||
|---|---|---|---|
| Quadrant | BADHDUFLAG | Total packets | Discarded packets |
| A | 0 | 119011 | 0 |
| B | 0 | 133011 | 0 |
| C | 0 | 123761 | 0 |
| D | 0 | 135830 | 0 |
| Quadrant | Total seconds | Saturated seconds | Saturation percentage |
|---|---|---|---|
| A | 57940 | 634 | 1.094235% |
| B | 57940 | 1490 | 2.571626% |
| C | 57940 | 1346 | 2.323093% |
| D | 57940 | 1349 | 2.328271% |
Noise dominated data is calculated using 1-second bins in cleaned event files. If a bin has >2000 counts, and if more than 50% of those come from <1% of pixels, then it is considered to be noise-dominated and hence unusable.
| Quadrant | # 1 sec bins | Bins with >0 counts | Bins with >2000 counts | High rate bins dominated by noise | Noise dominated (total time) | Noise dominated (detector-on time) | Marked lightcurve |
|---|---|---|---|---|---|---|---|
| A | 66925 | 57941 | 0 | 0 | 0.00% | 0.00% |  |
| B | 66925 | 57938 | 0 | 0 | 0.00% | 0.00% |  |
| C | 66925 | 57940 | 0 | 0 | 0.00% | 0.00% |  |
| D | 66925 | 57914 | 0 | 0 | 0.00% | 0.00% |  |
Top three noisy pixels from each quadrant. If the there are fewer than three noisy pixels in the level2.evt file, extra rows are filled as -1
| Pixel properties | Quadrant properties | ||||||
|---|---|---|---|---|---|---|---|
| Quadrant | DetID | PixID | Counts | Sigma | Mean | Median | Sigma |
| A | 0 | 29 | 3365 | 11.39 | 889 | 834 | 222.1 |
| A | 7 | 110 | 2799 | 8.85 | 889 | 834 | 222.1 |
| A | 0 | 30 | 2619 | 8.04 | 889 | 834 | 222.1 |
| B | 2 | 9 | 2618 | 10.56 | 858 | 818 | 170.4 |
| B | 2 | 8 | 2249 | 8.4 | 858 | 818 | 170.4 |
| B | 3 | 17 | 2208 | 8.16 | 858 | 818 | 170.4 |
| C | 12 | 249 | 2243 | 6.44 | 873 | 817 | 221.6 |
| C | 12 | 241 | 2236 | 6.4 | 873 | 817 | 221.6 |
| C | 2 | 191 | 2236 | 6.4 | 873 | 817 | 221.6 |
| D | 15 | 46 | 2135 | 6.32 | 822 | 747 | 219.5 |
| D | 6 | 231 | 2059 | 5.98 | 822 | 747 | 219.5 |
| D | 3 | 14 | 2048 | 5.93 | 822 | 747 | 219.5 |
Histogram calculated using DETX and DETY for each event in the final _common_clean file
| Quadrant A |  |
 |
Quadrant B |
|---|---|---|---|
| Quadrant D |  |
 |
Quadrant C |
| Plot type | Count rate plots | Images |
|---|---|---|
| Comparison with Poisson distribution Blue bars denote a histogram of data divided into 1 sec bins. Red curve is a Poisson curve with rate = median count rate of data. |
 |
 |
| Quadrant-wise count rates Data is divided into 100 sec bins |
 |
|
| Module-wise count rates for Quadrant A Data is divided into 100 sec bins |
 |
 |
| Module-wise count rates for Quadrant B Data is divided into 100 sec bins |
 |
 |
| Module-wise count rates for Quadrant C Data is divided into 100 sec bins |
 |
 |
| Module-wise count rates for Quadrant D Data is divided into 100 sec bins |
 |
 |
| Parameter | Plot |
|---|---|
| CZT HV Monitor |  |
| D_VDD | 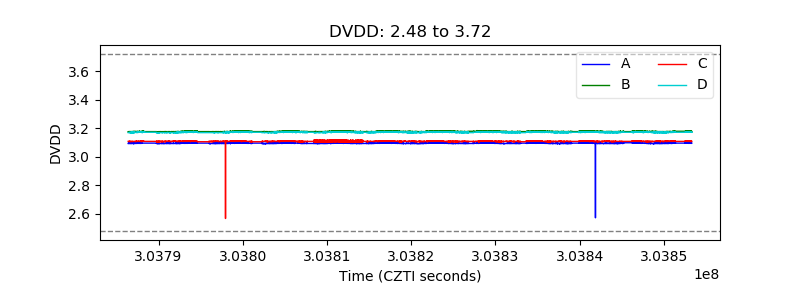 |
| Temperature 1 |  |
| Veto HV Monitor |  |
| Veto LLD |  |
| Alpha Counter |  |
| _CPM_Rate |  |
| CZT Counter |  |
| +2.5 Volts monitor |  |
| +5 Volts monitor |  |
| _ROLL_ROT |  |
| _Roll_DEC |  |
| _Roll_RA |  |
| Veto Counter |  |