| Param | Original file | Final file |
|---|---|---|
| Filename | modeM0/AS1A05_075T06_9000003104_21019cztM0_level2.evt | modeM0/AS1A05_075T06_9000003104_21019cztM0_level2_quad_clean.evt |
| Size (bytes) | 479,468,160 | 85,812,480 |
| Size | 457.3 MB | 81.8 MB |
| Events in quadrant A | 3,173,425 | 553,229 |
| Events in quadrant B | 4,170,305 | 544,439 |
| Events in quadrant C | 3,205,453 | 530,340 |
| Events in quadrant D | 3,532,039 | 519,085 |
| Mode SS | |||
|---|---|---|---|
| Quadrant | BADHDUFLAG | Total packets | Discarded packets |
| A | 0 | 132 | 0 |
| B | 0 | 132 | 0 |
| C | 0 | 132 | 0 |
| D | 0 | 132 | 0 |
| Mode M9 | |||
|---|---|---|---|
| Quadrant | BADHDUFLAG | Total packets | Discarded packets |
| A | 0 | 11 | 0 |
| B | 0 | 12 | 0 |
| C | 0 | 12 | 0 |
| D | 0 | 12 | 0 |
| Mode M0 | |||
|---|---|---|---|
| Quadrant | BADHDUFLAG | Total packets | Discarded packets |
| A | 0 | 13348 | 2 |
| B | 0 | 16370 | 2 |
| C | 0 | 13448 | 2 |
| D | 0 | 14720 | 2 |
| Quadrant | Total seconds | Saturated seconds | Saturation percentage |
|---|---|---|---|
| A | 6470 | 77 | 1.190108% |
| B | 6470 | 268 | 4.142195% |
| C | 6470 | 96 | 1.483771% |
| D | 6470 | 102 | 1.576507% |
Noise dominated data is calculated using 1-second bins in cleaned event files. If a bin has >2000 counts, and if more than 50% of those come from <1% of pixels, then it is considered to be noise-dominated and hence unusable.
| Quadrant | # 1 sec bins | Bins with >0 counts | Bins with >2000 counts | High rate bins dominated by noise | Noise dominated (total time) | Noise dominated (detector-on time) | Marked lightcurve |
|---|---|---|---|---|---|---|---|
| A | 7560 | 6471 | 0 | 0 | 0.00% | 0.00% | 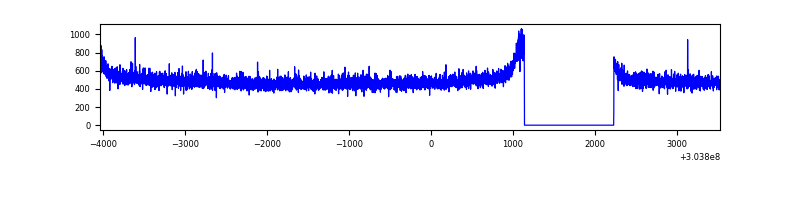 |
| B | 7560 | 6471 | 105 | 105 | 1.39% | 1.62% | 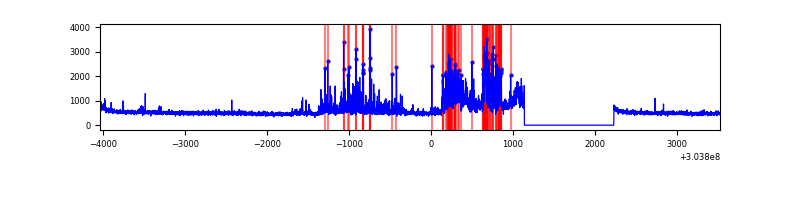 |
| C | 7560 | 6471 | 4 | 4 | 0.05% | 0.06% | 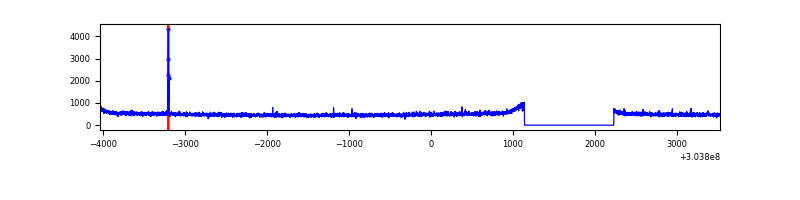 |
| D | 7560 | 6471 | 43 | 43 | 0.57% | 0.66% | 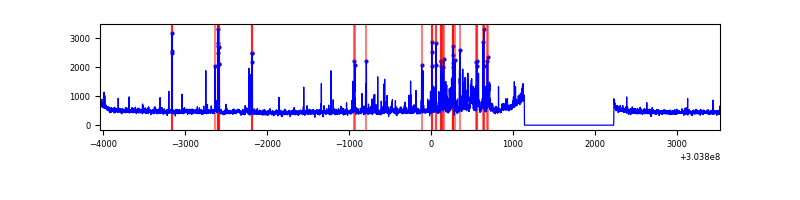 |
Top three noisy pixels from each quadrant. If the there are fewer than three noisy pixels in the level2.evt file, extra rows are filled as -1
| Pixel properties | Quadrant properties | ||||||
|---|---|---|---|---|---|---|---|
| Quadrant | DetID | PixID | Counts | Sigma | Mean | Median | Sigma |
| A | 10 | 229 | 7917 | 42.99 | 821 | 805 | 165.4 |
| A | 0 | 226 | 7138 | 38.28 | 821 | 805 | 165.4 |
| A | 3 | 137 | 6399 | 33.82 | 821 | 805 | 165.4 |
| B | 0 | 182 | 617055 | 3978.21 | 812 | 790 | 154.9 |
| B | 7 | 220 | 254485 | 1637.69 | 812 | 790 | 154.9 |
| B | 0 | 189 | 25045 | 156.57 | 812 | 790 | 154.9 |
| C | 14 | 238 | 124884 | 685.83 | 782 | 787 | 180.9 |
| C | 9 | 54 | 25503 | 136.6 | 782 | 787 | 180.9 |
| C | 13 | 250 | 8474 | 42.48 | 782 | 787 | 180.9 |
| D | 1 | 52 | 231375 | 1206.93 | 793 | 770 | 191.1 |
| D | 5 | 32 | 127507 | 663.31 | 793 | 770 | 191.1 |
| D | 7 | 238 | 113474 | 589.86 | 793 | 770 | 191.1 |
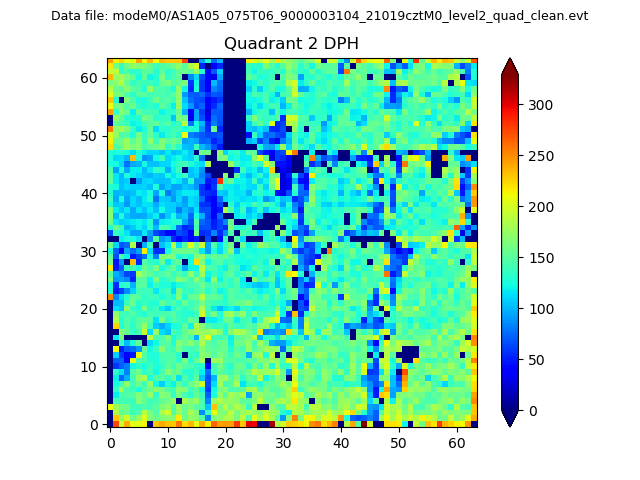
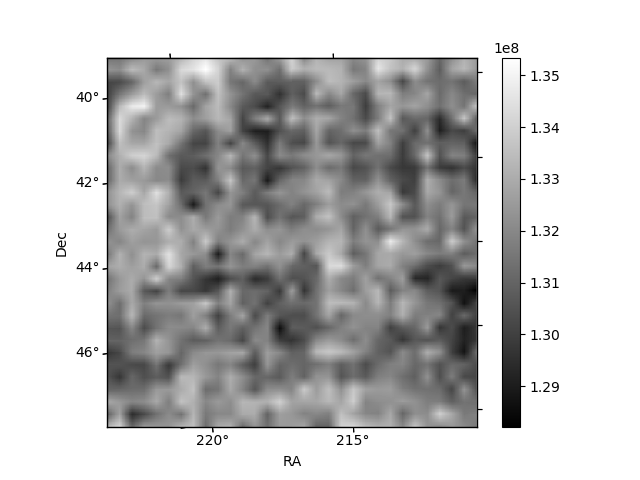
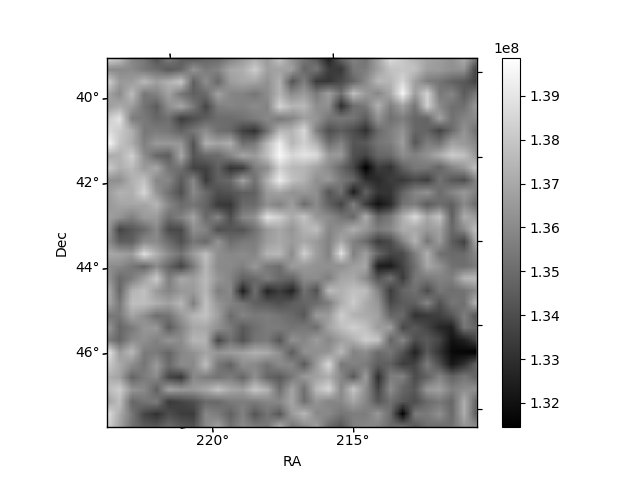
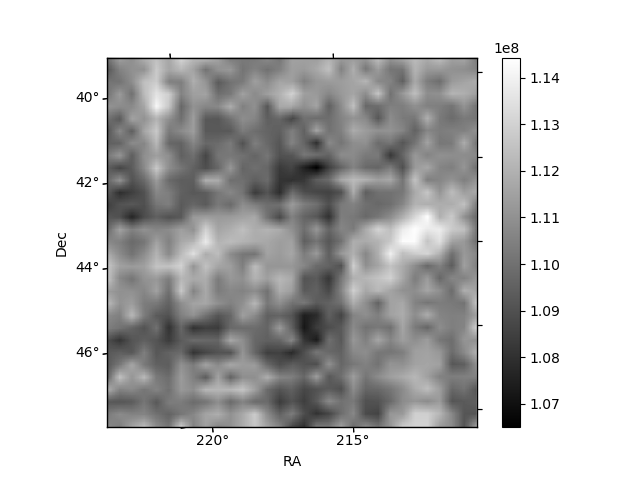
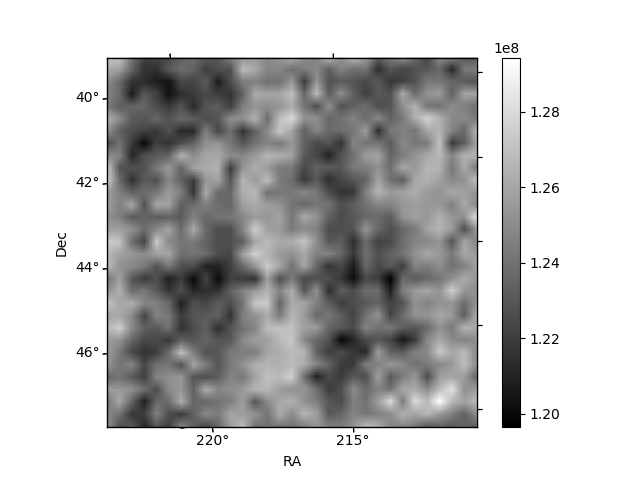
Histogram calculated using DETX and DETY for each event in the final _common_clean file
| Quadrant A | 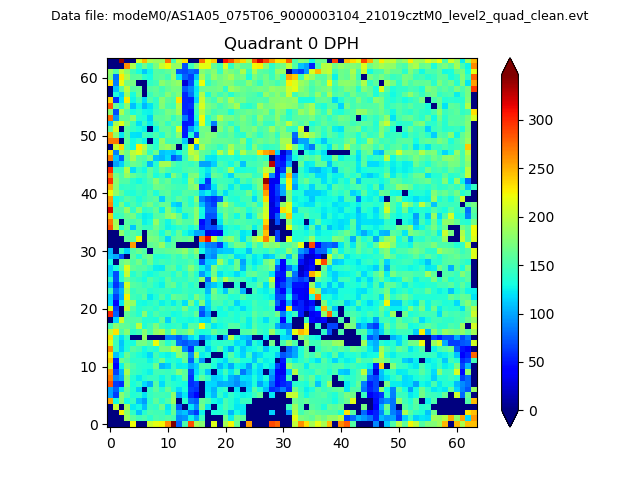 |
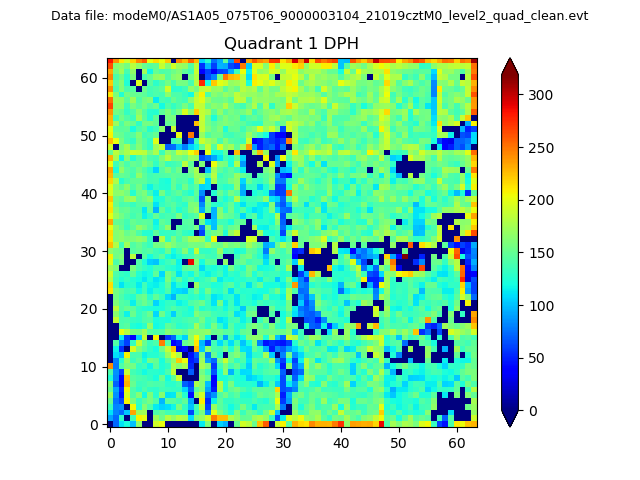 |
Quadrant B |
|---|---|---|---|
| Quadrant D | 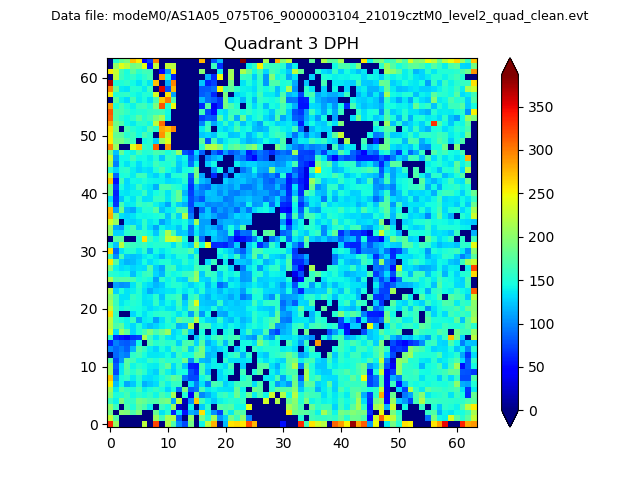 |
 |
Quadrant C |
| Plot type | Count rate plots | Images |
|---|---|---|
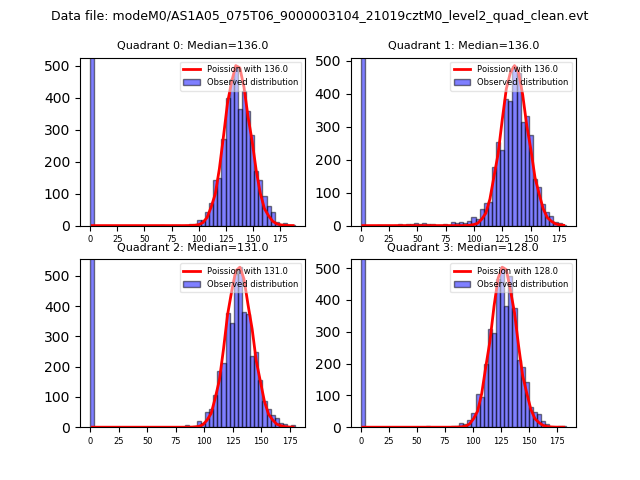
| Comparison with Poisson distribution Blue bars denote a histogram of data divided into 1 sec bins. Red curve is a Poisson curve with rate = median count rate of data. |
 |
 |
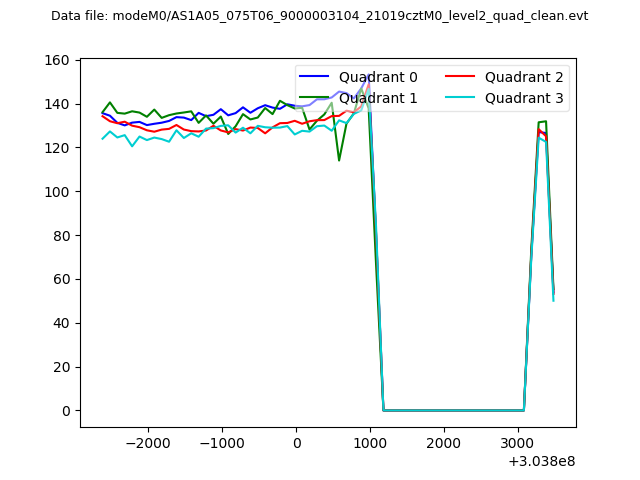
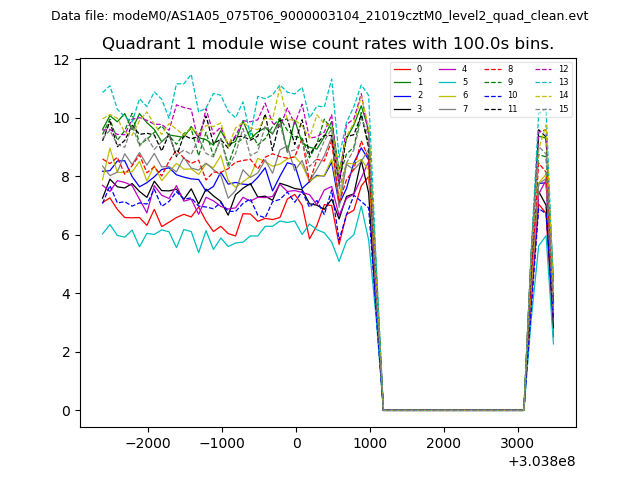
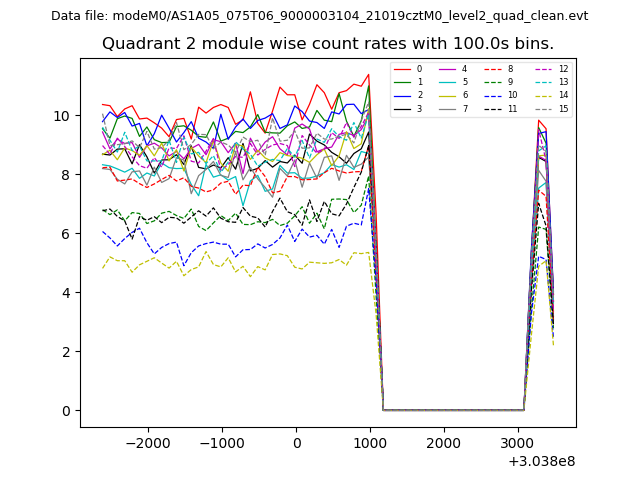
| Quadrant-wise count rates Data is divided into 100 sec bins |
 |
|
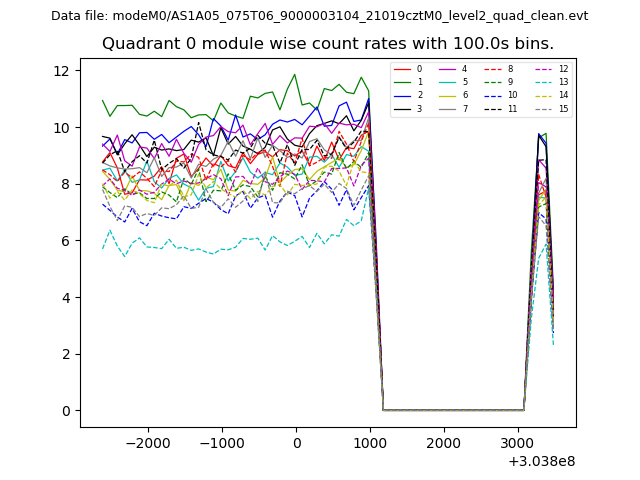
| Module-wise count rates for Quadrant A Data is divided into 100 sec bins |
 |
 |
| Module-wise count rates for Quadrant B Data is divided into 100 sec bins |
 |
 |
| Module-wise count rates for Quadrant C Data is divided into 100 sec bins |
 |
 |
| Module-wise count rates for Quadrant D Data is divided into 100 sec bins |
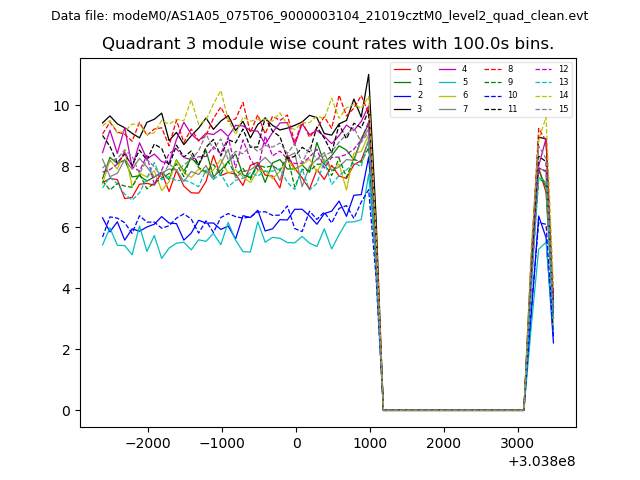 |
 |
| Parameter | Plot |
|---|---|
| CZT HV Monitor | 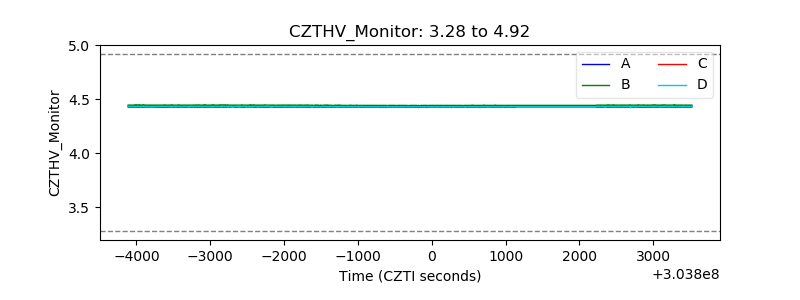 |
| D_VDD | 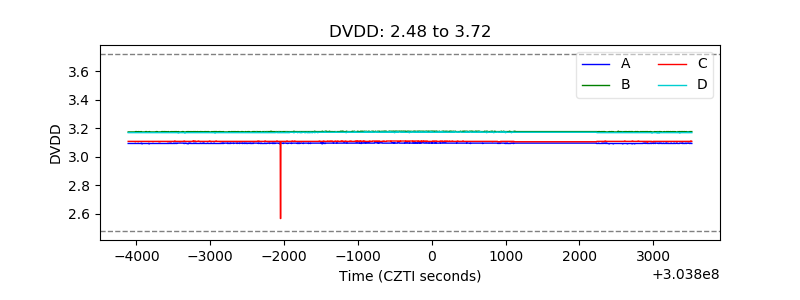 |
| Temperature 1 | 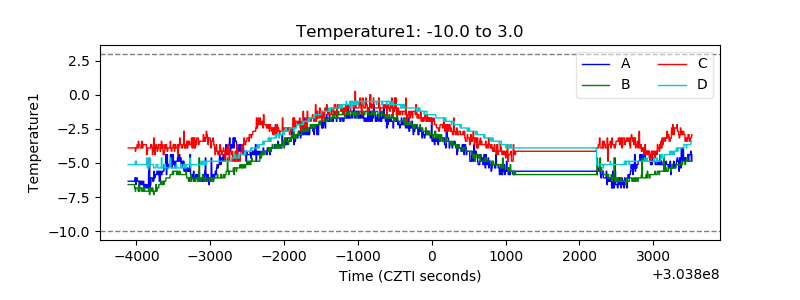 |
| Veto HV Monitor | 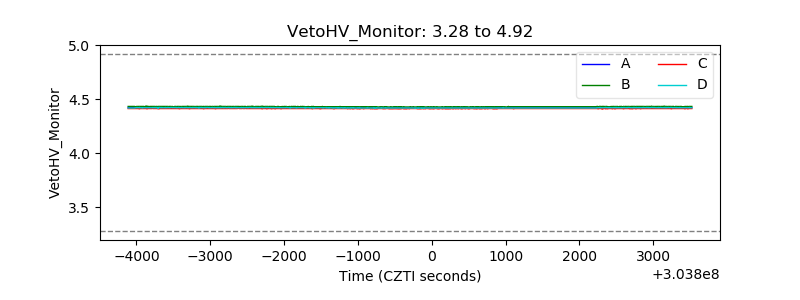 |
| Veto LLD | 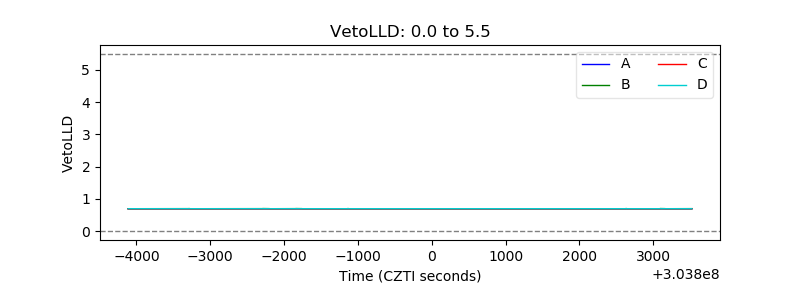 |
| Alpha Counter | 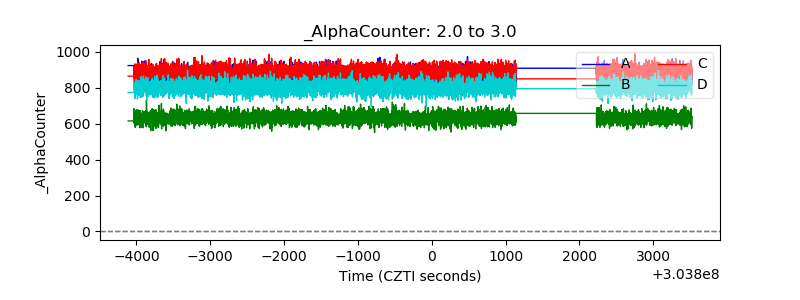 |
| _CPM_Rate | 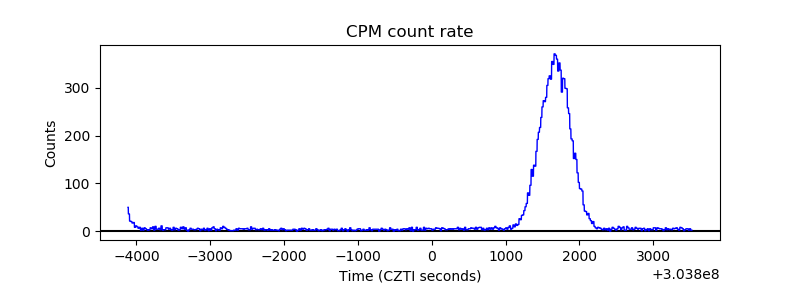 |
| CZT Counter | 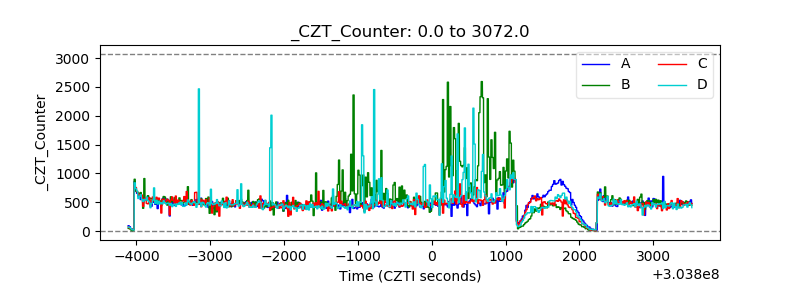 |
| +2.5 Volts monitor |  |
| +5 Volts monitor |  |
| _ROLL_ROT | 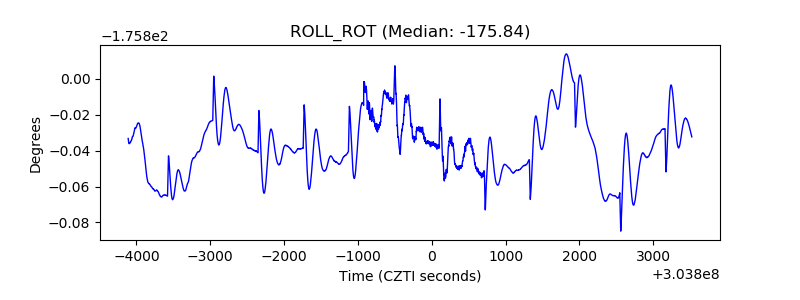 |
| _Roll_DEC | 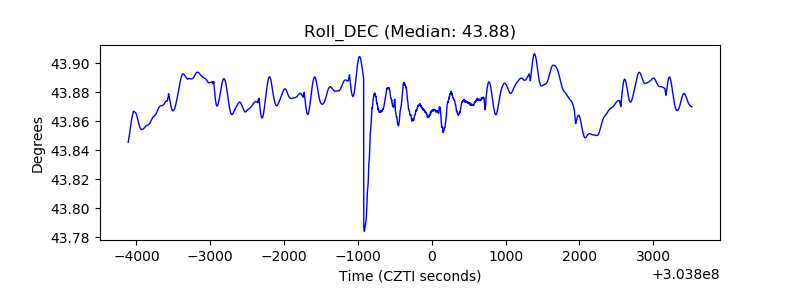 |
| _Roll_RA | 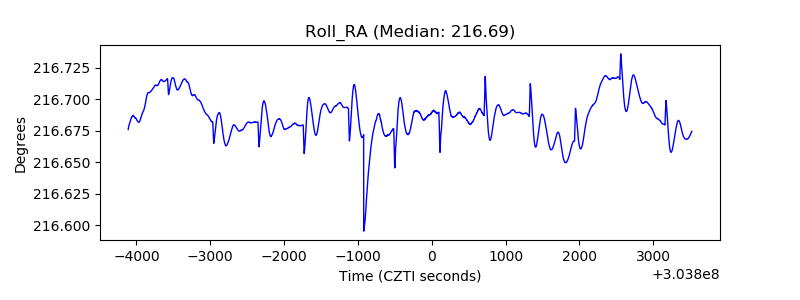 |
| Veto Counter | 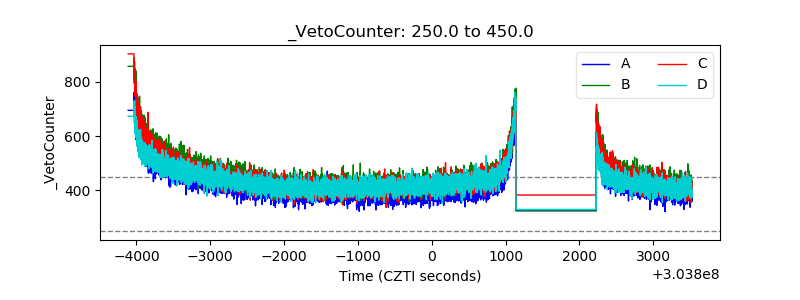 |